| Param | Original file | Final file |
|---|---|---|
| Filename | modeM0/AS1G08_071T01_9000001888_12855cztM0_level2.evt | modeM0/AS1G08_071T01_9000001888_12855cztM0_level2_quad_clean.evt |
| Size (bytes) | 213,396,480 | 31,481,280 |
| Size | 203.5 MB | 30.0 MB |
| Events in quadrant A | 1,390,085 | 197,680 |
| Events in quadrant B | 2,060,493 | 177,600 |
| Events in quadrant C | 1,329,390 | 194,504 |
| Events in quadrant D | 1,493,546 | 185,888 |
| Mode SS | |||
|---|---|---|---|
| Quadrant | BADHDUFLAG | Total packets | Discarded packets |
| A | 0 | 54 | 0 |
| B | 0 | 54 | 0 |
| C | 0 | 54 | 0 |
| D | 0 | 54 | 0 |
| Mode M9 | |||
|---|---|---|---|
| Quadrant | BADHDUFLAG | Total packets | Discarded packets |
| A | 0 | 4 | 0 |
| B | 0 | 4 | 0 |
| C | 0 | 4 | 0 |
| D | 0 | 5 | 0 |
| Mode M0 | |||
|---|---|---|---|
| Quadrant | BADHDUFLAG | Total packets | Discarded packets |
| A | 0 | 5801 | 1 |
| B | 0 | 7845 | 1 |
| C | 0 | 5625 | 1 |
| D | 0 | 6200 | 1 |
| Quadrant | Total seconds | Saturated seconds | Saturation percentage |
|---|---|---|---|
| A | 2758 | 8 | 0.290065% |
| B | 2758 | 292 | 10.587382% |
| C | 2758 | 4 | 0.145033% |
| D | 2758 | 37 | 1.341552% |
Noise dominated data is calculated using 1-second bins in cleaned event files. If a bin has >2000 counts, and if more than 50% of those come from <1% of pixels, then it is considered to be noise-dominated and hence unusable.
| Quadrant | # 1 sec bins | Bins with >0 counts | Bins with >2000 counts | High rate bins dominated by noise | Noise dominated (total time) | Noise dominated (detector-on time) | Marked lightcurve |
|---|---|---|---|---|---|---|---|
| A | 2758 | 2758 | 0 | 0 | 0.00% | 0.00% |  |
| B | 2758 | 2758 | 193 | 193 | 7.00% | 7.00% |  |
| C | 2758 | 2758 | 0 | 0 | 0.00% | 0.00% |  |
| D | 2758 | 2758 | 32 | 32 | 1.16% | 1.16% |  |
Top three noisy pixels from each quadrant. If the there are fewer than three noisy pixels in the level2.evt file, extra rows are filled as -1
| Pixel properties | Quadrant properties | ||||||
|---|---|---|---|---|---|---|---|
| Quadrant | DetID | PixID | Counts | Sigma | Mean | Median | Sigma |
| A | 12 | 189 | 16897 | 231.35 | 350 | 343 | 71.6 |
| A | 8 | 15 | 12996 | 176.83 | 350 | 343 | 71.6 |
| A | 3 | 9 | 9212 | 123.95 | 350 | 343 | 71.6 |
| B | 4 | 239 | 709228 | 11559.31 | 327 | 320 | 61.3 |
| B | 0 | 219 | 19661 | 315.37 | 327 | 320 | 61.3 |
| B | 0 | 85 | 17660 | 282.74 | 327 | 320 | 61.3 |
| C | 13 | 61 | 2501 | 27.44 | 340 | 342 | 78.7 |
| C | 14 | 234 | 1842 | 19.06 | 340 | 342 | 78.7 |
| C | 3 | 202 | 895 | 7.03 | 340 | 342 | 78.7 |
| D | 1 | 52 | 202417 | 2467.22 | 339 | 329 | 81.9 |
| D | 2 | 234 | 9141 | 107.58 | 339 | 329 | 81.9 |
| D | 13 | 104 | 4508 | 51.02 | 339 | 329 | 81.9 |
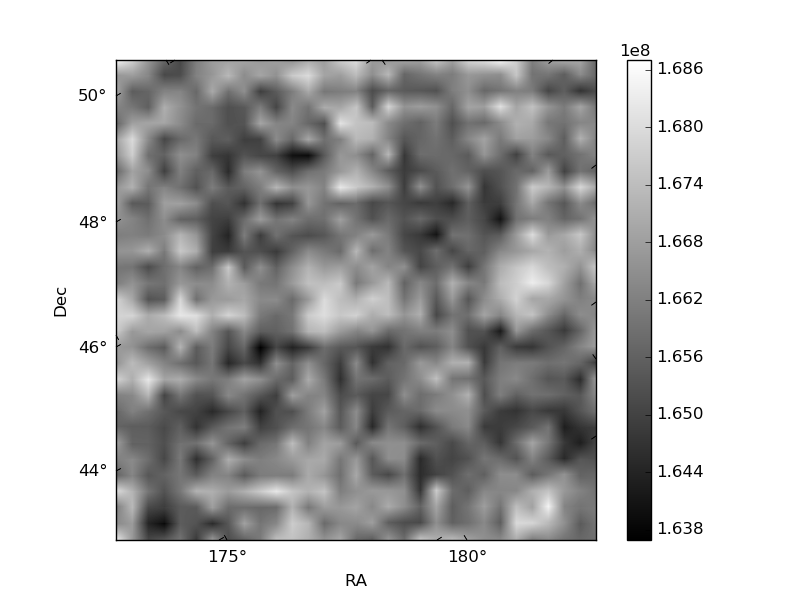
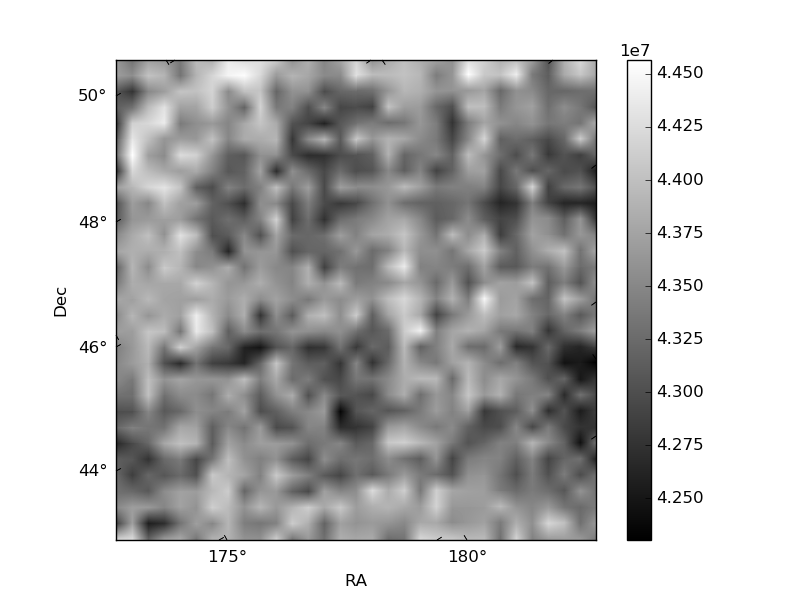
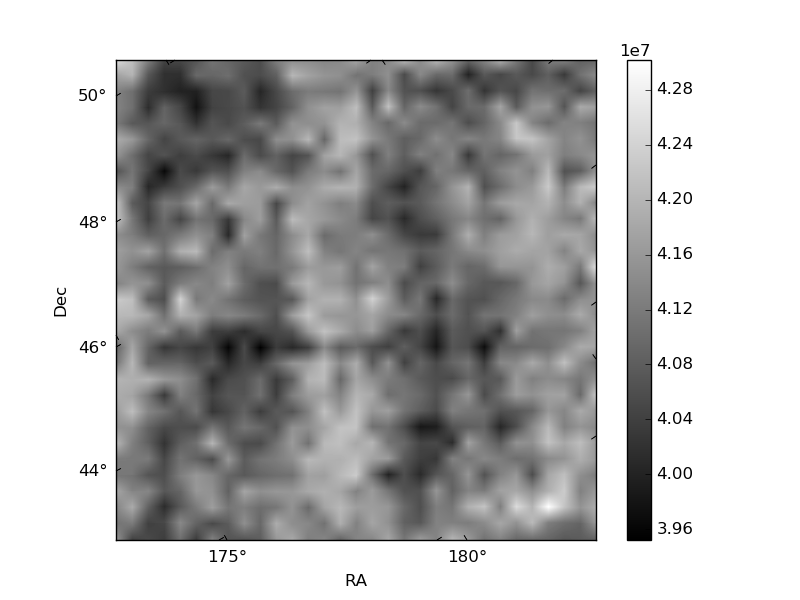
Histogram calculated using DETX and DETY for each event in the final _common_clean file
| Quadrant A | 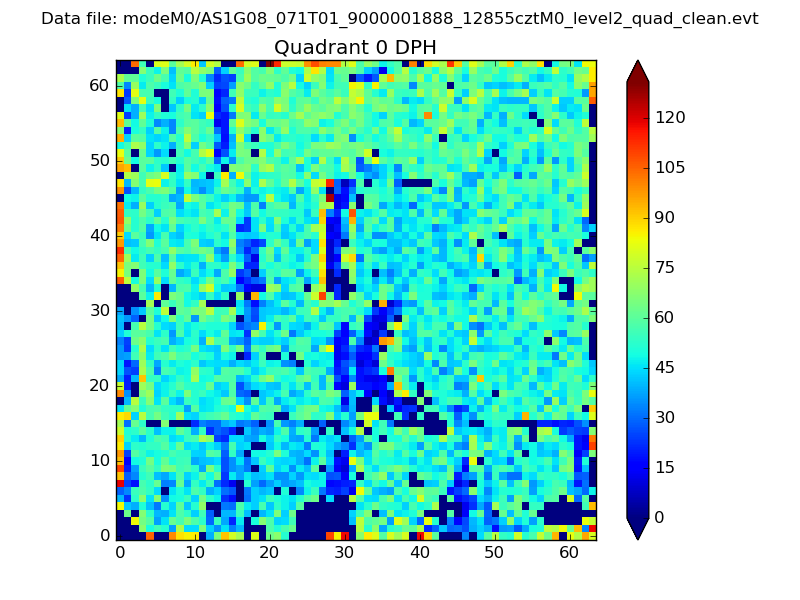 |
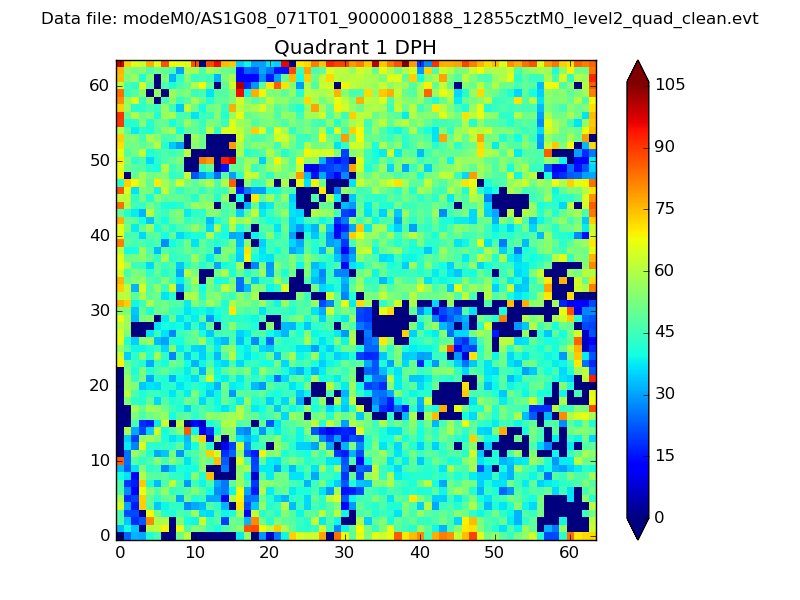 |
Quadrant B |
|---|---|---|---|
| Quadrant D |  |
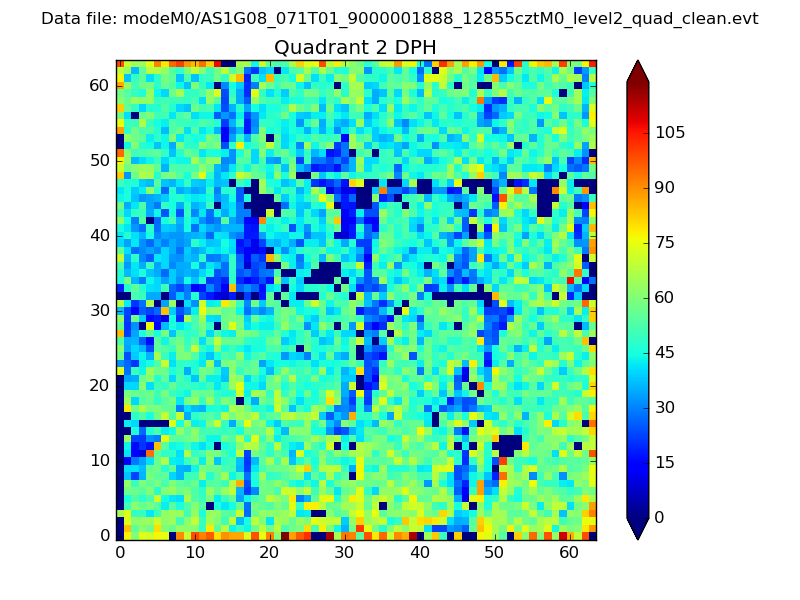 |
Quadrant C |
| Plot type | Count rate plots | Images |
|---|---|---|
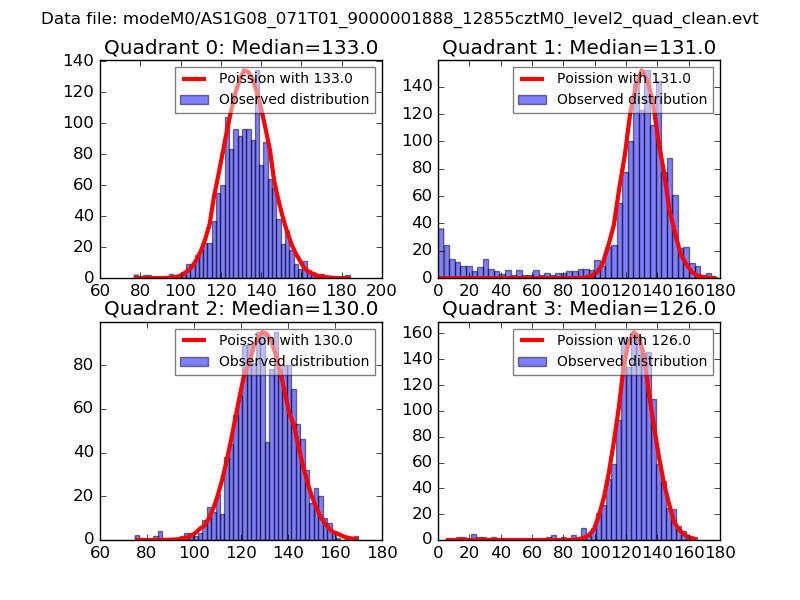
| Comparison with Poisson distribution Blue bars denote a histogram of data divided into 1 sec bins. Red curve is a Poisson curve with rate = median count rate of data. |
 |
 |
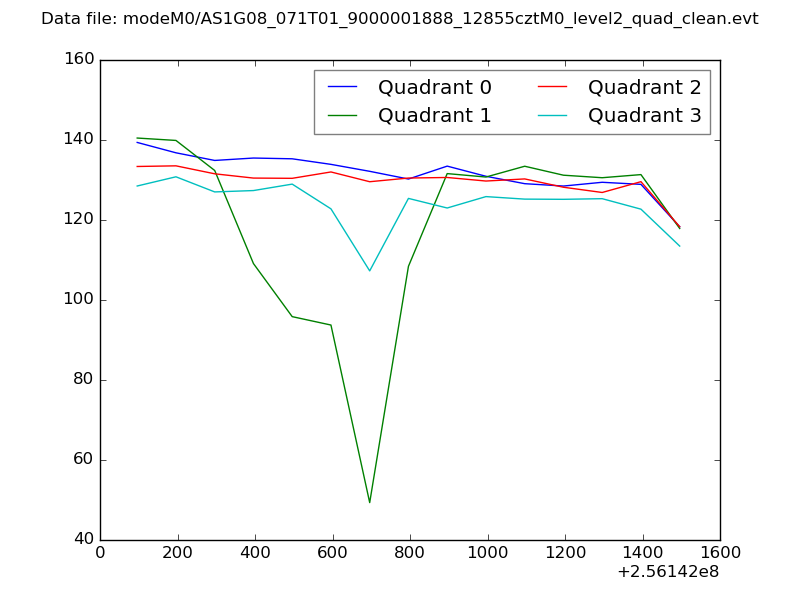
| Quadrant-wise count rates Data is divided into 100 sec bins |
 |
|
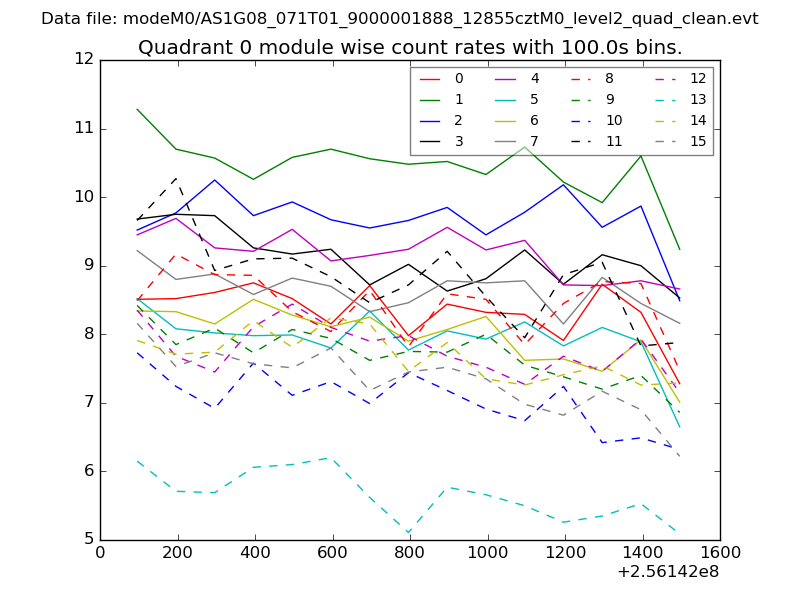
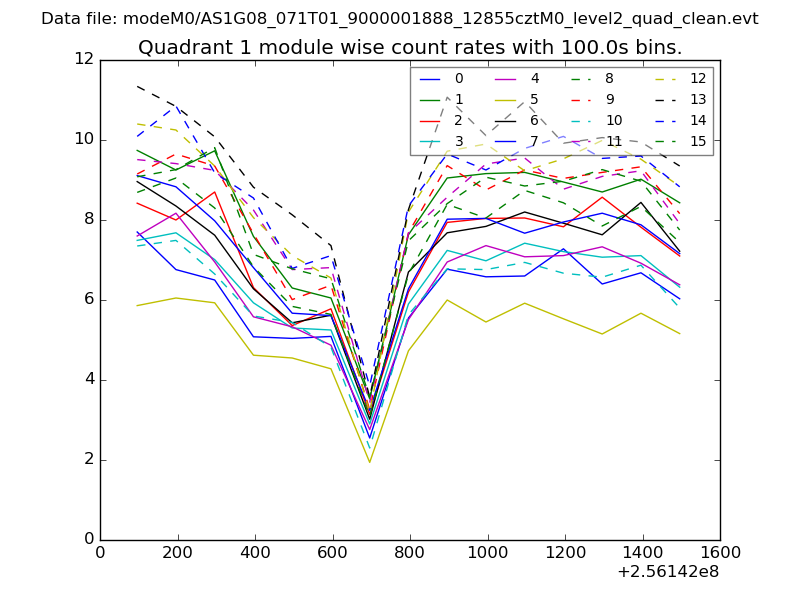
| Module-wise count rates for Quadrant A Data is divided into 100 sec bins |
 |
 |
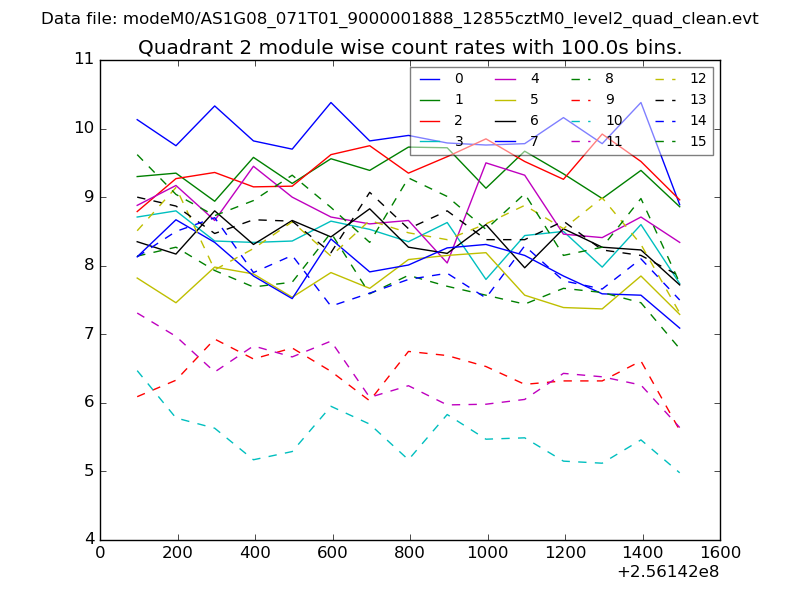
| Module-wise count rates for Quadrant B Data is divided into 100 sec bins |
 |
 |
| Module-wise count rates for Quadrant C Data is divided into 100 sec bins |
 |
 |
| Module-wise count rates for Quadrant D Data is divided into 100 sec bins |
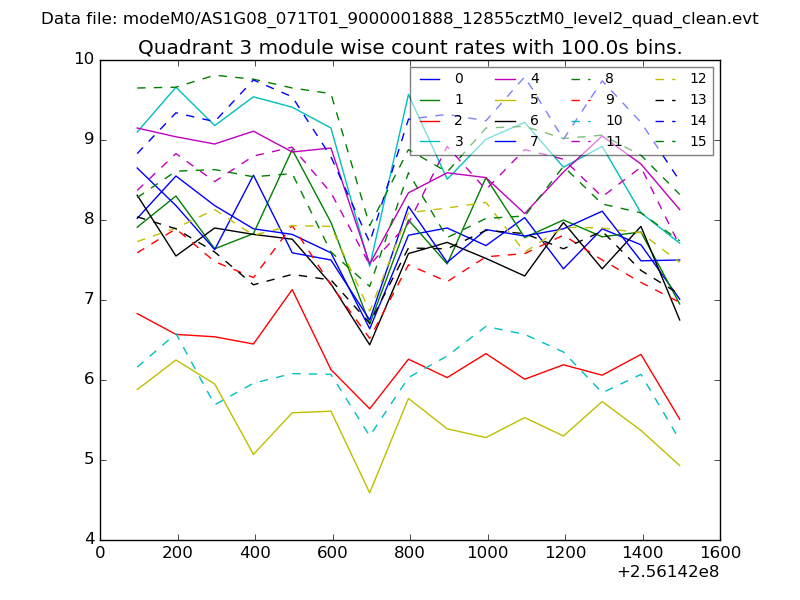 |
 |
| Parameter | Plot |
|---|---|
| CZT HV Monitor | 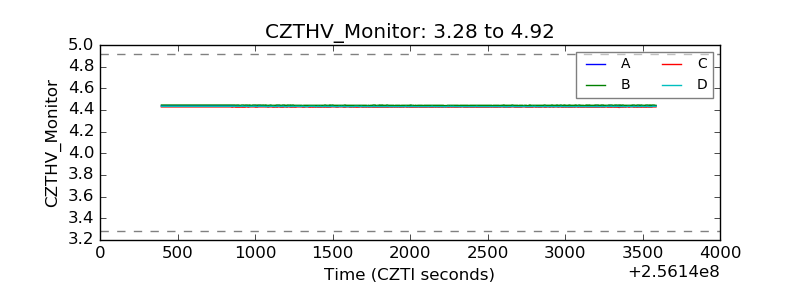 |
| D_VDD | 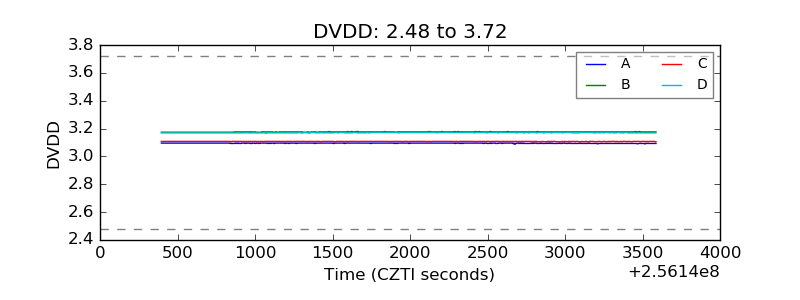 |
| Temperature 1 | 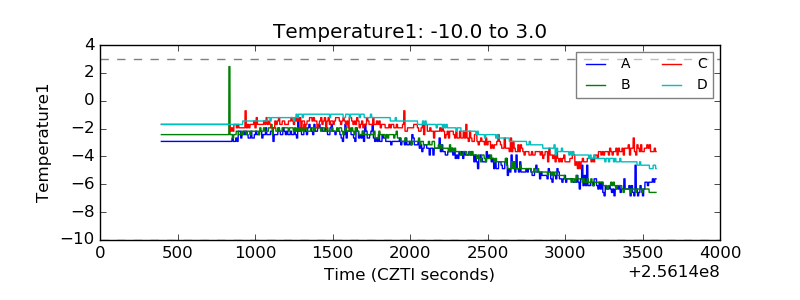 |
| Veto HV Monitor | 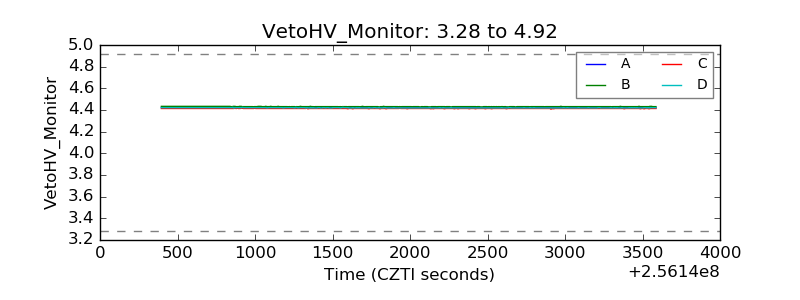 |
| Veto LLD | 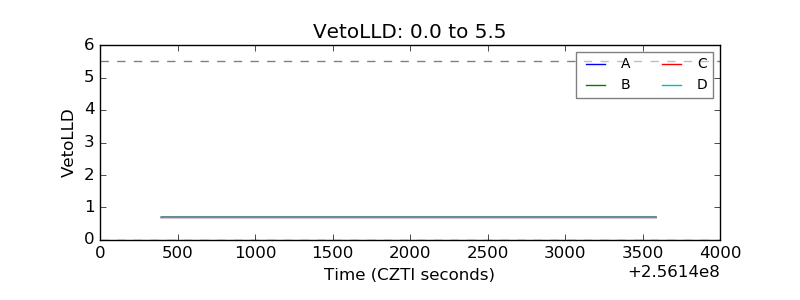 |
| Alpha Counter | 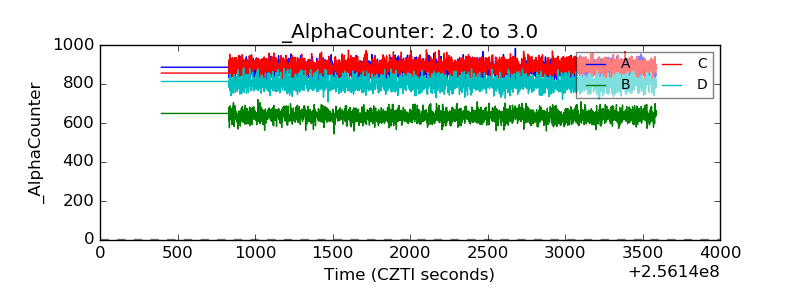 |
| _CPM_Rate | 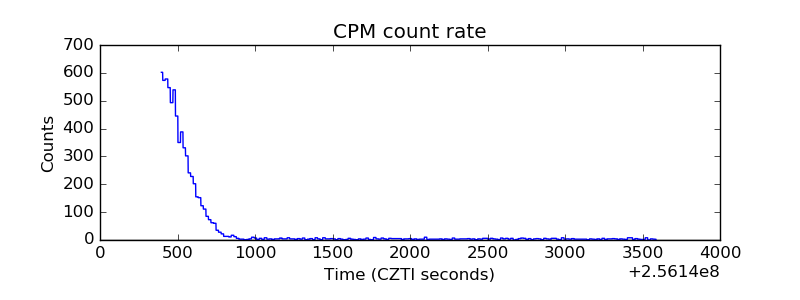 |
| CZT Counter | 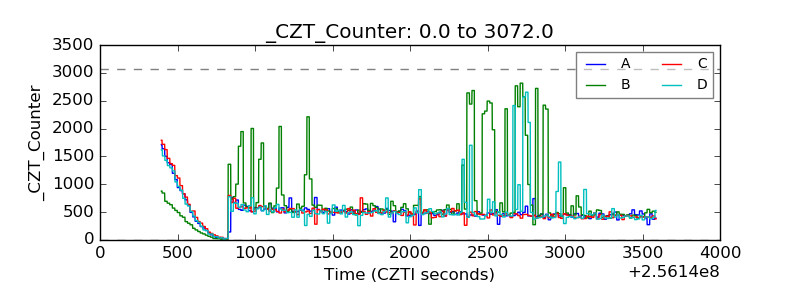 |
| +2.5 Volts monitor |  |
| +5 Volts monitor |  |
| _ROLL_ROT | 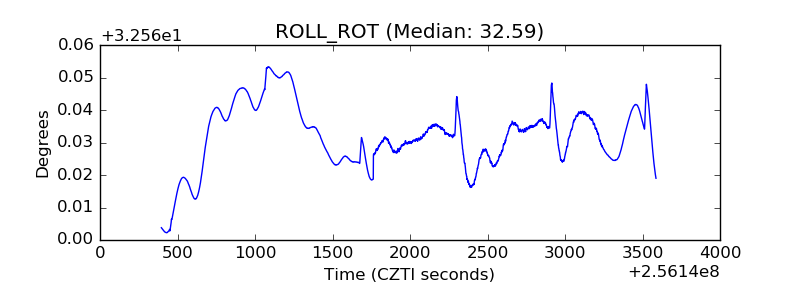 |
| _Roll_DEC | 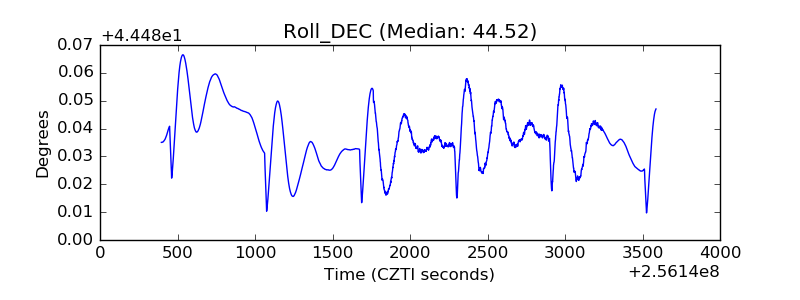 |
| _Roll_RA | 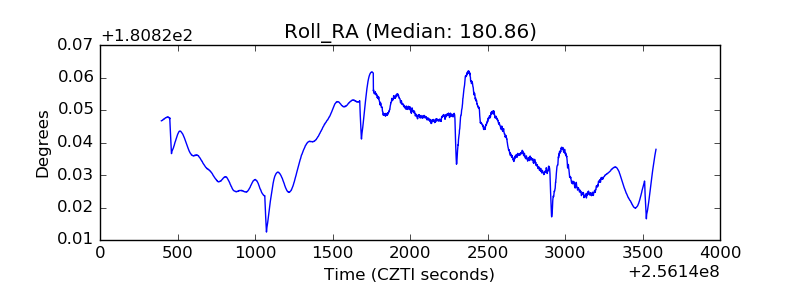 |
| Veto Counter | 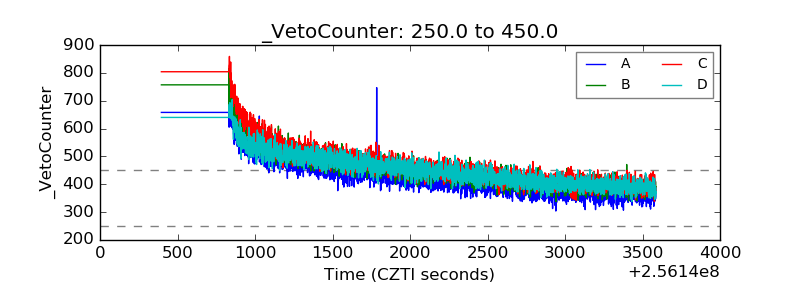 |