| Param | Original file | Final file |
|---|---|---|
| Filename | modeM0/AS1A04_048T01_9000001890cztM0_level2.fits | modeM0/AS1A04_048T01_9000001890cztM0_level2_quad_clean.evt |
| Size (bytes) | 599,713,920 | 533,678,400 |
| Size | 571.9 MB | 509.0 MB |
| Events in quadrant A | 3,711,328 | 3,174,112 |
| Events in quadrant B | 3,315,758 | 2,868,751 |
| Events in quadrant C | 3,679,870 | 3,054,304 |
| Events in quadrant D | 3,140,778 | 2,753,649 |
| Mode M9 | |||
|---|---|---|---|
| Quadrant | BADHDUFLAG | Total packets | Discarded packets |
| A | 0 | 88 | 0 |
| B | 0 | 88 | 0 |
| C | 0 | 88 | 0 |
| D | 0 | 88 | 0 |
| Mode SS | |||
|---|---|---|---|
| Quadrant | BADHDUFLAG | Total packets | Discarded packets |
| A | 0 | 1278 | 0 |
| B | 0 | 1278 | 0 |
| C | 0 | 1278 | 0 |
| D | 0 | 1278 | 0 |
| Mode M0 | |||
|---|---|---|---|
| Quadrant | BADHDUFLAG | Total packets | Discarded packets |
| A | 0 | 133341 | 0 |
| B | 0 | 189454 | 0 |
| C | 0 | 129100 | 0 |
| D | 0 | 152453 | 0 |
| Quadrant | Total seconds | Saturated seconds | Saturation percentage |
|---|---|---|---|
| A | 62854 | 734 | 1.167786% |
| B | 62854 | 7640 | 12.155153% |
| C | 62854 | 368 | 0.585484% |
| D | 62854 | 2545 | 4.049066% |
Noise dominated data is calculated using 1-second bins in cleaned event files. If a bin has >2000 counts, and if more than 50% of those come from <1% of pixels, then it is considered to be noise-dominated and hence unusable.
| Quadrant | # 1 sec bins | Bins with >0 counts | Bins with >2000 counts | High rate bins dominated by noise | Noise dominated (total time) | Noise dominated (detector-on time) | Marked lightcurve |
|---|---|---|---|---|---|---|---|
| A | 71634 | 62816 | 0 | 0 | 0.00% | 0.00% |  |
| B | 71634 | 62201 | 0 | 0 | 0.00% | 0.00% |  |
| C | 71634 | 62852 | 0 | 0 | 0.00% | 0.00% | 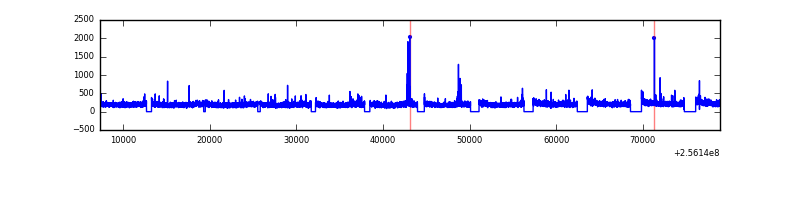 |
| D | 71634 | 62832 | 0 | 0 | 0.00% | 0.00% |  |
Top three noisy pixels from each quadrant. If the there are fewer than three noisy pixels in the level2.evt file, extra rows are filled as -1
| Pixel properties | Quadrant properties | ||||||
|---|---|---|---|---|---|---|---|
| Quadrant | DetID | PixID | Counts | Sigma | Mean | Median | Sigma |
| A | 0 | 29 | 3603 | 11.1 | 967 | 904 | 243.1 |
| A | 7 | 110 | 2958 | 8.45 | 967 | 904 | 243.1 |
| A | 9 | 19 | 2761 | 7.64 | 967 | 904 | 243.1 |
| B | 2 | 9 | 2947 | 12.31 | 873 | 834 | 171.7 |
| B | 3 | 17 | 2203 | 7.97 | 873 | 834 | 171.7 |
| B | 2 | 8 | 2202 | 7.97 | 873 | 834 | 171.7 |
| C | 1 | 80 | 2811 | 7.65 | 969 | 904 | 249.4 |
| C | 1 | 81 | 2773 | 7.49 | 969 | 904 | 249.4 |
| C | 12 | 241 | 2488 | 6.35 | 969 | 904 | 249.4 |
| D | 3 | 14 | 2298 | 6.26 | 895 | 817 | 236.7 |
| D | 6 | 231 | 2279 | 6.18 | 895 | 817 | 236.7 |
| D | 10 | 189 | 2167 | 5.7 | 895 | 817 | 236.7 |
Histogram calculated using DETX and DETY for each event in the final _common_clean file
| Quadrant A | 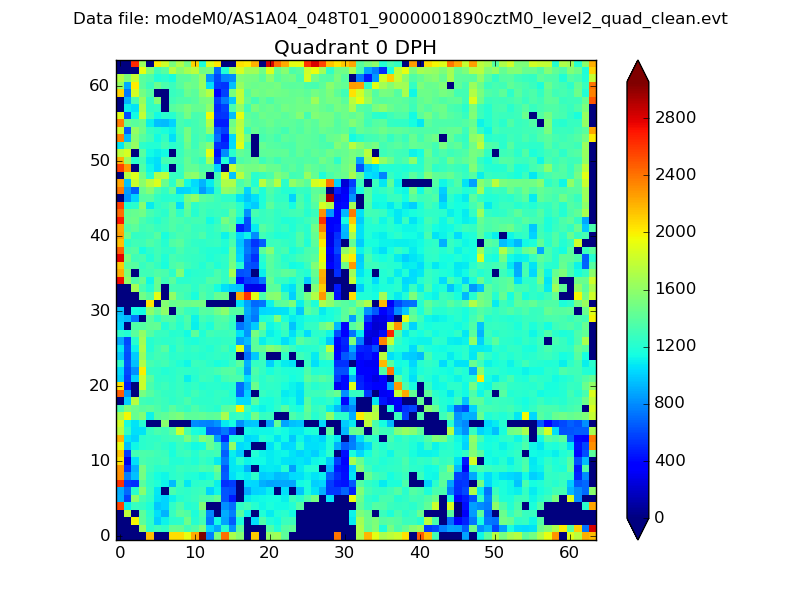 |
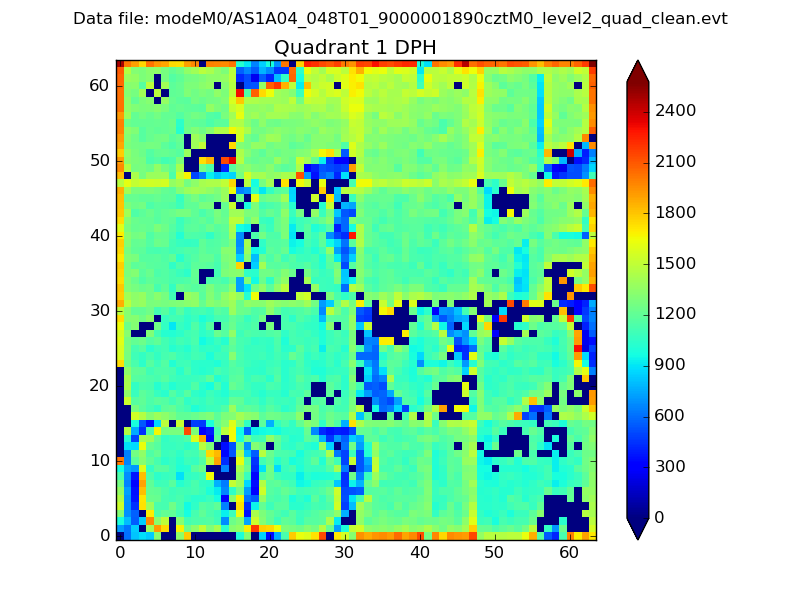 |
Quadrant B |
|---|---|---|---|
| Quadrant D | 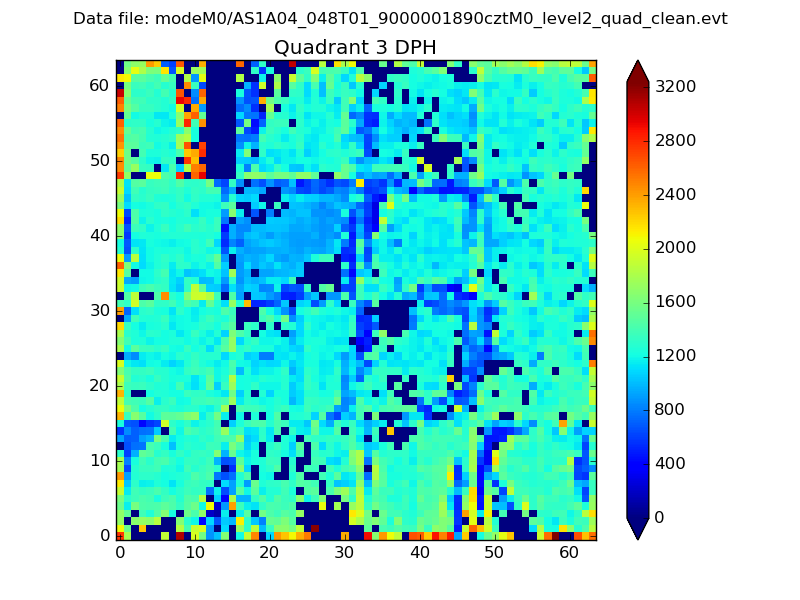 |
 |
Quadrant C |
| Plot type | Count rate plots | Images |
|---|---|---|
| Comparison with Poisson distribution Blue bars denote a histogram of data divided into 1 sec bins. Red curve is a Poisson curve with rate = median count rate of data. |
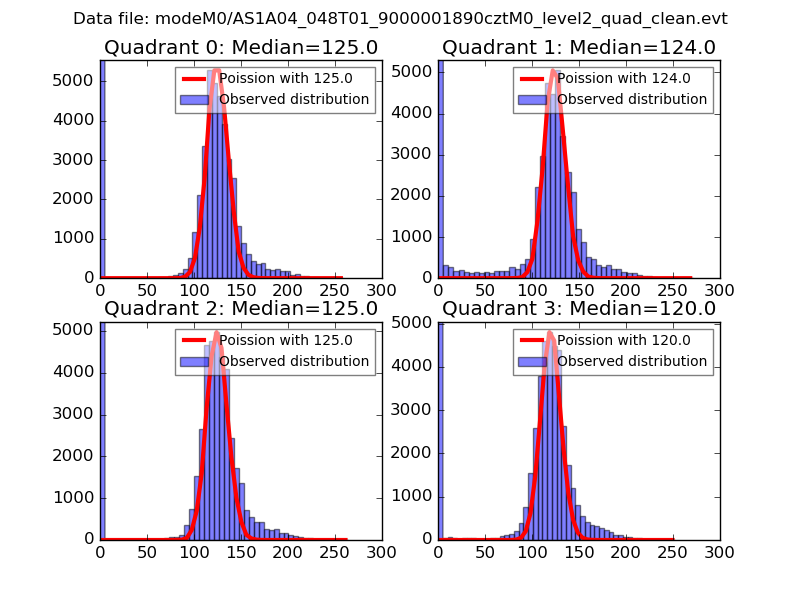 |
 |
| Quadrant-wise count rates Data is divided into 100 sec bins |
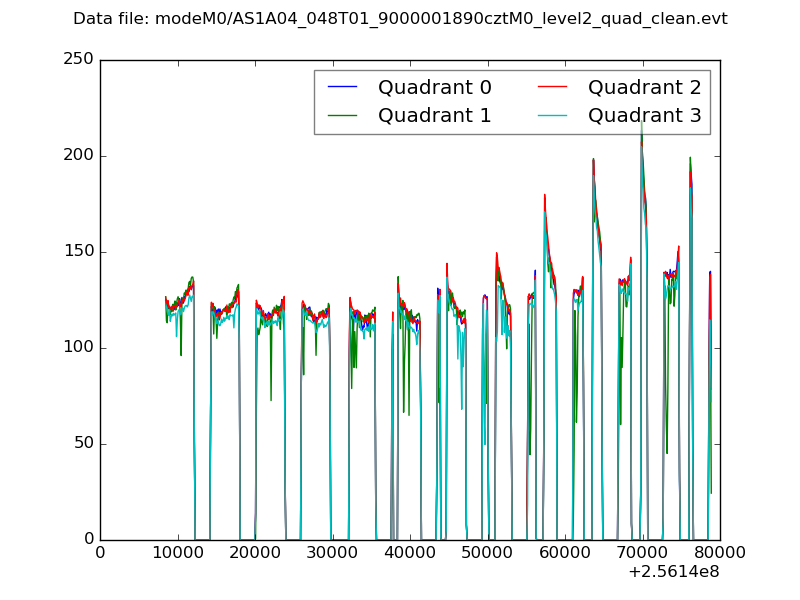 |
|
| Module-wise count rates for Quadrant A Data is divided into 100 sec bins |
 |
 |
| Module-wise count rates for Quadrant B Data is divided into 100 sec bins |
 |
 |
| Module-wise count rates for Quadrant C Data is divided into 100 sec bins |
 |
 |
| Module-wise count rates for Quadrant D Data is divided into 100 sec bins |
 |
 |
| Parameter | Plot |
|---|---|
| CZT HV Monitor |  |
| D_VDD | 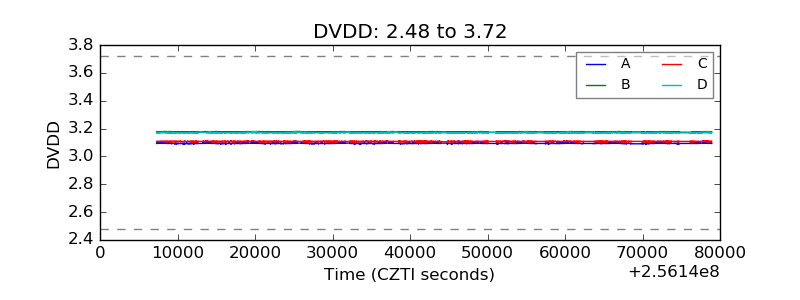 |
| Temperature 1 |  |
| Veto HV Monitor |  |
| Veto LLD | 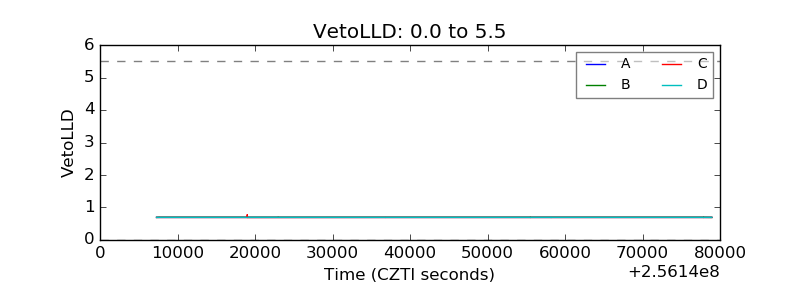 |
| Alpha Counter |  |
| _CPM_Rate | 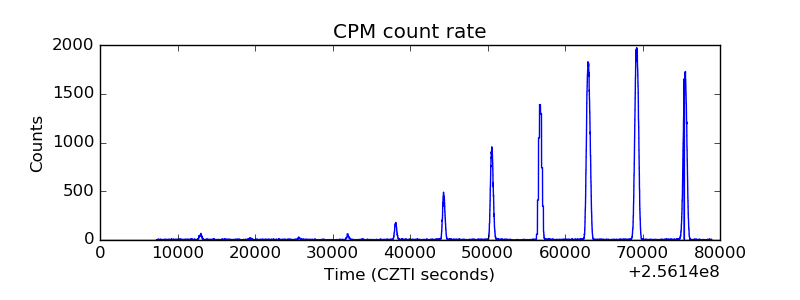 |
| CZT Counter |  |
| +2.5 Volts monitor |  |
| +5 Volts monitor | 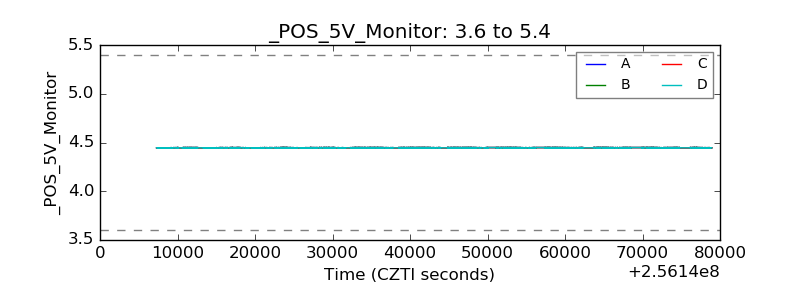 |
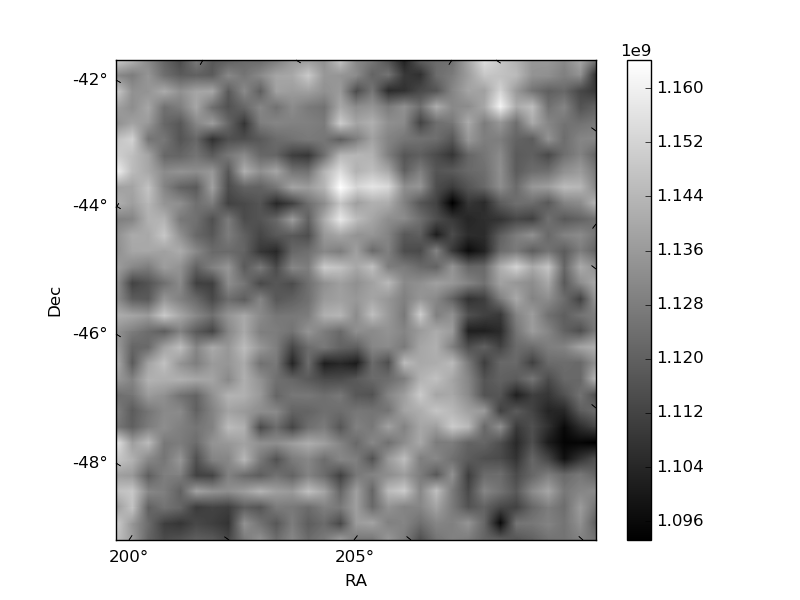
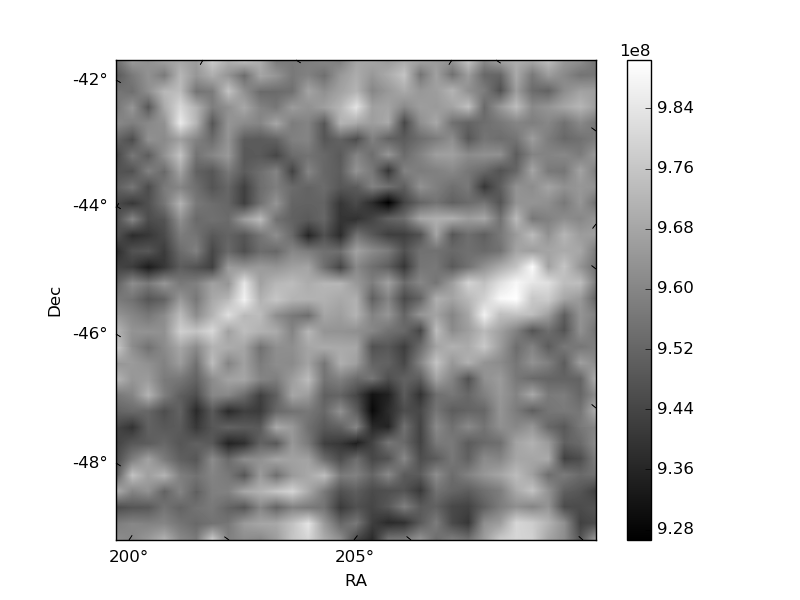
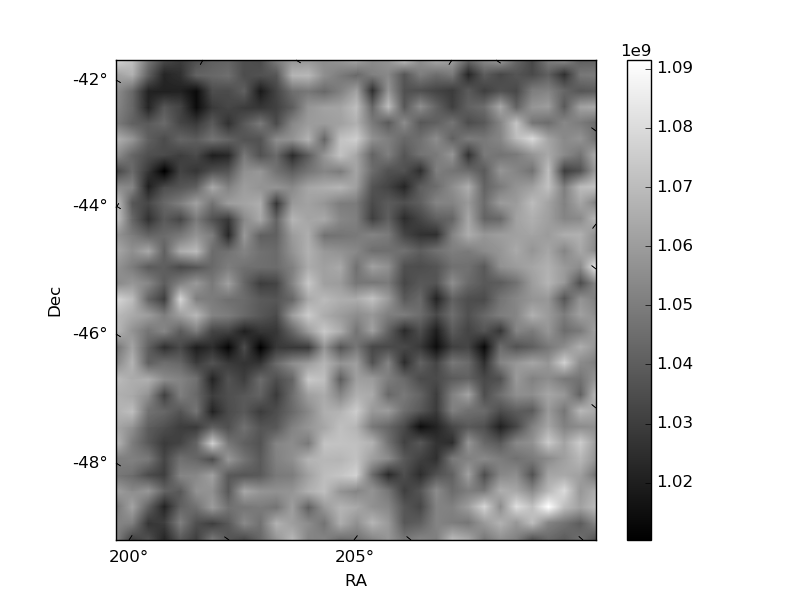
| _ROLL_ROT | 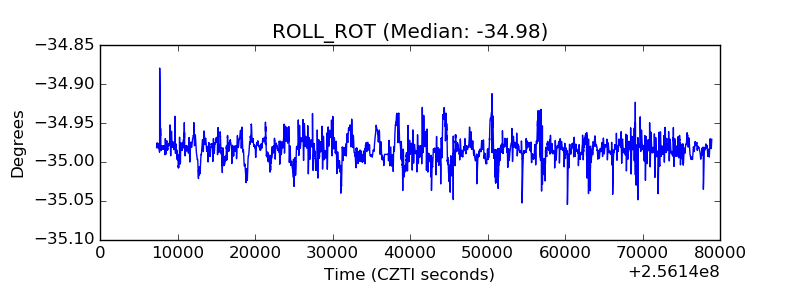 |
| _Roll_DEC |  |
| _Roll_RA |  |
| Veto Counter |  |