| Param | Original file | Final file |
|---|---|---|
| Filename | modeM0/AS1A04_048T01_9000001890_12856cztM0_level2.evt | modeM0/AS1A04_048T01_9000001890_12856cztM0_level2_quad_clean.evt |
| Size (bytes) | 490,308,480 | 84,052,800 |
| Size | 467.6 MB | 80.2 MB |
| Events in quadrant A | 3,471,637 | 521,622 |
| Events in quadrant B | 4,427,696 | 519,635 |
| Events in quadrant C | 3,157,491 | 522,924 |
| Events in quadrant D | 3,325,500 | 502,460 |
| Mode M9 | |||
|---|---|---|---|
| Quadrant | BADHDUFLAG | Total packets | Discarded packets |
| A | 0 | 6 | 0 |
| B | 0 | 6 | 0 |
| C | 0 | 6 | 0 |
| D | 0 | 6 | 0 |
| Mode SS | |||
|---|---|---|---|
| Quadrant | BADHDUFLAG | Total packets | Discarded packets |
| A | 0 | 138 | 0 |
| B | 0 | 138 | 0 |
| C | 0 | 138 | 0 |
| D | 0 | 138 | 0 |
| Mode M0 | |||
|---|---|---|---|
| Quadrant | BADHDUFLAG | Total packets | Discarded packets |
| A | 0 | 14677 | 2 |
| B | 0 | 17527 | 1 |
| C | 0 | 14043 | 1 |
| D | 0 | 14597 | 1 |
| Quadrant | Total seconds | Saturated seconds | Saturation percentage |
|---|---|---|---|
| A | 6874 | 103 | 1.498400% |
| B | 6874 | 465 | 6.764620% |
| C | 6874 | 36 | 0.523713% |
| D | 6874 | 77 | 1.120163% |
Noise dominated data is calculated using 1-second bins in cleaned event files. If a bin has >2000 counts, and if more than 50% of those come from <1% of pixels, then it is considered to be noise-dominated and hence unusable.
| Quadrant | # 1 sec bins | Bins with >0 counts | Bins with >2000 counts | High rate bins dominated by noise | Noise dominated (total time) | Noise dominated (detector-on time) | Marked lightcurve |
|---|---|---|---|---|---|---|---|
| A | 7460 | 6876 | 11 | 11 | 0.15% | 0.16% | 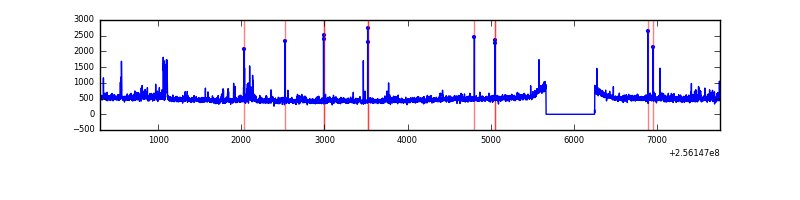 |
| B | 7460 | 6876 | 243 | 243 | 3.26% | 3.53% | 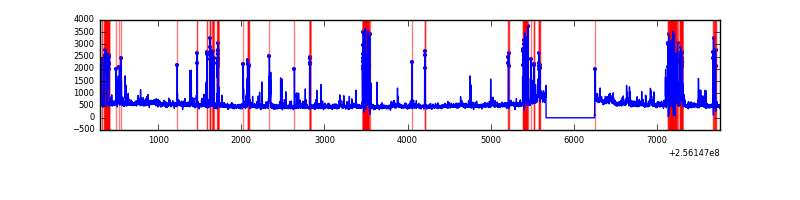 |
| C | 7460 | 6876 | 0 | 0 | 0.00% | 0.00% | 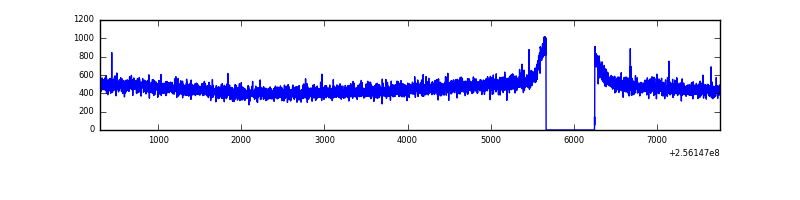 |
| D | 7460 | 6876 | 52 | 52 | 0.70% | 0.76% | 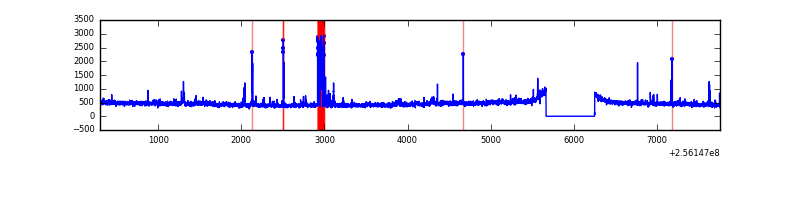 |
Top three noisy pixels from each quadrant. If the there are fewer than three noisy pixels in the level2.evt file, extra rows are filled as -1
| Pixel properties | Quadrant properties | ||||||
|---|---|---|---|---|---|---|---|
| Quadrant | DetID | PixID | Counts | Sigma | Mean | Median | Sigma |
| A | 12 | 189 | 152936 | 899.91 | 832 | 815 | 169.0 |
| A | 15 | 222 | 74450 | 435.61 | 832 | 815 | 169.0 |
| A | 8 | 15 | 22335 | 127.31 | 832 | 815 | 169.0 |
| B | 4 | 239 | 768196 | 4961.98 | 809 | 790 | 154.7 |
| B | 0 | 85 | 140709 | 904.7 | 809 | 790 | 154.7 |
| B | 0 | 219 | 108364 | 695.56 | 809 | 790 | 154.7 |
| C | 13 | 61 | 5935 | 27.21 | 809 | 814 | 188.2 |
| C | 3 | 202 | 2028 | 6.45 | 809 | 814 | 188.2 |
| C | 7 | 247 | 1819 | 5.34 | 809 | 814 | 188.2 |
| D | 1 | 52 | 212391 | 1096.28 | 805 | 783 | 193.0 |
| D | 13 | 104 | 43797 | 222.84 | 805 | 783 | 193.0 |
| D | 2 | 234 | 22180 | 110.85 | 805 | 783 | 193.0 |
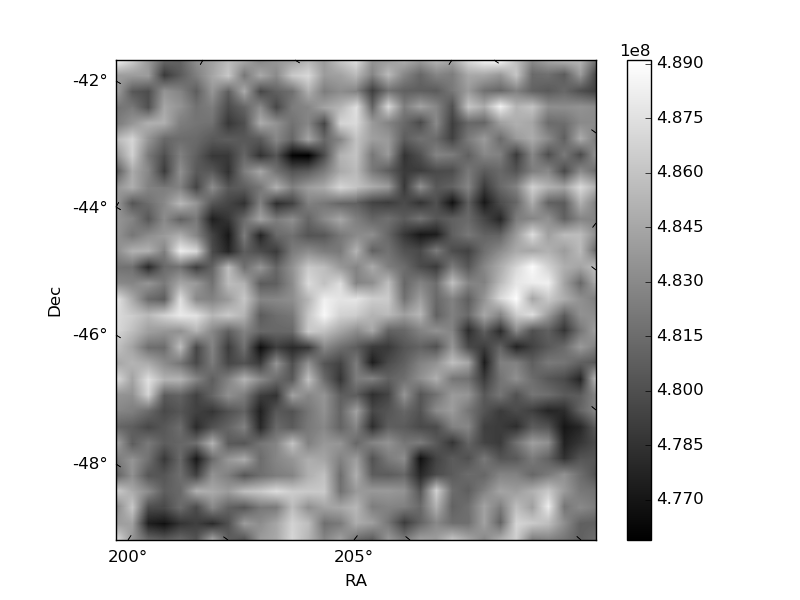
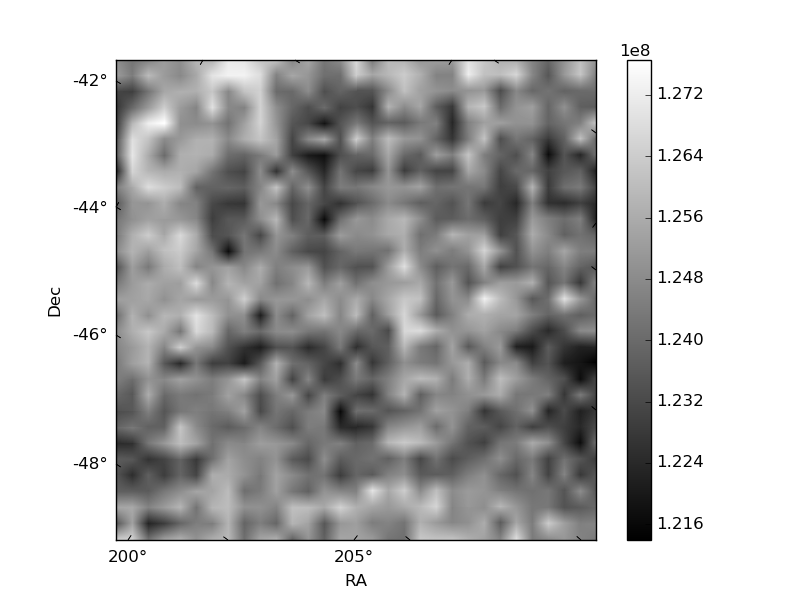
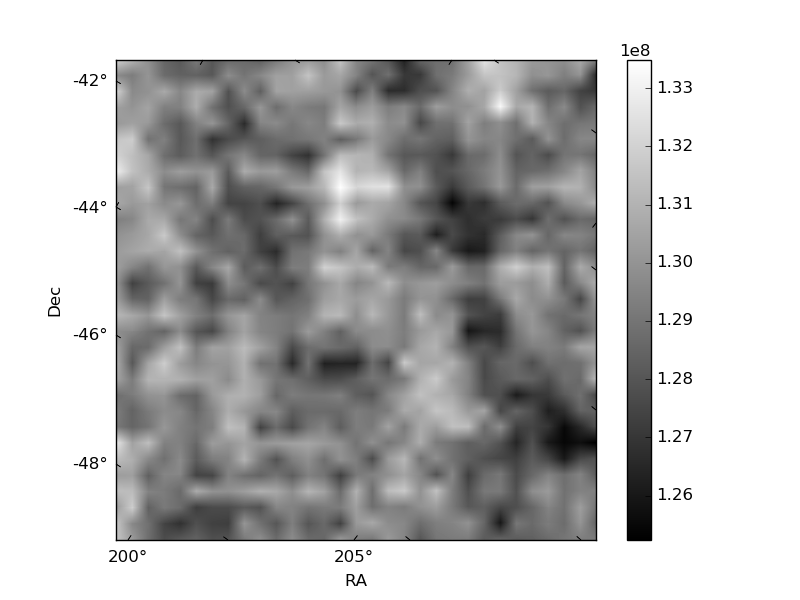
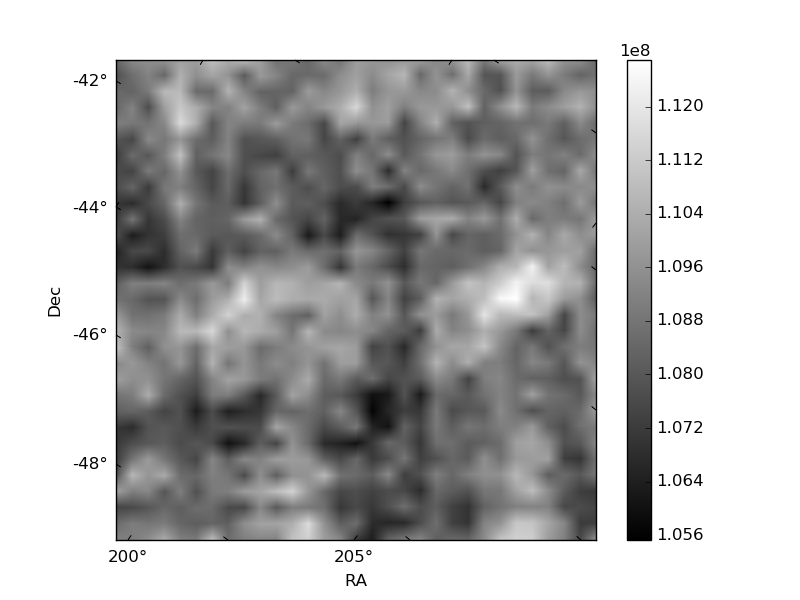
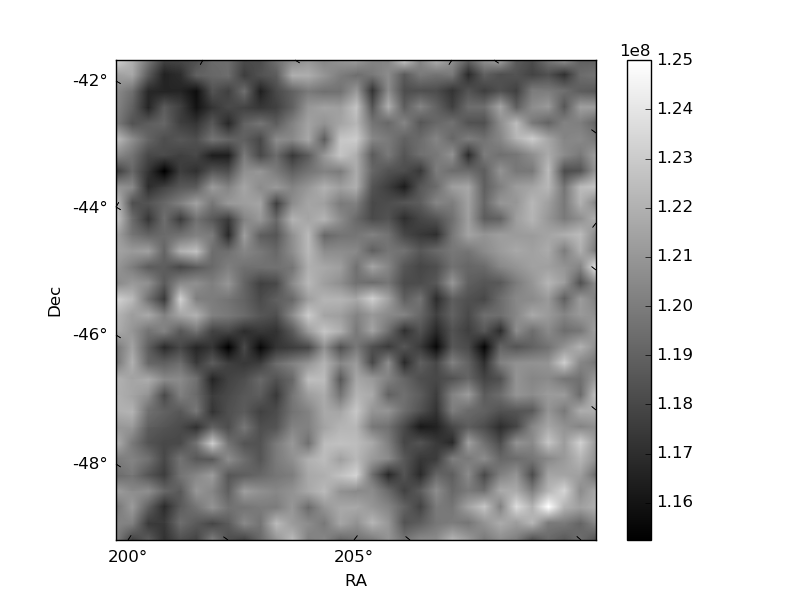
Histogram calculated using DETX and DETY for each event in the final _common_clean file
| Quadrant A | 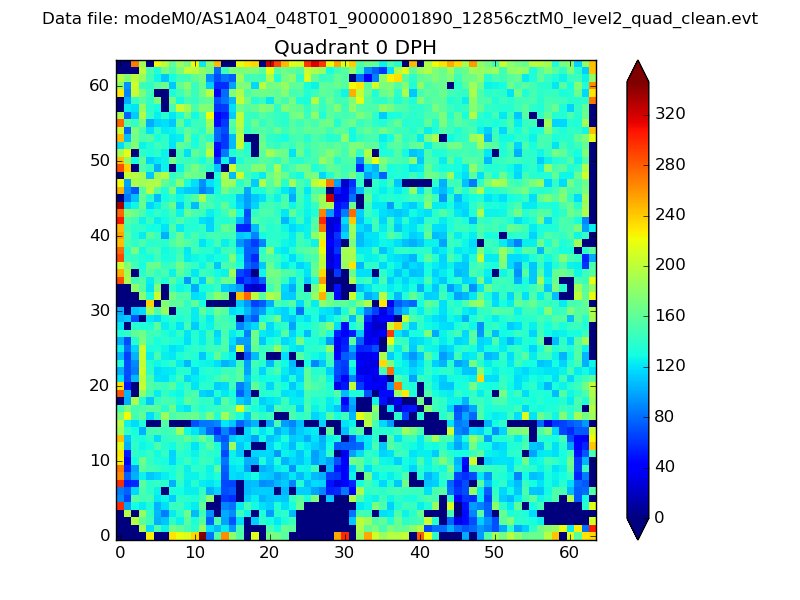 |
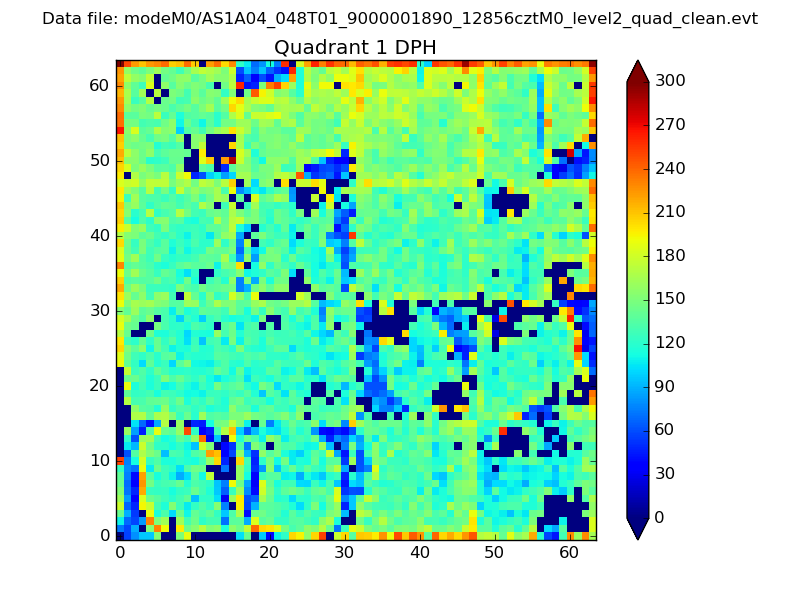 |
Quadrant B |
|---|---|---|---|
| Quadrant D | 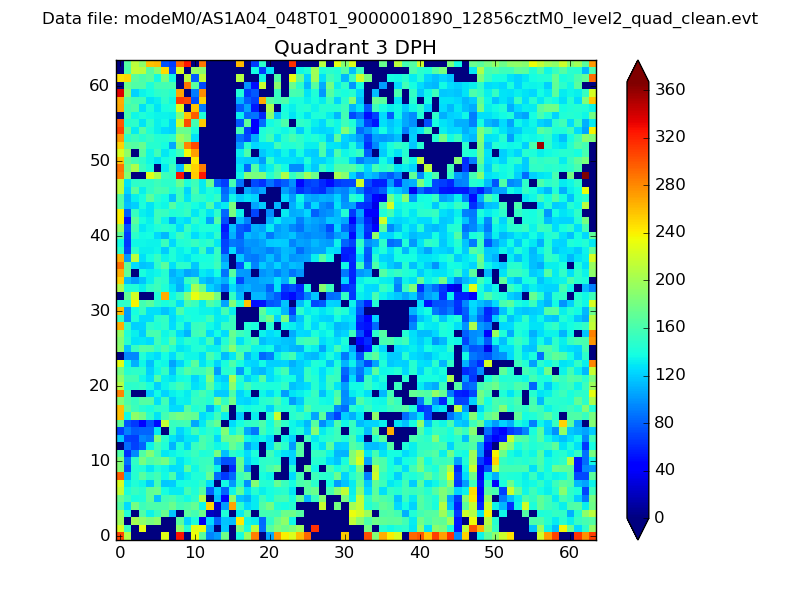 |
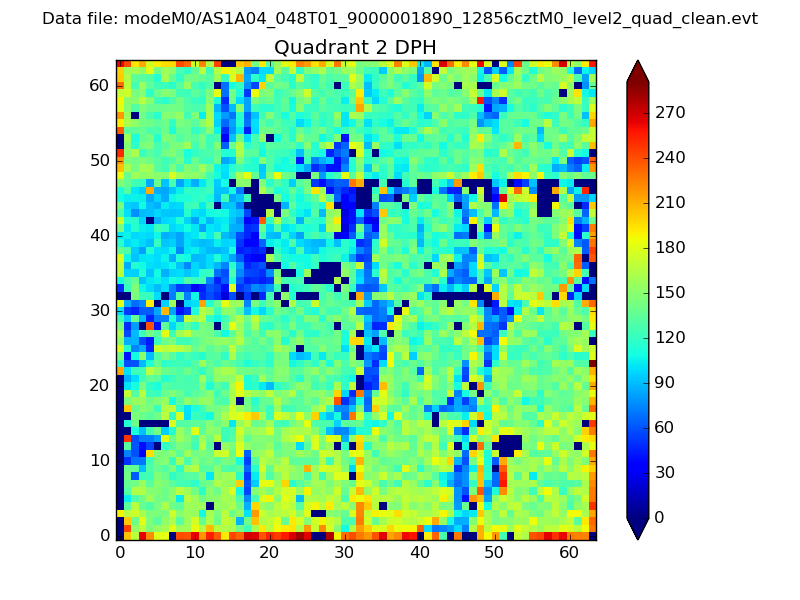 |
Quadrant C |
| Plot type | Count rate plots | Images |
|---|---|---|
| Comparison with Poisson distribution Blue bars denote a histogram of data divided into 1 sec bins. Red curve is a Poisson curve with rate = median count rate of data. |
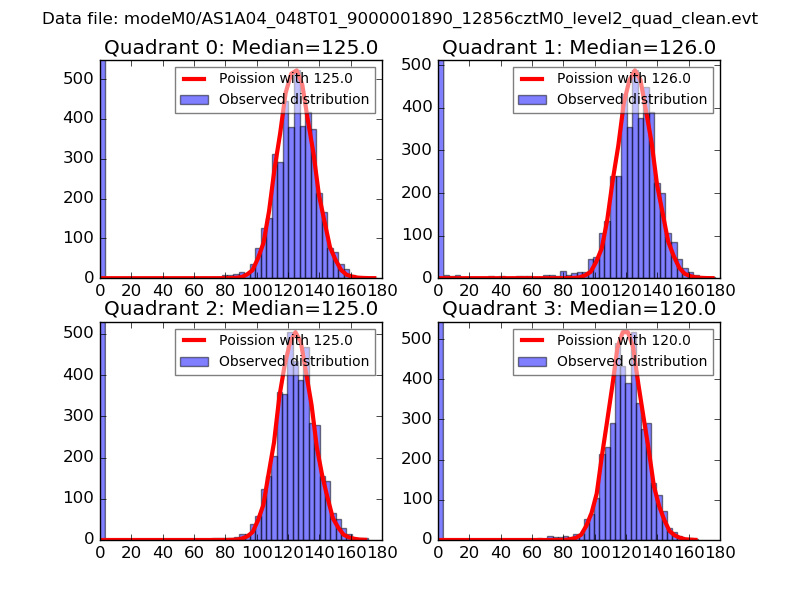 |
 |
| Quadrant-wise count rates Data is divided into 100 sec bins |
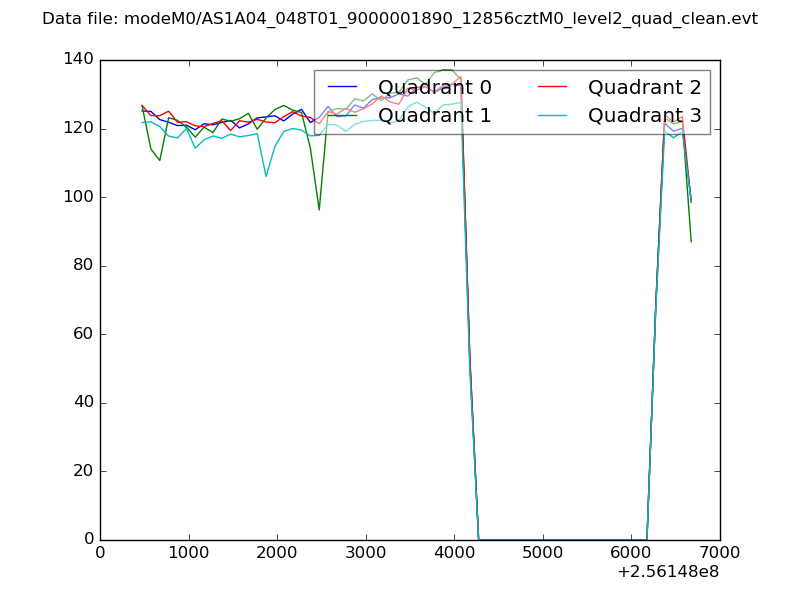 |
|
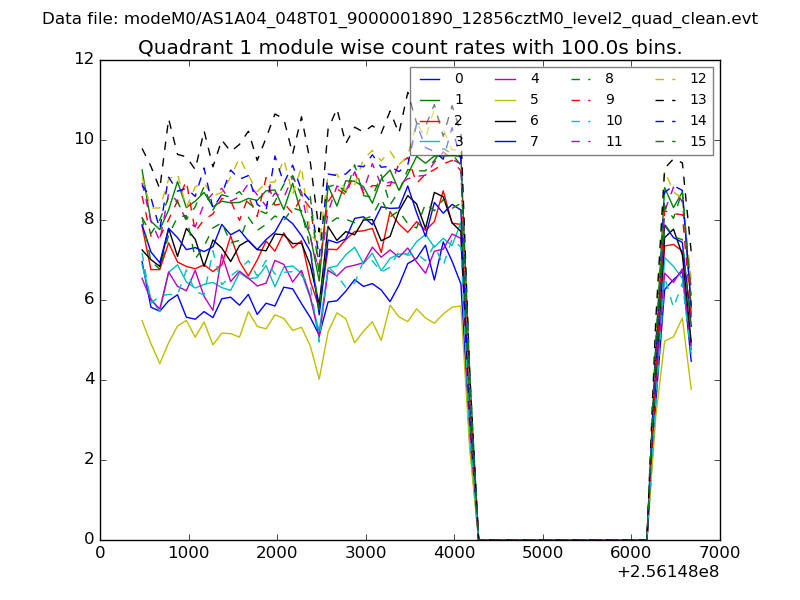
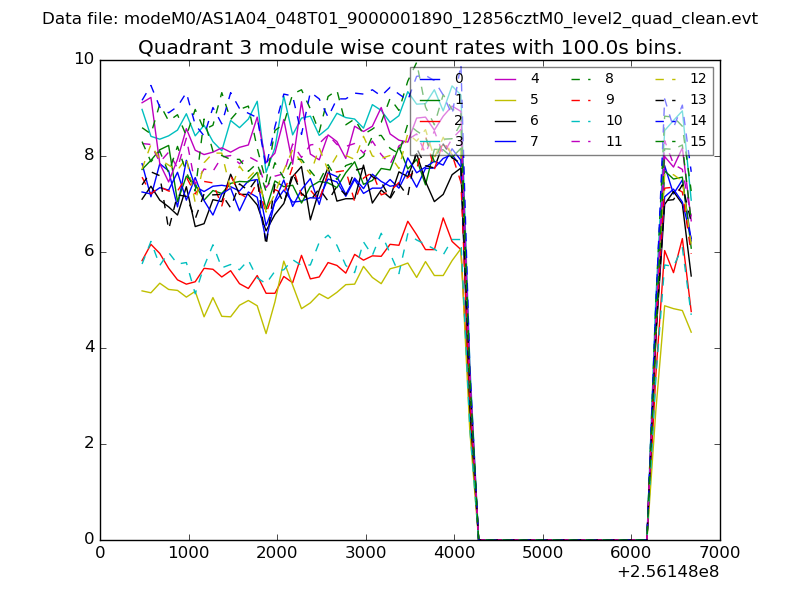
| Module-wise count rates for Quadrant A Data is divided into 100 sec bins |
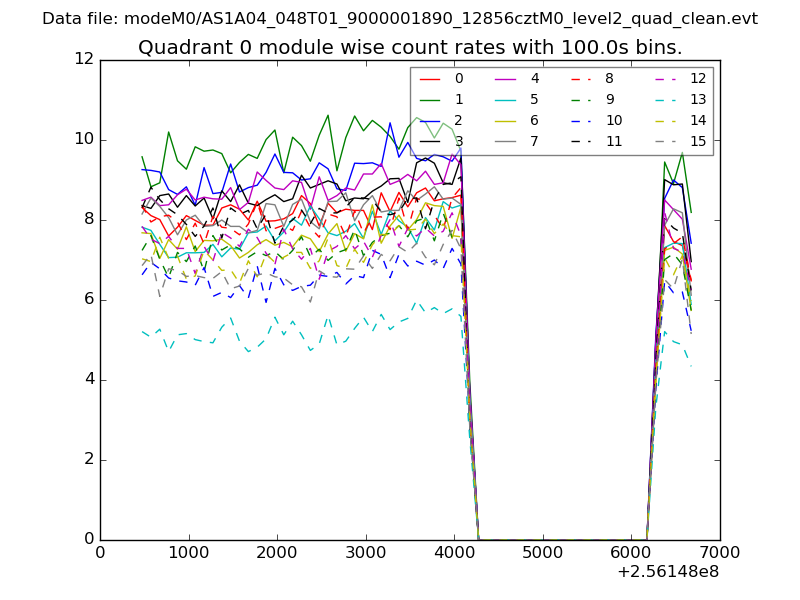 |
 |
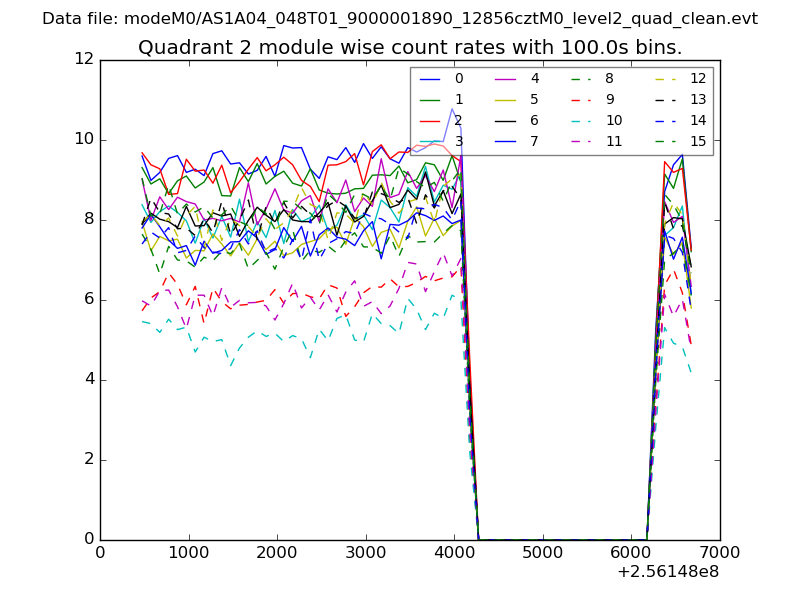
| Module-wise count rates for Quadrant B Data is divided into 100 sec bins |
 |
 |
| Module-wise count rates for Quadrant C Data is divided into 100 sec bins |
 |
 |
| Module-wise count rates for Quadrant D Data is divided into 100 sec bins |
 |
 |
| Parameter | Plot |
|---|---|
| CZT HV Monitor | 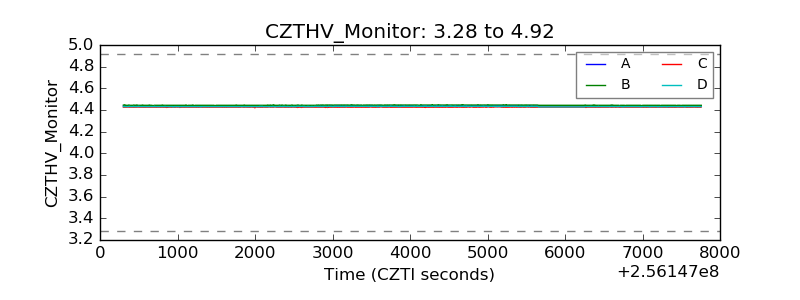 |
| D_VDD | 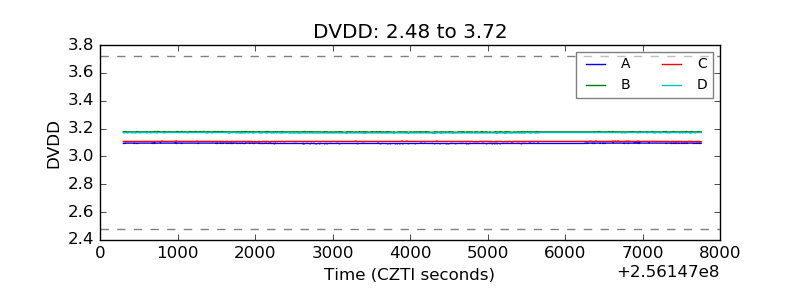 |
| Temperature 1 | 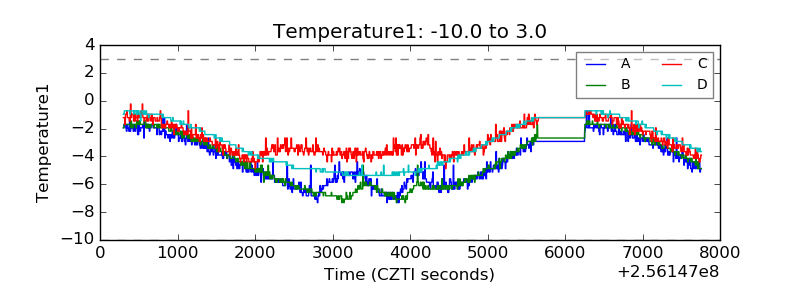 |
| Veto HV Monitor | 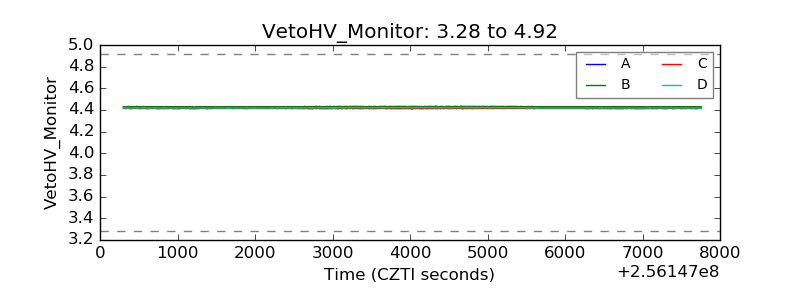 |
| Veto LLD | 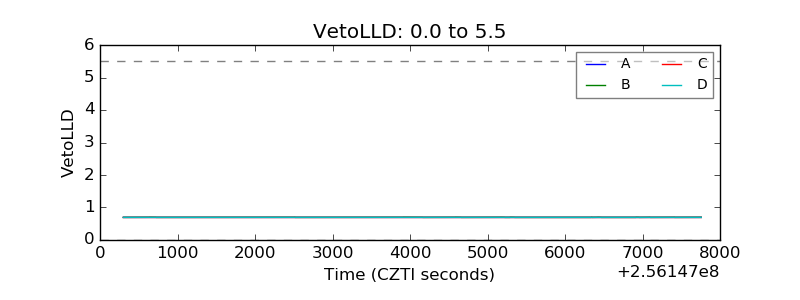 |
| Alpha Counter | 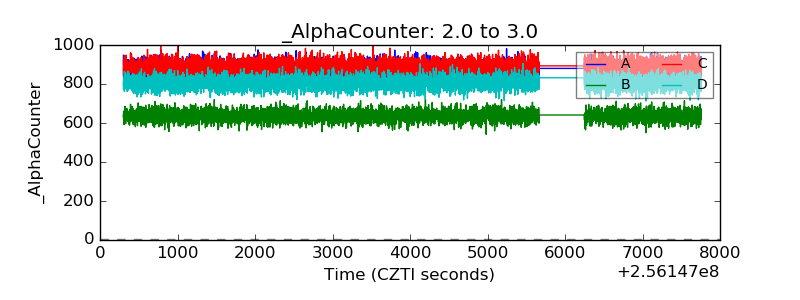 |
| _CPM_Rate | 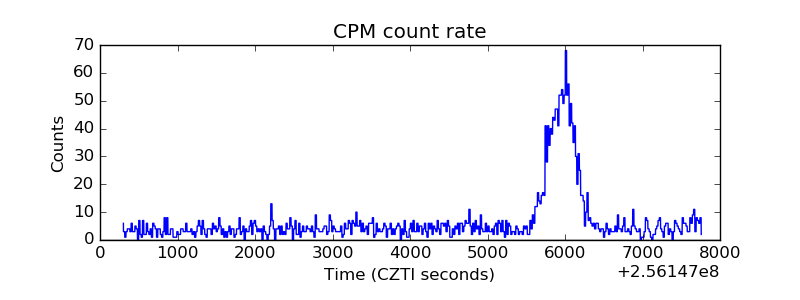 |
| CZT Counter | 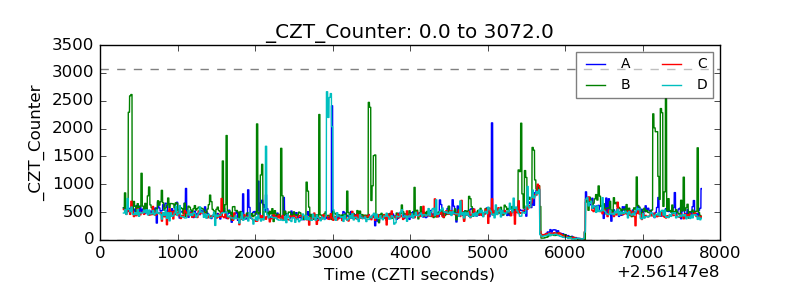 |
| +2.5 Volts monitor | 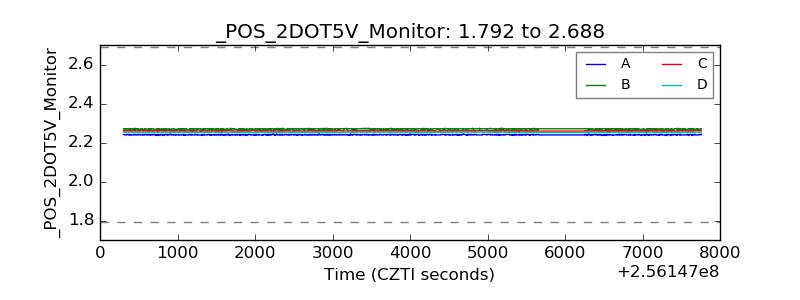 |
| +5 Volts monitor |  |
| _ROLL_ROT | 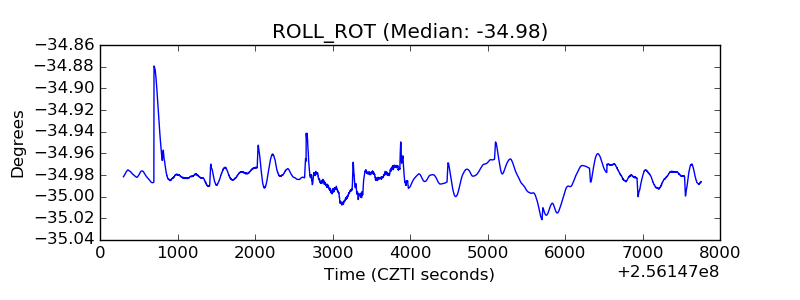 |
| _Roll_DEC | 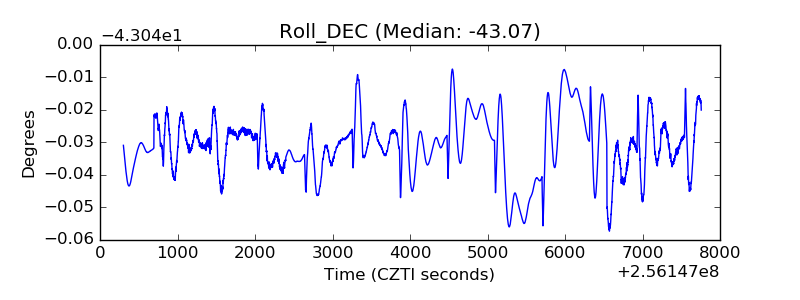 |
| _Roll_RA |  |
| Veto Counter | 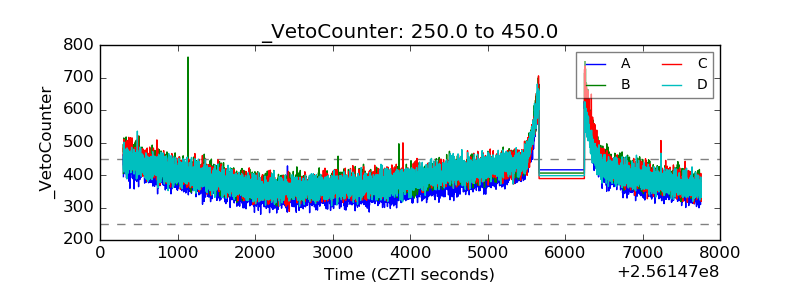 |