| Param | Original file | Final file |
|---|---|---|
| Filename | modeM0/AS1A04_048T01_9000001890_12857cztM0_level2.evt | modeM0/AS1A04_048T01_9000001890_12857cztM0_level2_quad_clean.evt |
| Size (bytes) | 631,451,520 | 94,026,240 |
| Size | 602.2 MB | 89.7 MB |
| Events in quadrant A | 4,267,332 | 578,803 |
| Events in quadrant B | 6,502,929 | 564,142 |
| Events in quadrant C | 3,831,033 | 578,899 |
| Events in quadrant D | 3,967,756 | 557,232 |
| Mode M9 | |||
|---|---|---|---|
| Quadrant | BADHDUFLAG | Total packets | Discarded packets |
| A | 0 | 8 | 0 |
| B | 0 | 8 | 0 |
| C | 0 | 8 | 0 |
| D | 0 | 8 | 0 |
| Mode SS | |||
|---|---|---|---|
| Quadrant | BADHDUFLAG | Total packets | Discarded packets |
| A | 0 | 166 | 0 |
| B | 0 | 166 | 0 |
| C | 0 | 166 | 0 |
| D | 0 | 166 | 0 |
| Mode M0 | |||
|---|---|---|---|
| Quadrant | BADHDUFLAG | Total packets | Discarded packets |
| A | 0 | 17852 | 3 |
| B | 0 | 24766 | 2 |
| C | 0 | 16972 | 2 |
| D | 0 | 17465 | 2 |
| Quadrant | Total seconds | Saturated seconds | Saturation percentage |
|---|---|---|---|
| A | 8180 | 185 | 2.261614% |
| B | 8180 | 1134 | 13.863081% |
| C | 8180 | 71 | 0.867971% |
| D | 8180 | 78 | 0.953545% |
Noise dominated data is calculated using 1-second bins in cleaned event files. If a bin has >2000 counts, and if more than 50% of those come from <1% of pixels, then it is considered to be noise-dominated and hence unusable.
| Quadrant | # 1 sec bins | Bins with >0 counts | Bins with >2000 counts | High rate bins dominated by noise | Noise dominated (total time) | Noise dominated (detector-on time) | Marked lightcurve |
|---|---|---|---|---|---|---|---|
| A | 8961 | 8183 | 5 | 5 | 0.06% | 0.06% | 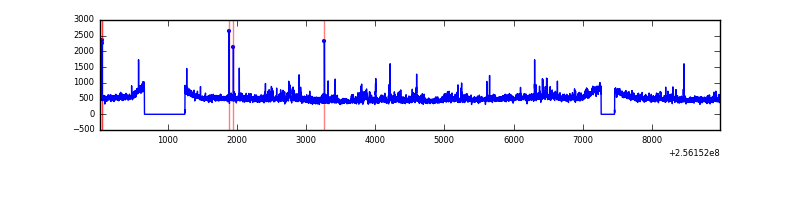 |
| B | 8961 | 8183 | 551 | 551 | 6.15% | 6.73% | 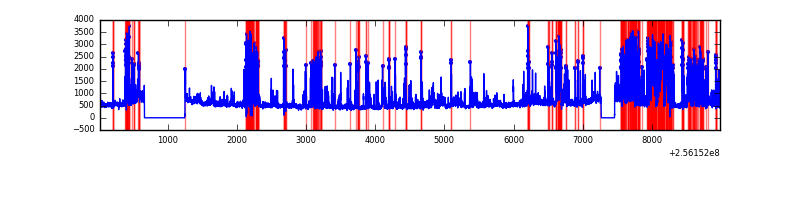 |
| C | 8961 | 8183 | 0 | 0 | 0.00% | 0.00% | 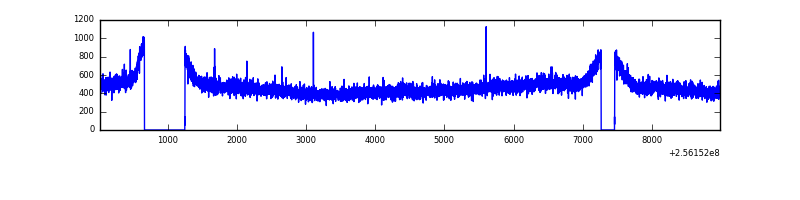 |
| D | 8961 | 8183 | 25 | 25 | 0.28% | 0.31% | 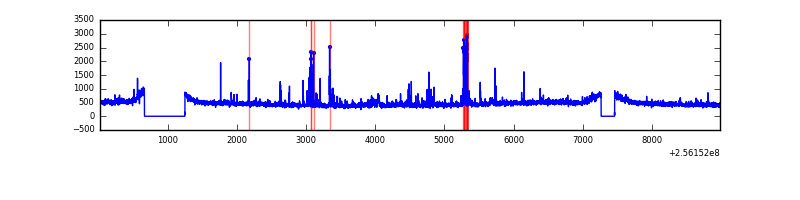 |
Top three noisy pixels from each quadrant. If the there are fewer than three noisy pixels in the level2.evt file, extra rows are filled as -1
| Pixel properties | Quadrant properties | ||||||
|---|---|---|---|---|---|---|---|
| Quadrant | DetID | PixID | Counts | Sigma | Mean | Median | Sigma |
| A | 12 | 189 | 260652 | 1256.24 | 1011 | 988 | 206.7 |
| A | 1 | 162 | 40584 | 191.56 | 1011 | 988 | 206.7 |
| A | 8 | 15 | 30579 | 143.16 | 1011 | 988 | 206.7 |
| B | 4 | 239 | 2090976 | 11527.16 | 941 | 917 | 181.3 |
| B | 0 | 85 | 344371 | 1894.23 | 941 | 917 | 181.3 |
| B | 3 | 64 | 126966 | 695.19 | 941 | 917 | 181.3 |
| C | 13 | 61 | 7211 | 27.49 | 982 | 985 | 226.5 |
| C | 14 | 234 | 2981 | 8.81 | 982 | 985 | 226.5 |
| C | 3 | 202 | 2354 | 6.04 | 982 | 985 | 226.5 |
| D | 1 | 52 | 102208 | 429.75 | 980 | 953 | 235.6 |
| D | 4 | 95 | 84799 | 355.86 | 980 | 953 | 235.6 |
| D | 13 | 104 | 57482 | 239.92 | 980 | 953 | 235.6 |
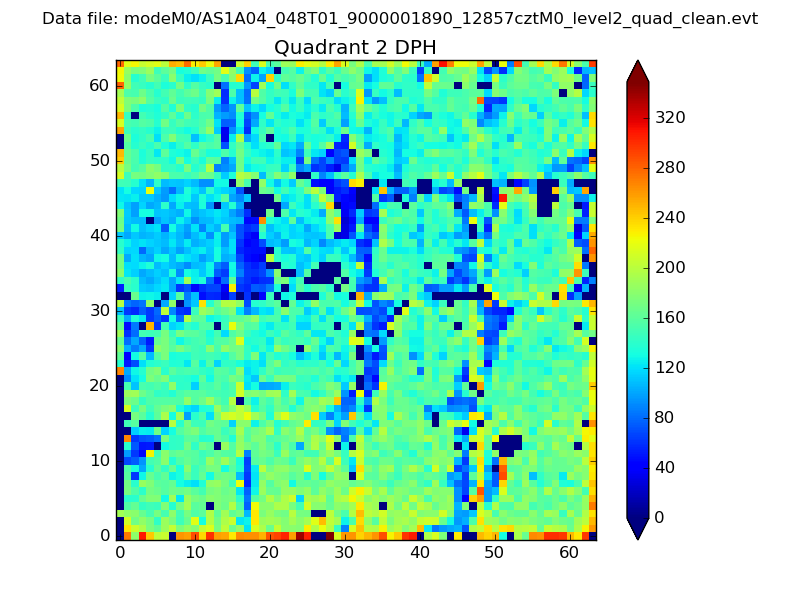
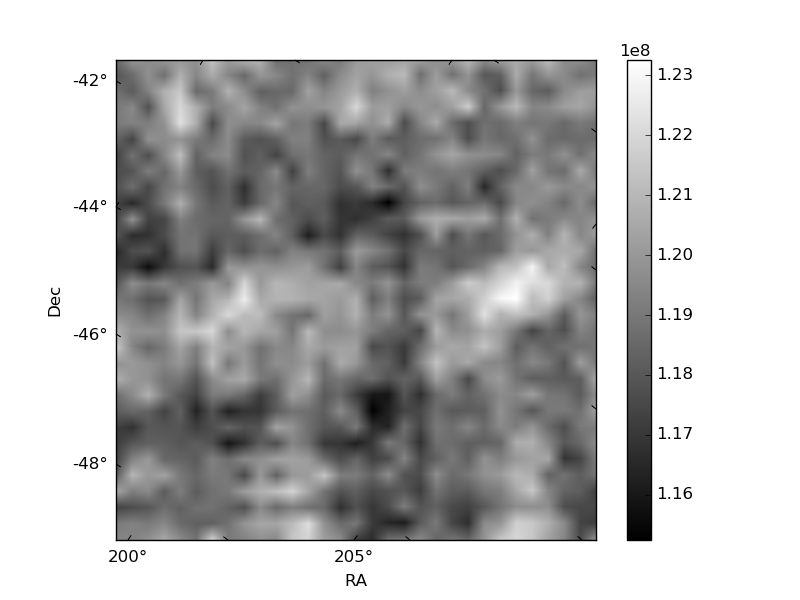
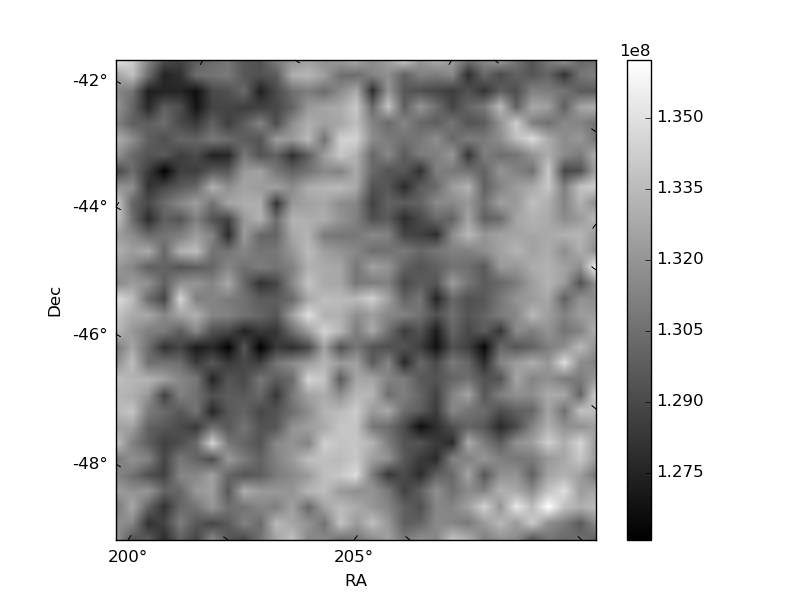
Histogram calculated using DETX and DETY for each event in the final _common_clean file
| Quadrant A | 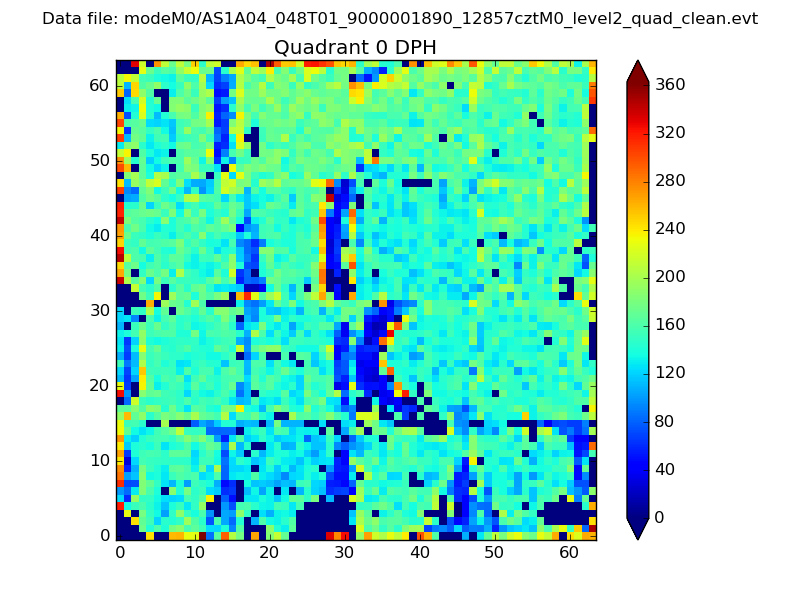 |
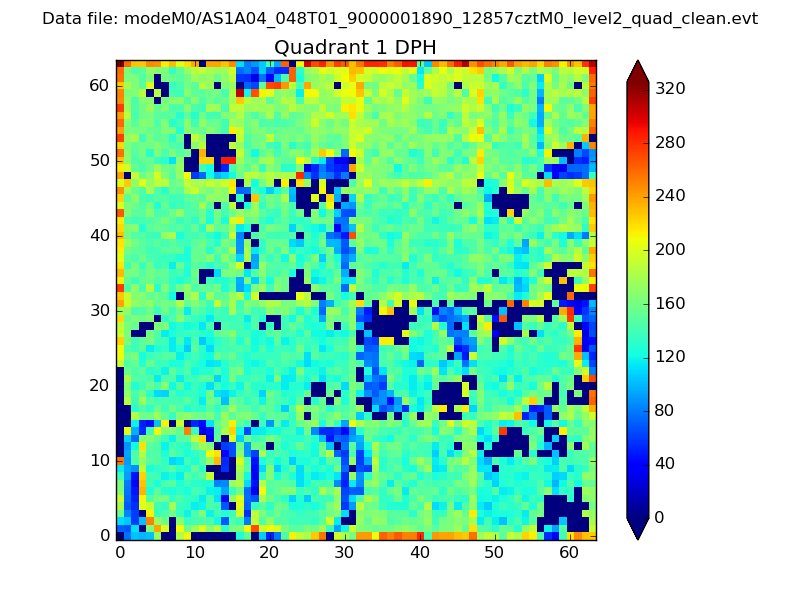 |
Quadrant B |
|---|---|---|---|
| Quadrant D | 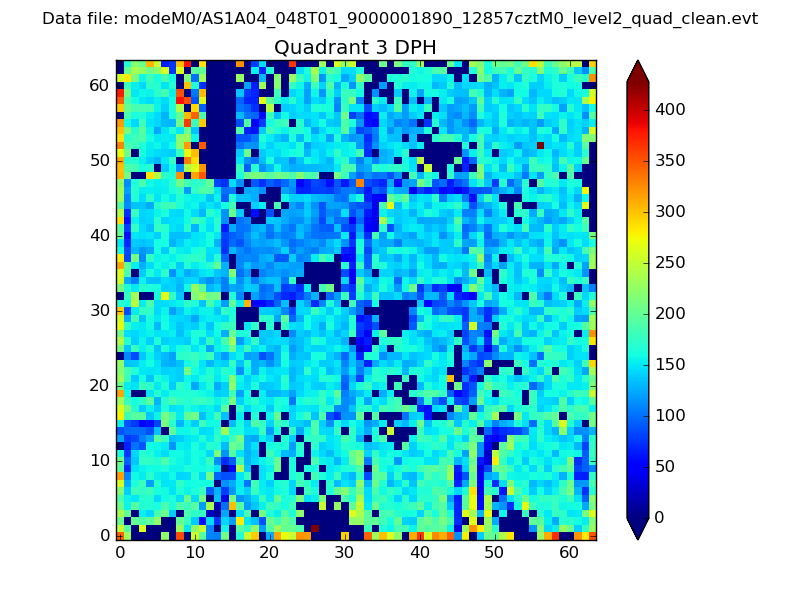 |
 |
Quadrant C |
| Plot type | Count rate plots | Images |
|---|---|---|
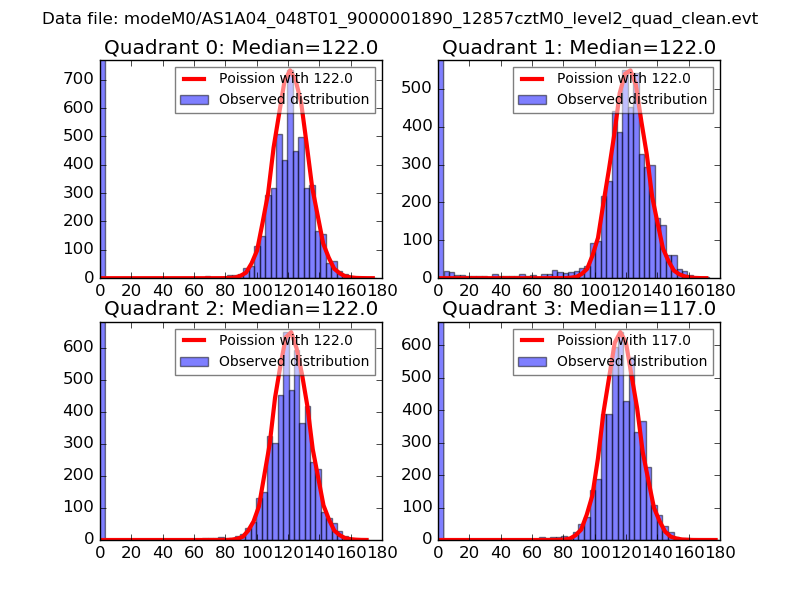
| Comparison with Poisson distribution Blue bars denote a histogram of data divided into 1 sec bins. Red curve is a Poisson curve with rate = median count rate of data. |
 |
 |
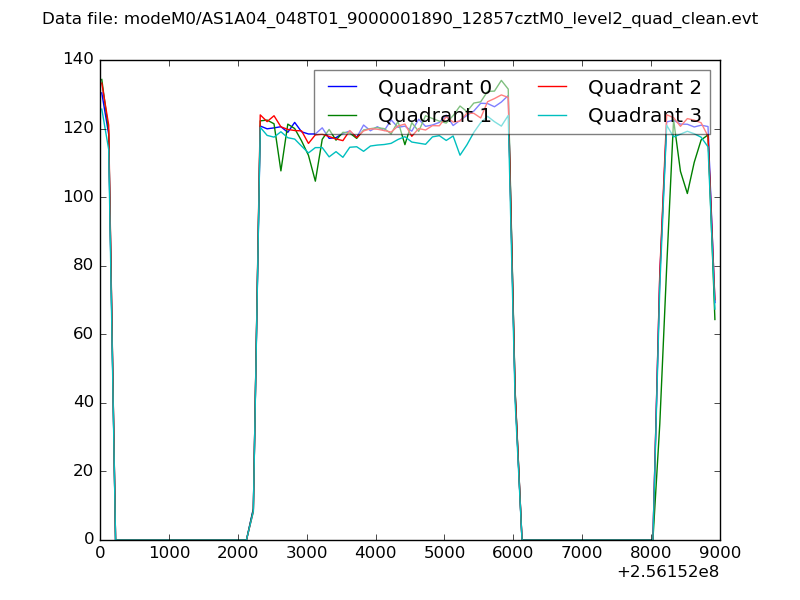
| Quadrant-wise count rates Data is divided into 100 sec bins |
 |
|
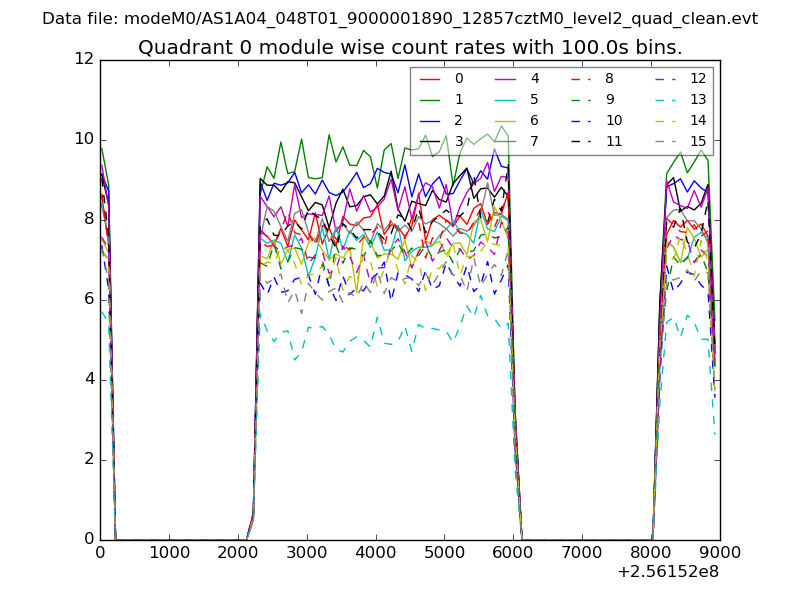
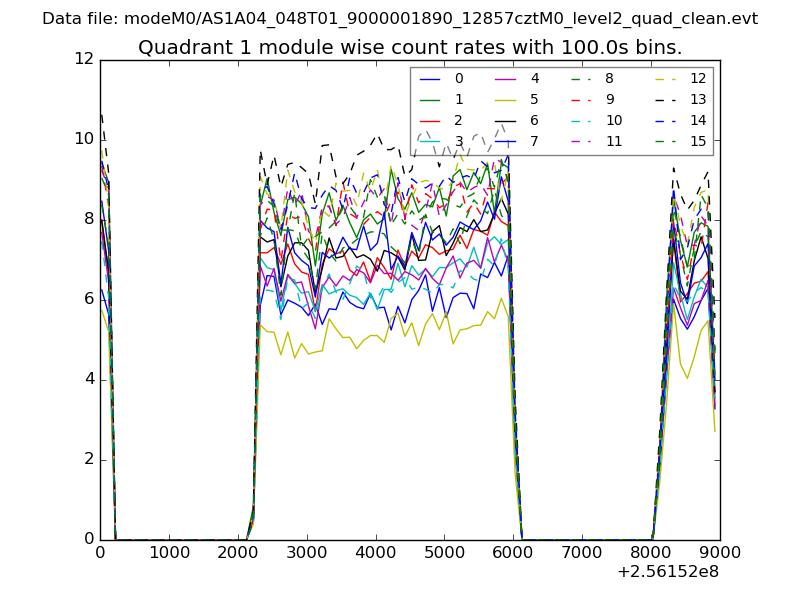
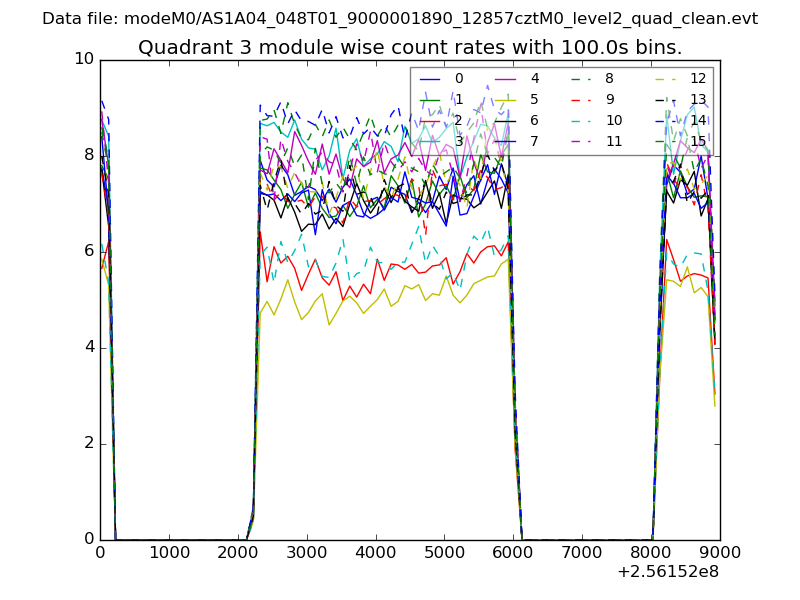
| Module-wise count rates for Quadrant A Data is divided into 100 sec bins |
 |
 |
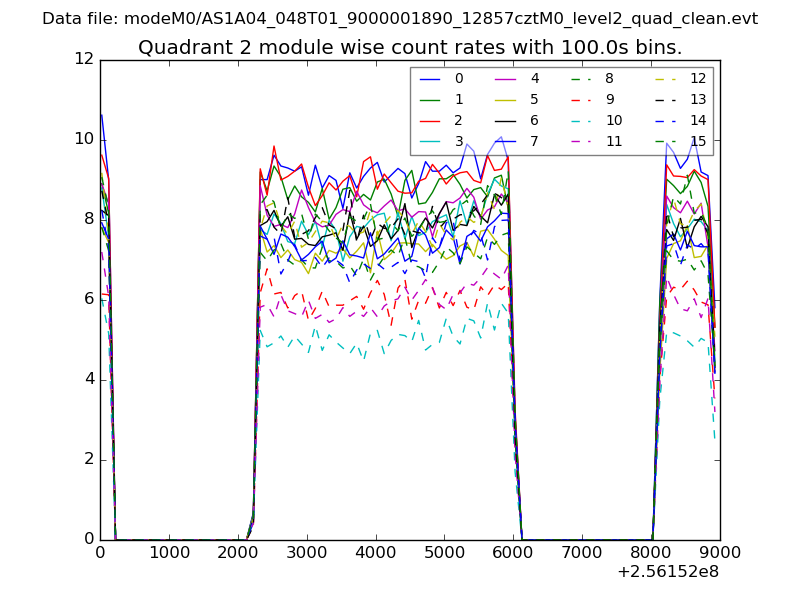
| Module-wise count rates for Quadrant B Data is divided into 100 sec bins |
 |
 |
| Module-wise count rates for Quadrant C Data is divided into 100 sec bins |
 |
 |
| Module-wise count rates for Quadrant D Data is divided into 100 sec bins |
 |
 |
| Parameter | Plot |
|---|---|
| CZT HV Monitor | 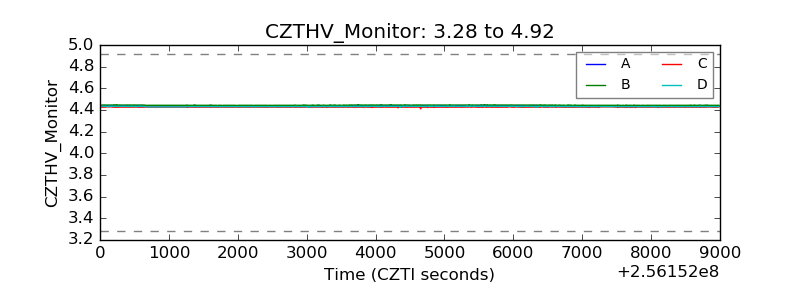 |
| D_VDD | 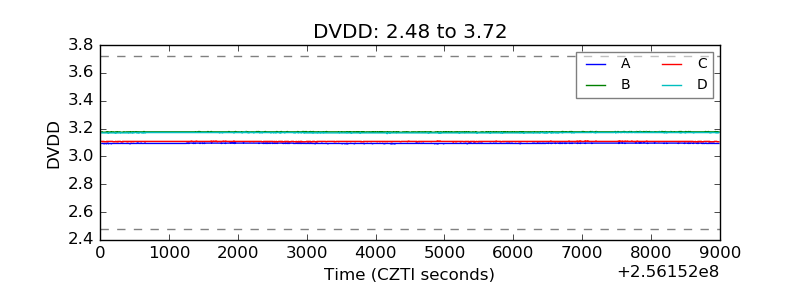 |
| Temperature 1 | 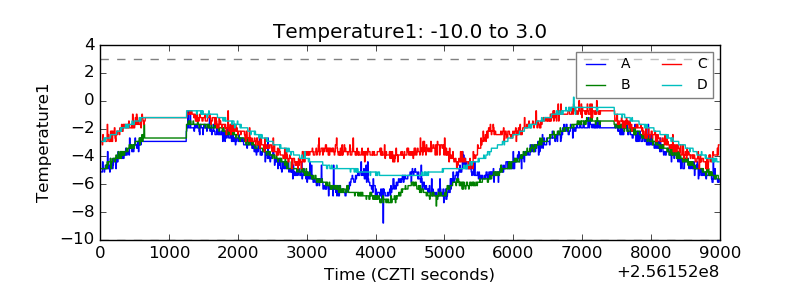 |
| Veto HV Monitor | 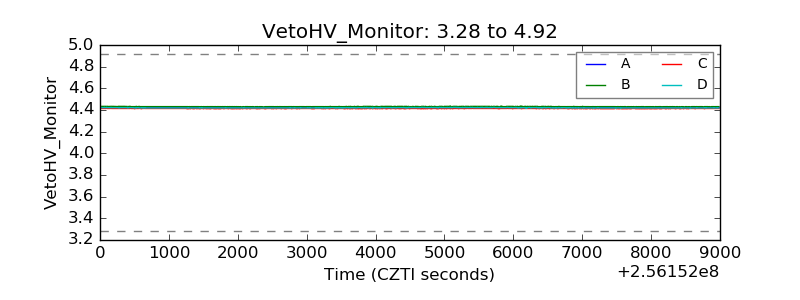 |
| Veto LLD | 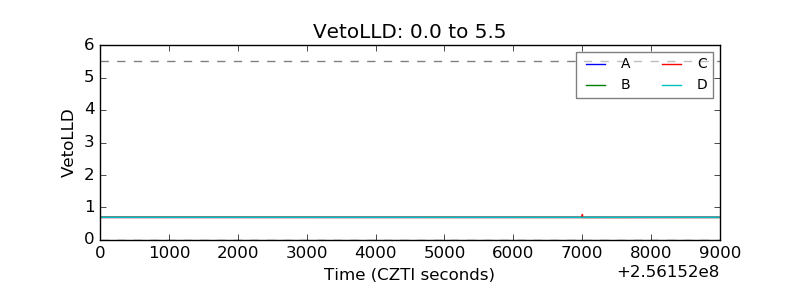 |
| Alpha Counter | 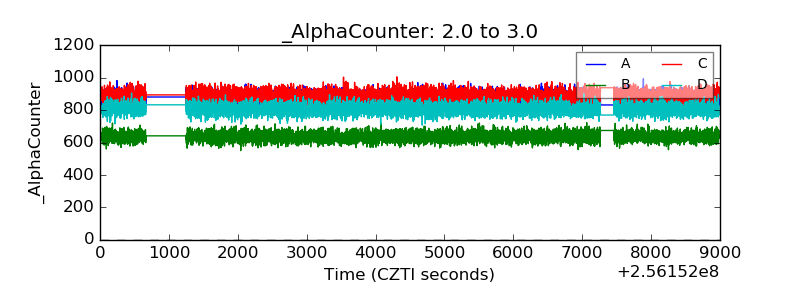 |
| _CPM_Rate | 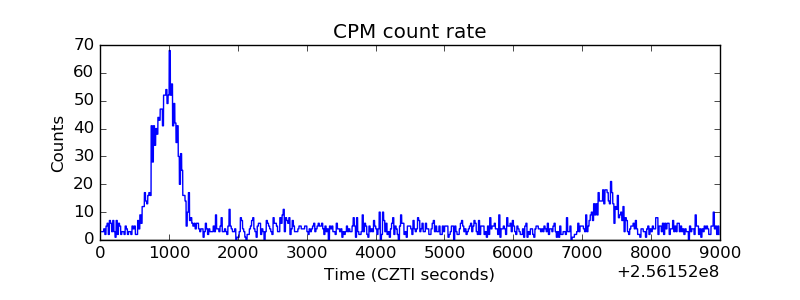 |
| CZT Counter | 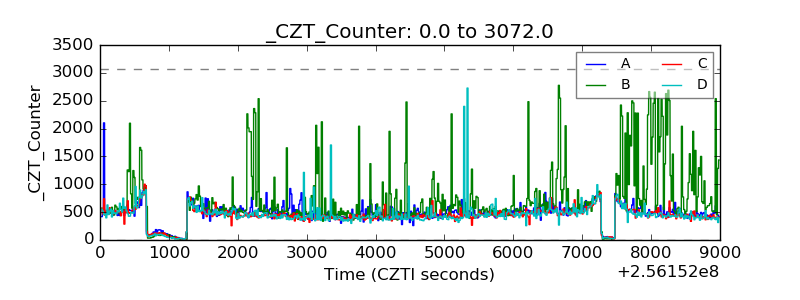 |
| +2.5 Volts monitor | 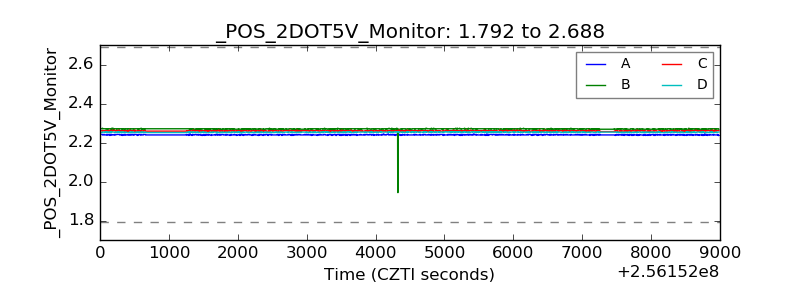 |
| +5 Volts monitor | 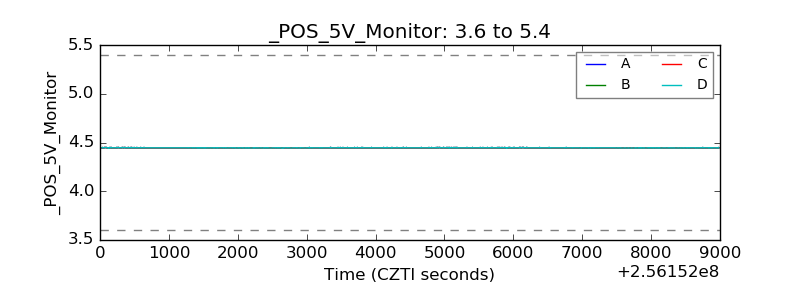 |
| _ROLL_ROT | 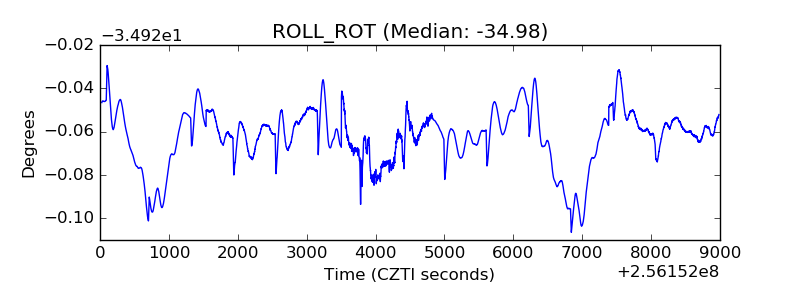 |
| _Roll_DEC | 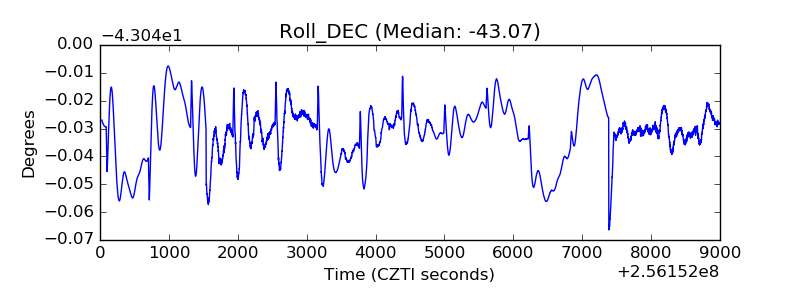 |
| _Roll_RA | 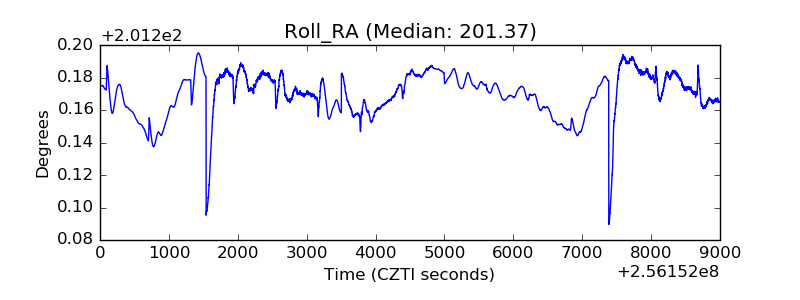 |
| Veto Counter | 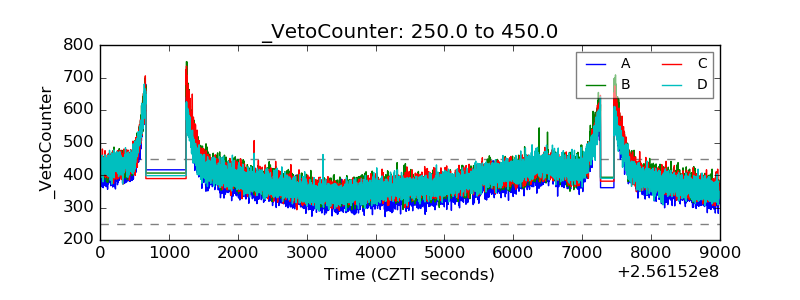 |