| Param | Original file | Final file |
|---|---|---|
| Filename | modeM0/AS1A04_048T01_9000001890_12858cztM0_level2.evt | modeM0/AS1A04_048T01_9000001890_12858cztM0_level2_quad_clean.evt |
| Size (bytes) | 672,511,680 | 96,600,960 |
| Size | 641.4 MB | 92.1 MB |
| Events in quadrant A | 4,261,913 | 598,027 |
| Events in quadrant B | 7,641,123 | 564,425 |
| Events in quadrant C | 3,944,093 | 597,136 |
| Events in quadrant D | 3,943,015 | 574,404 |
| Mode M9 | |||
|---|---|---|---|
| Quadrant | BADHDUFLAG | Total packets | Discarded packets |
| A | 0 | 5 | 0 |
| B | 0 | 5 | 0 |
| C | 0 | 5 | 0 |
| D | 0 | 5 | 0 |
| Mode SS | |||
|---|---|---|---|
| Quadrant | BADHDUFLAG | Total packets | Discarded packets |
| A | 0 | 174 | 0 |
| B | 0 | 174 | 0 |
| C | 0 | 174 | 0 |
| D | 0 | 174 | 0 |
| Mode M0 | |||
|---|---|---|---|
| Quadrant | BADHDUFLAG | Total packets | Discarded packets |
| A | 0 | 18310 | 3 |
| B | 0 | 28534 | 2 |
| C | 0 | 17546 | 2 |
| D | 0 | 17779 | 2 |
| Quadrant | Total seconds | Saturated seconds | Saturation percentage |
|---|---|---|---|
| A | 8512 | 133 | 1.562500% |
| B | 8512 | 1354 | 15.906955% |
| C | 8512 | 43 | 0.505169% |
| D | 8512 | 37 | 0.434680% |
Noise dominated data is calculated using 1-second bins in cleaned event files. If a bin has >2000 counts, and if more than 50% of those come from <1% of pixels, then it is considered to be noise-dominated and hence unusable.
| Quadrant | # 1 sec bins | Bins with >0 counts | Bins with >2000 counts | High rate bins dominated by noise | Noise dominated (total time) | Noise dominated (detector-on time) | Marked lightcurve |
|---|---|---|---|---|---|---|---|
| A | 8998 | 8515 | 6 | 6 | 0.07% | 0.07% | 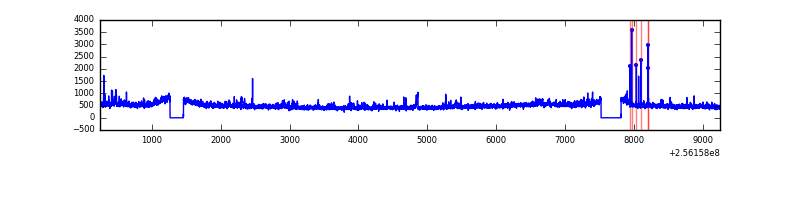 |
| B | 8998 | 8515 | 708 | 708 | 7.87% | 8.31% | 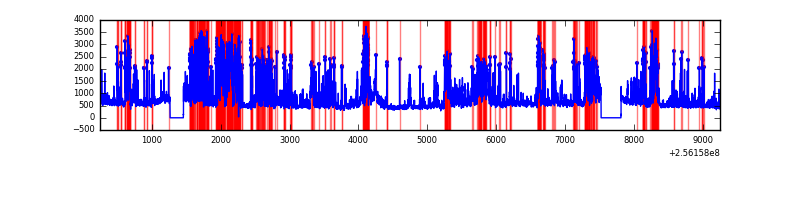 |
| C | 8998 | 8515 | 0 | 0 | 0.00% | 0.00% | 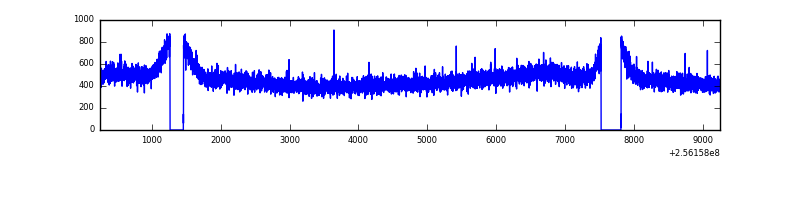 |
| D | 8998 | 8515 | 10 | 10 | 0.11% | 0.12% | 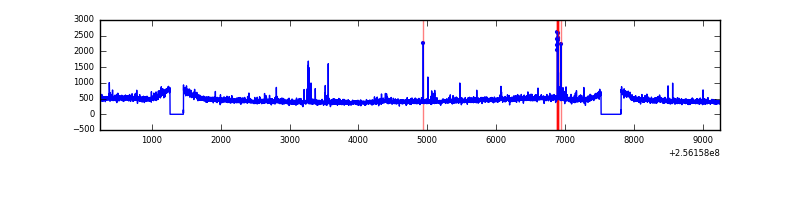 |
Top three noisy pixels from each quadrant. If the there are fewer than three noisy pixels in the level2.evt file, extra rows are filled as -1
| Pixel properties | Quadrant properties | ||||||
|---|---|---|---|---|---|---|---|
| Quadrant | DetID | PixID | Counts | Sigma | Mean | Median | Sigma |
| A | 12 | 189 | 200614 | 938.33 | 1041 | 1016 | 212.7 |
| A | 8 | 15 | 30576 | 138.97 | 1041 | 1016 | 212.7 |
| A | 15 | 222 | 19262 | 85.78 | 1041 | 1016 | 212.7 |
| B | 4 | 239 | 2832052 | 15414.96 | 962 | 937 | 183.7 |
| B | 0 | 85 | 630270 | 3426.62 | 962 | 937 | 183.7 |
| B | 3 | 64 | 123228 | 665.85 | 962 | 937 | 183.7 |
| C | 13 | 61 | 7473 | 27.57 | 1011 | 1017 | 234.2 |
| C | 14 | 234 | 2447 | 6.11 | 1011 | 1017 | 234.2 |
| C | 3 | 202 | 2419 | 5.99 | 1011 | 1017 | 234.2 |
| D | 4 | 95 | 56743 | 230.02 | 1008 | 978 | 242.4 |
| D | 1 | 52 | 52533 | 212.66 | 1008 | 978 | 242.4 |
| D | 2 | 234 | 32772 | 131.15 | 1008 | 978 | 242.4 |
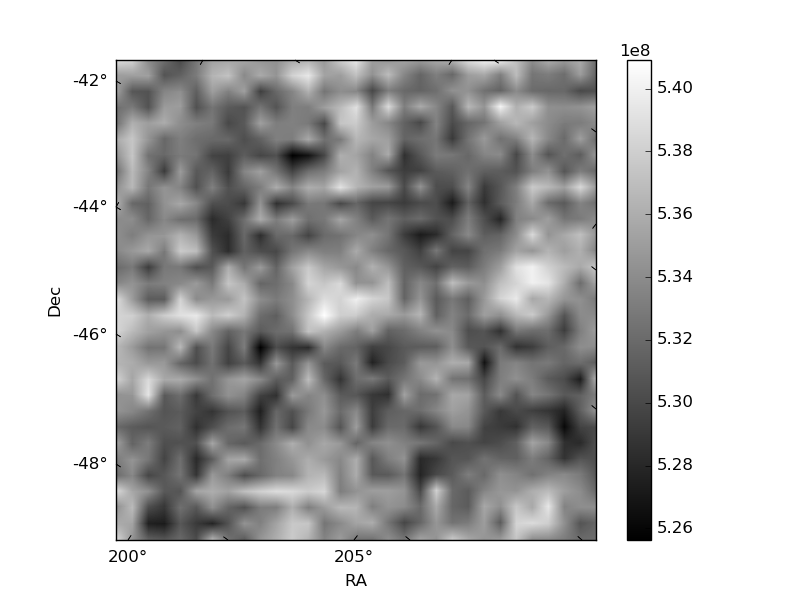
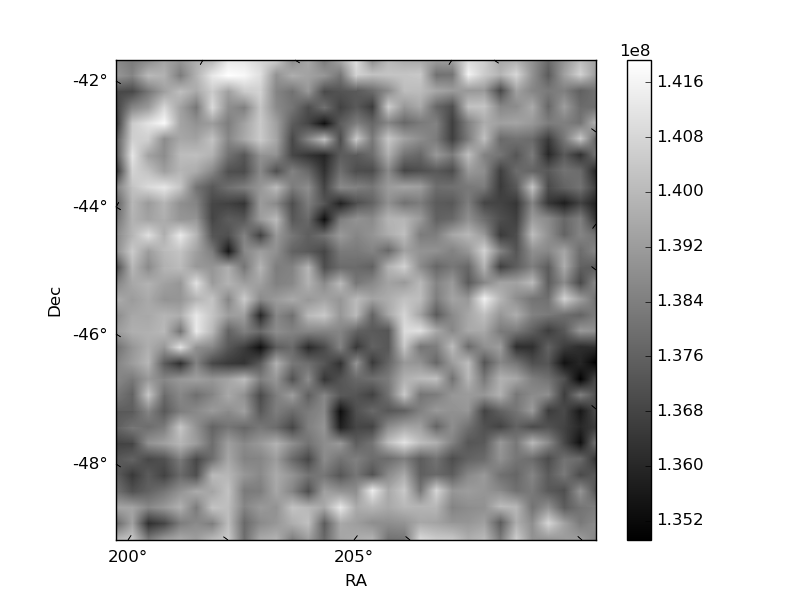
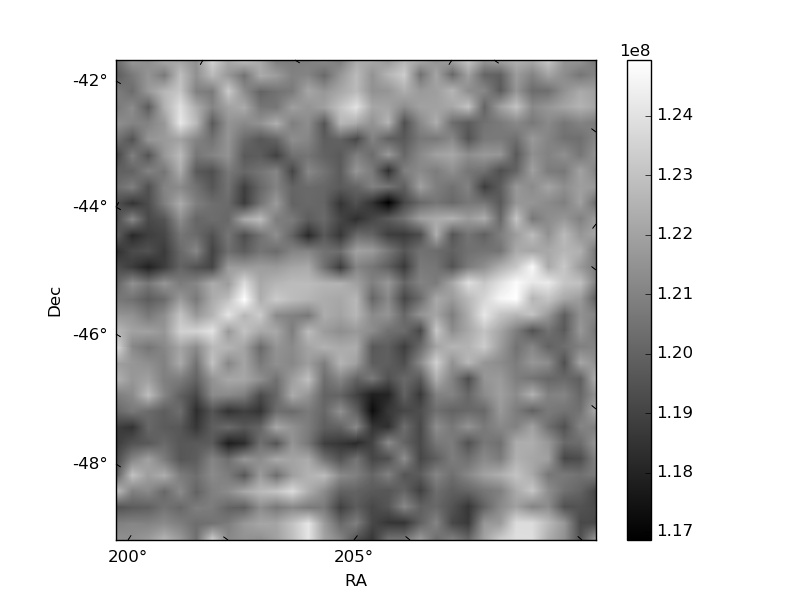
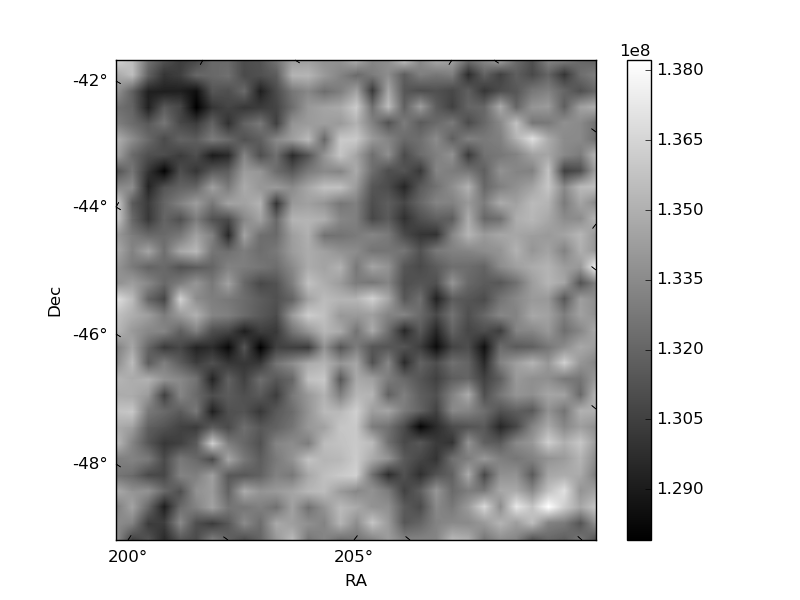
Histogram calculated using DETX and DETY for each event in the final _common_clean file
| Quadrant A | 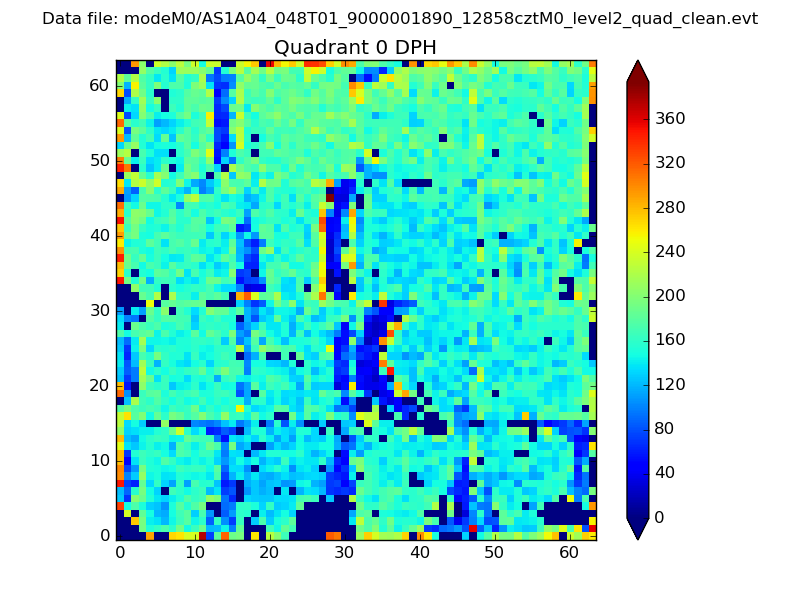 |
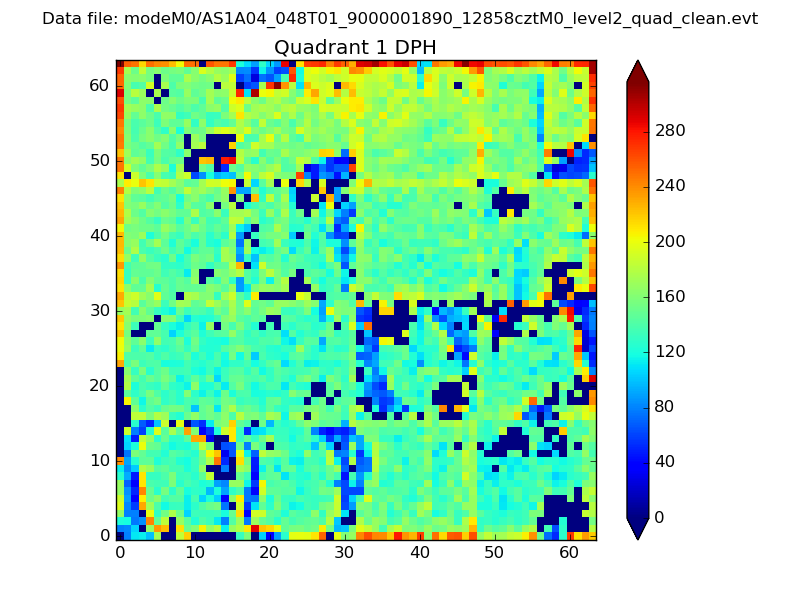 |
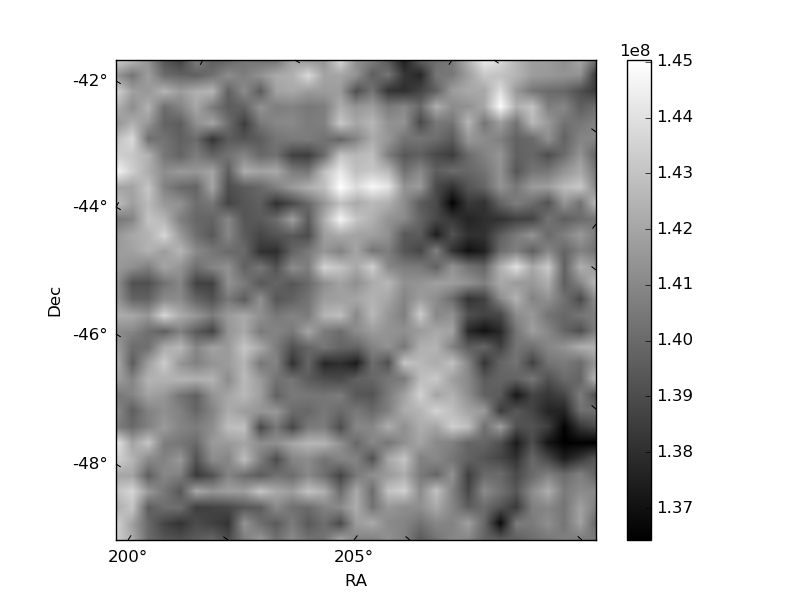
Quadrant B |
|---|---|---|---|
| Quadrant D | 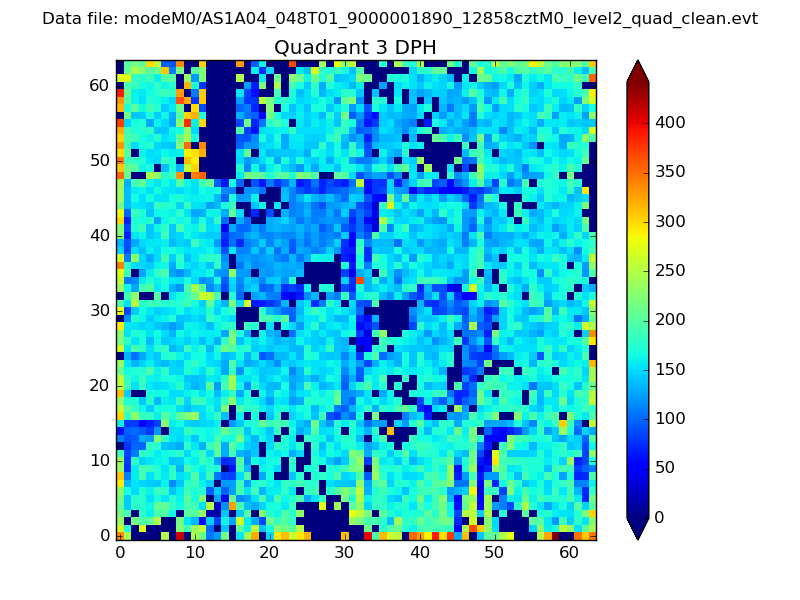 |
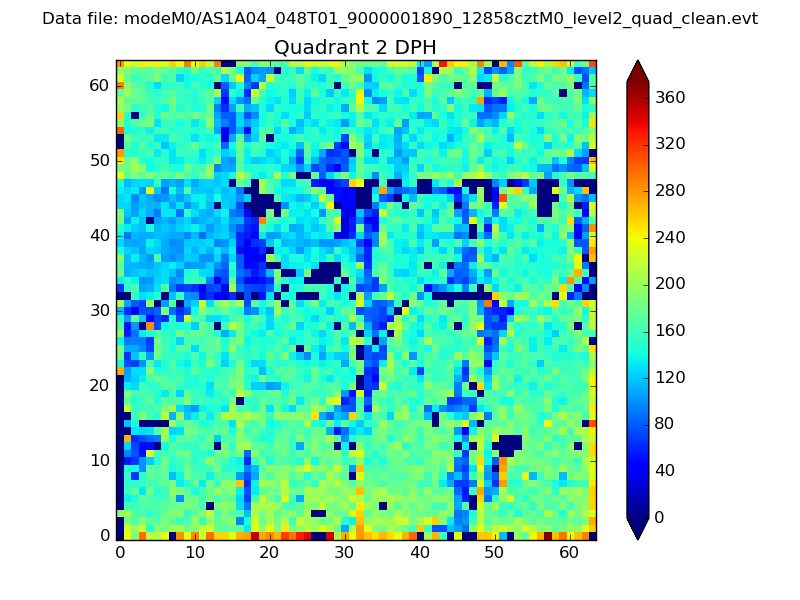 |
Quadrant C |
| Plot type | Count rate plots | Images |
|---|---|---|
| Comparison with Poisson distribution Blue bars denote a histogram of data divided into 1 sec bins. Red curve is a Poisson curve with rate = median count rate of data. |
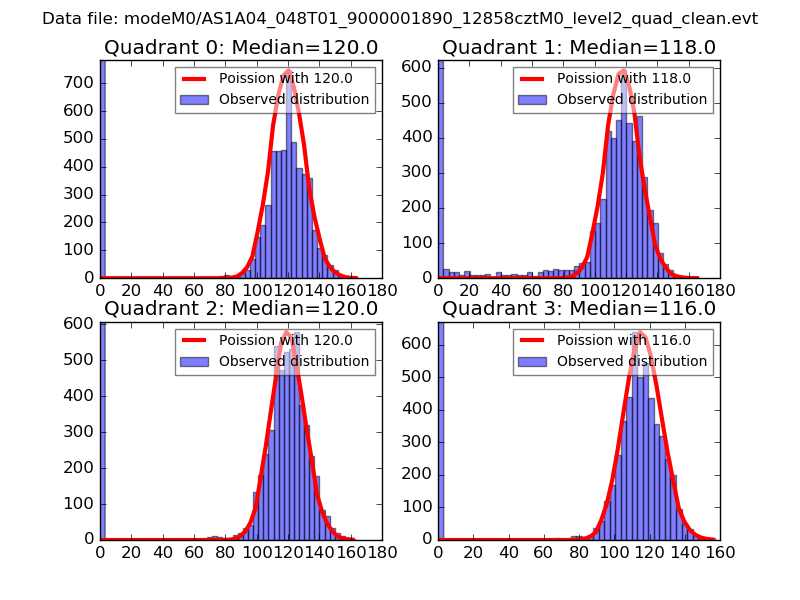 |
 |
| Quadrant-wise count rates Data is divided into 100 sec bins |
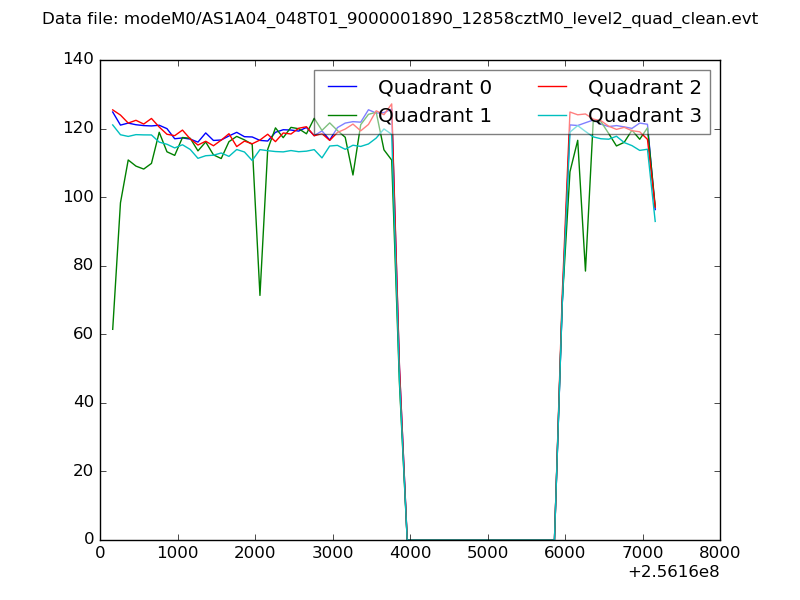 |
|
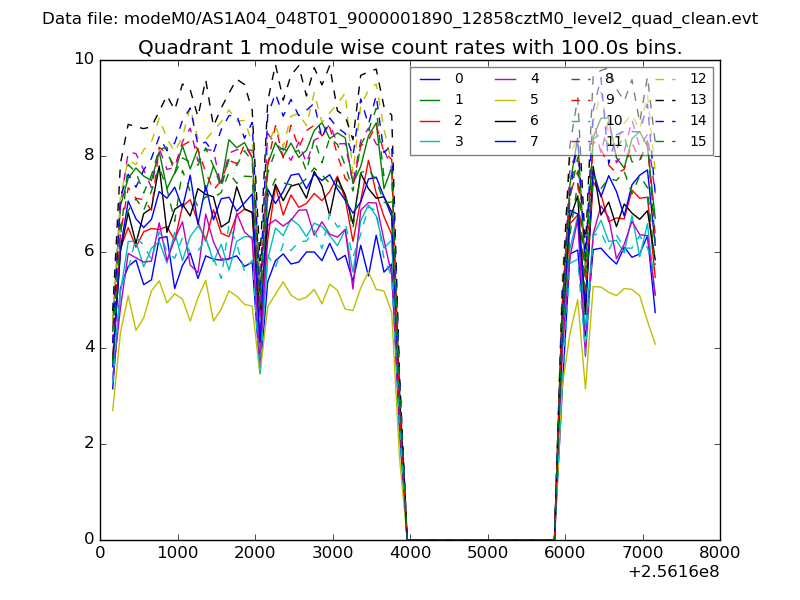
| Module-wise count rates for Quadrant A Data is divided into 100 sec bins |
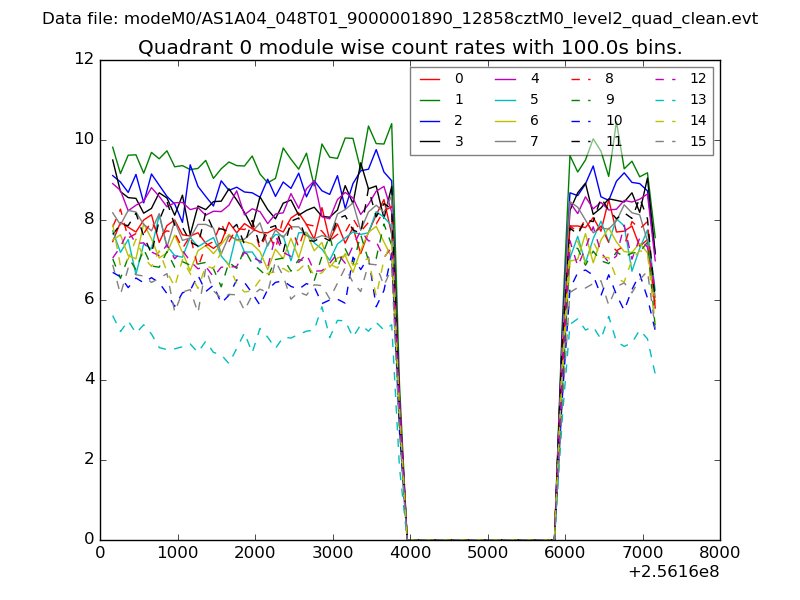 |
 |
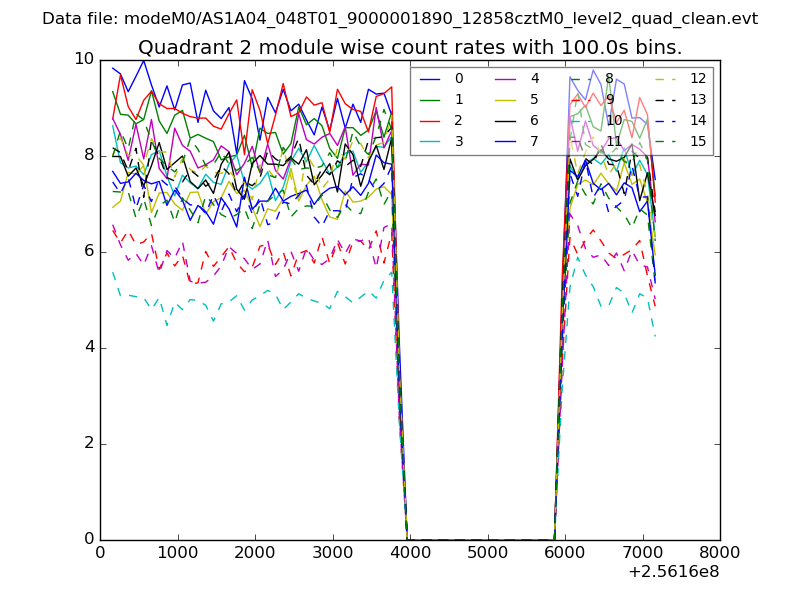
| Module-wise count rates for Quadrant B Data is divided into 100 sec bins |
 |
 |
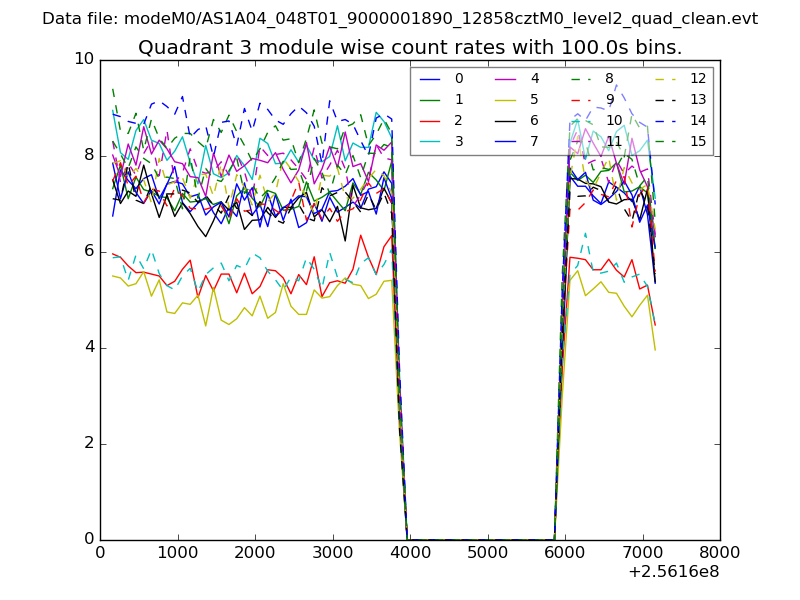
| Module-wise count rates for Quadrant C Data is divided into 100 sec bins |
 |
 |
| Module-wise count rates for Quadrant D Data is divided into 100 sec bins |
 |
 |
| Parameter | Plot |
|---|---|
| CZT HV Monitor | 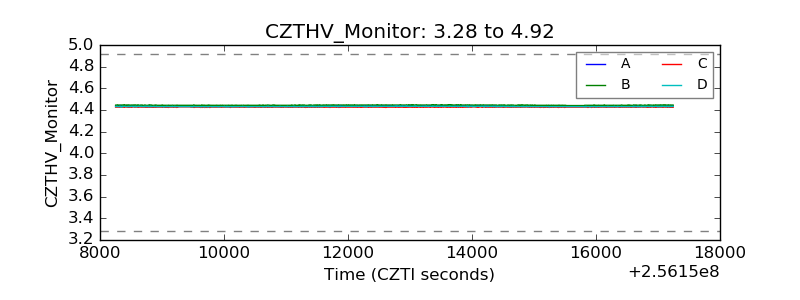 |
| D_VDD | 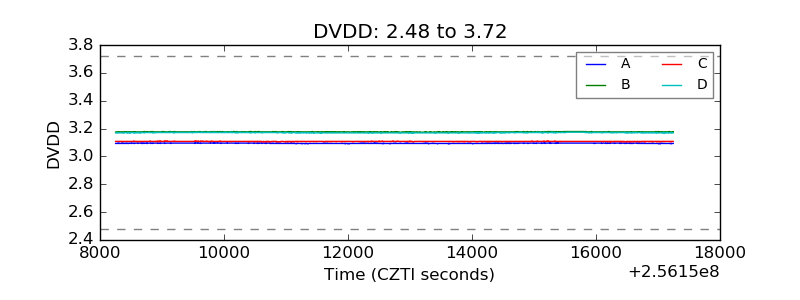 |
| Temperature 1 | 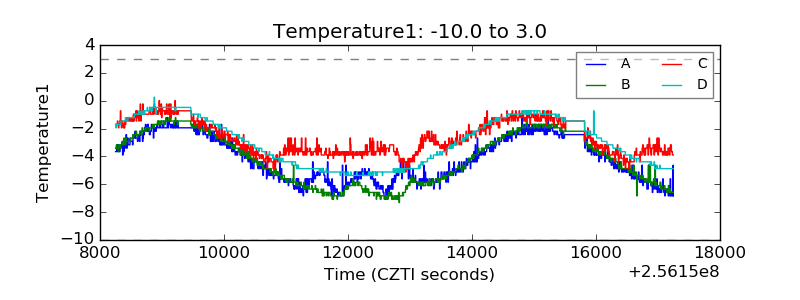 |
| Veto HV Monitor | 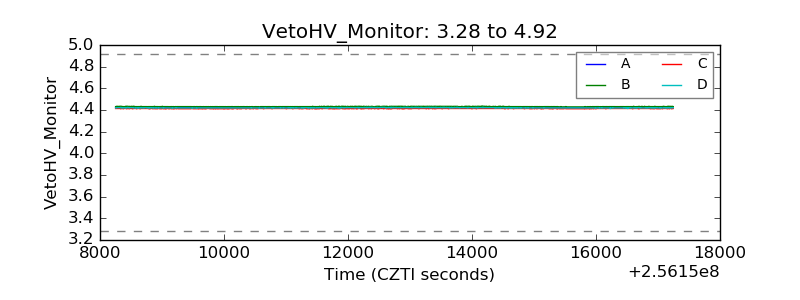 |
| Veto LLD | 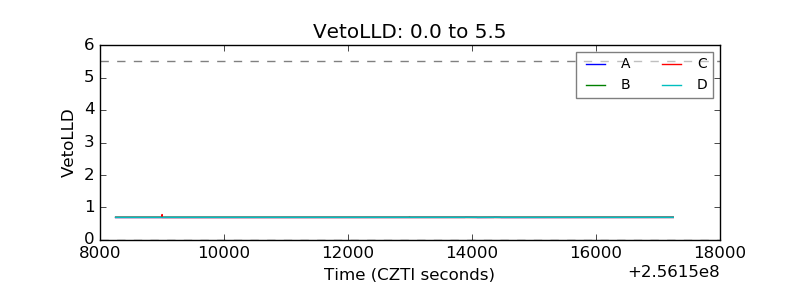 |
| Alpha Counter | 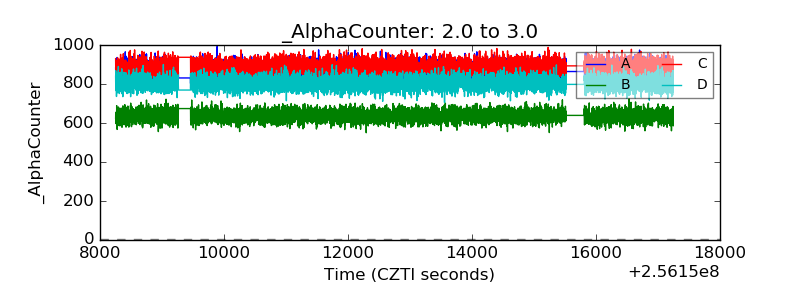 |
| _CPM_Rate | 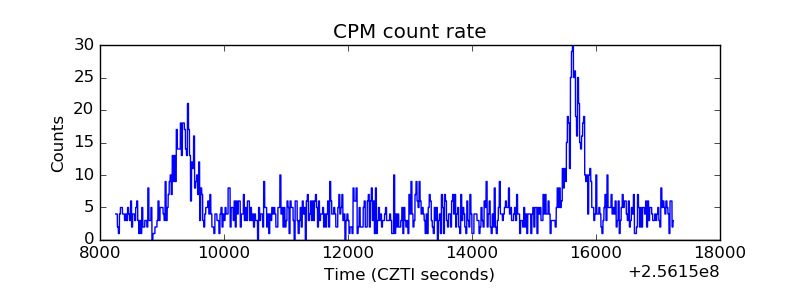 |
| CZT Counter | 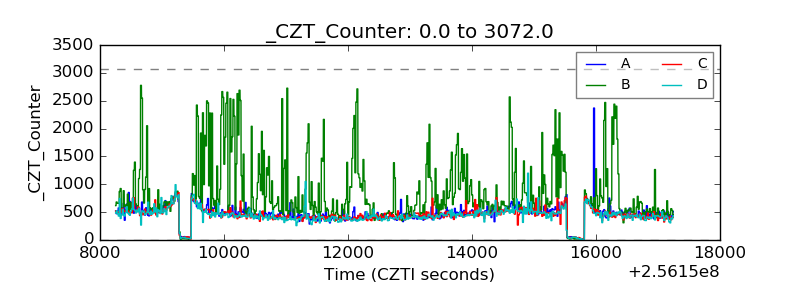 |
| +2.5 Volts monitor |  |
| +5 Volts monitor |  |
| _ROLL_ROT | 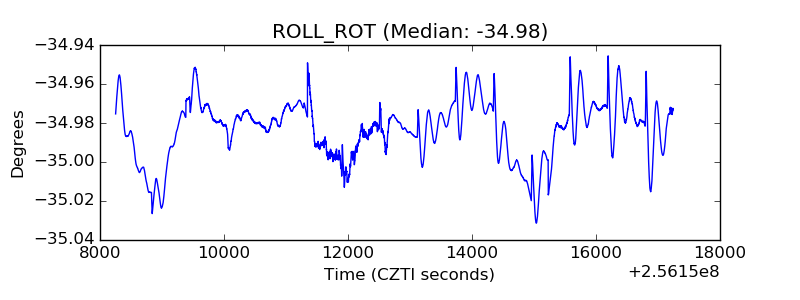 |
| _Roll_DEC | 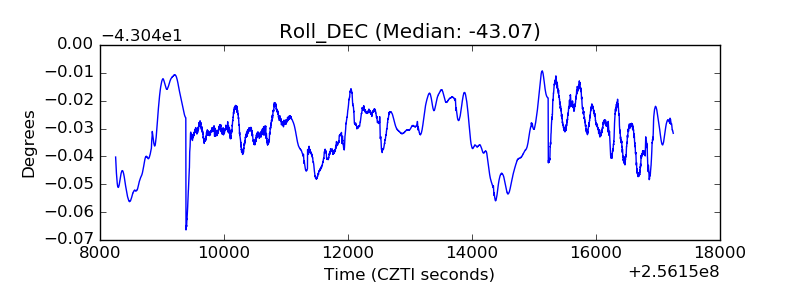 |
| _Roll_RA | 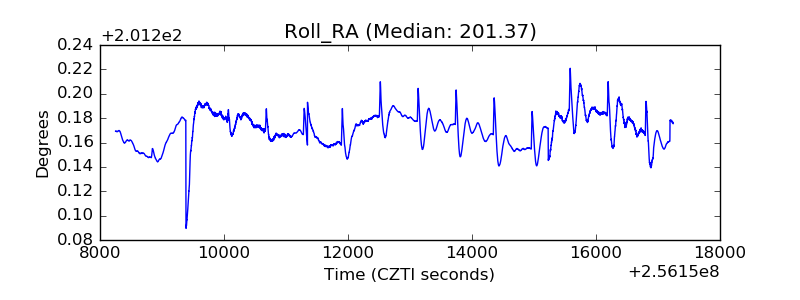 |
| Veto Counter | 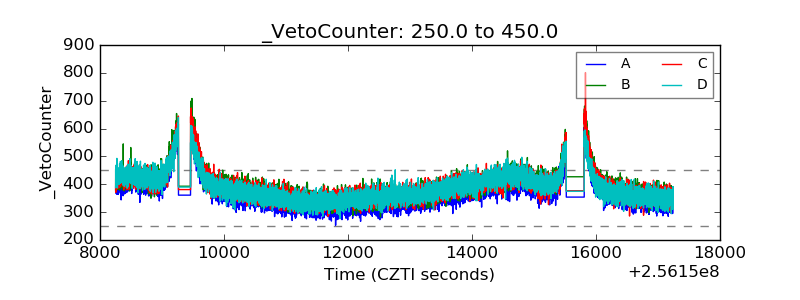 |