| Param | Original file | Final file |
|---|---|---|
| Filename | modeM0/AS1A04_048T01_9000001890_12861cztM0_level2.evt | modeM0/AS1A04_048T01_9000001890_12861cztM0_level2_quad_clean.evt |
| Size (bytes) | 1,056,654,720 | 164,920,320 |
| Size | 1007.7 MB | 157.3 MB |
| Events in quadrant A | 6,917,137 | 1,021,508 |
| Events in quadrant B | 10,944,281 | 987,153 |
| Events in quadrant C | 6,358,215 | 1,032,401 |
| Events in quadrant D | 6,832,646 | 984,854 |
| Mode M9 | |||
|---|---|---|---|
| Quadrant | BADHDUFLAG | Total packets | Discarded packets |
| A | 0 | 14 | 0 |
| B | 0 | 14 | 0 |
| C | 0 | 14 | 0 |
| D | 0 | 14 | 0 |
| Mode SS | |||
|---|---|---|---|
| Quadrant | BADHDUFLAG | Total packets | Discarded packets |
| A | 0 | 286 | 0 |
| B | 0 | 286 | 0 |
| C | 0 | 286 | 0 |
| D | 0 | 286 | 0 |
| Mode M0 | |||
|---|---|---|---|
| Quadrant | BADHDUFLAG | Total packets | Discarded packets |
| A | 0 | 29967 | 4 |
| B | 0 | 42002 | 3 |
| C | 0 | 28522 | 3 |
| D | 0 | 30273 | 3 |
| Quadrant | Total seconds | Saturated seconds | Saturation percentage |
|---|---|---|---|
| A | 14027 | 190 | 1.354531% |
| B | 14027 | 1645 | 11.727383% |
| C | 14027 | 35 | 0.249519% |
| D | 14027 | 108 | 0.769944% |
Noise dominated data is calculated using 1-second bins in cleaned event files. If a bin has >2000 counts, and if more than 50% of those come from <1% of pixels, then it is considered to be noise-dominated and hence unusable.
| Quadrant | # 1 sec bins | Bins with >0 counts | Bins with >2000 counts | High rate bins dominated by noise | Noise dominated (total time) | Noise dominated (detector-on time) | Marked lightcurve |
|---|---|---|---|---|---|---|---|
| A | 15428 | 14031 | 81 | 81 | 0.53% | 0.58% | 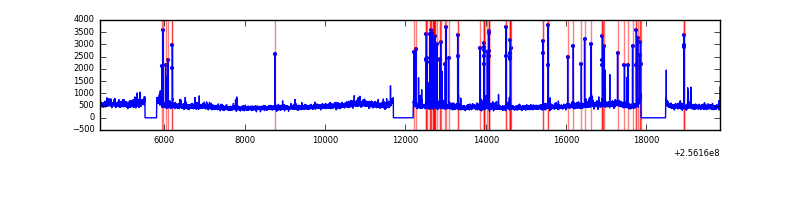 |
| B | 15428 | 14031 | 1020 | 1020 | 6.61% | 7.27% | 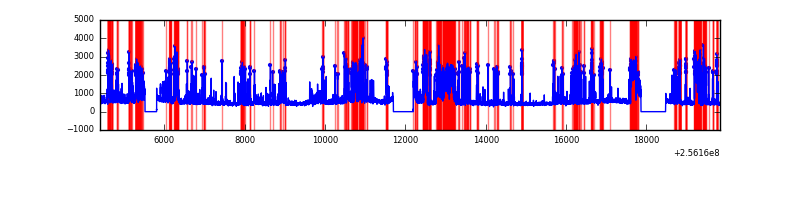 |
| C | 15428 | 14031 | 0 | 0 | 0.00% | 0.00% | 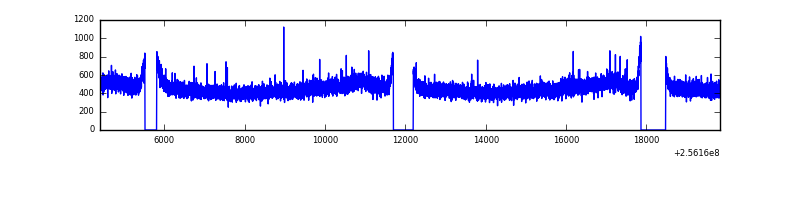 |
| D | 15428 | 14031 | 43 | 43 | 0.28% | 0.31% | 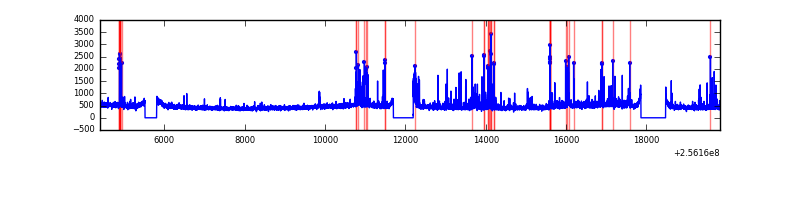 |
Top three noisy pixels from each quadrant. If the there are fewer than three noisy pixels in the level2.evt file, extra rows are filled as -1
| Pixel properties | Quadrant properties | ||||||
|---|---|---|---|---|---|---|---|
| Quadrant | DetID | PixID | Counts | Sigma | Mean | Median | Sigma |
| A | 15 | 222 | 283768 | 840.89 | 1656 | 1617 | 335.5 |
| A | 12 | 189 | 235859 | 698.11 | 1656 | 1617 | 335.5 |
| A | 9 | 143 | 15841 | 42.39 | 1656 | 1617 | 335.5 |
| B | 4 | 239 | 2471914 | 8158.42 | 1592 | 1552 | 302.8 |
| B | 0 | 85 | 1315828 | 4340.42 | 1592 | 1552 | 302.8 |
| B | 0 | 228 | 373628 | 1228.79 | 1592 | 1552 | 302.8 |
| C | 13 | 61 | 11929 | 27.31 | 1630 | 1635 | 376.9 |
| C | 3 | 202 | 4026 | 6.34 | 1630 | 1635 | 376.9 |
| C | 14 | 234 | 3993 | 6.26 | 1630 | 1635 | 376.9 |
| D | 4 | 95 | 471322 | 1198.73 | 1617 | 1568 | 391.9 |
| D | 1 | 52 | 151405 | 382.36 | 1617 | 1568 | 391.9 |
| D | 8 | 195 | 66087 | 164.64 | 1617 | 1568 | 391.9 |
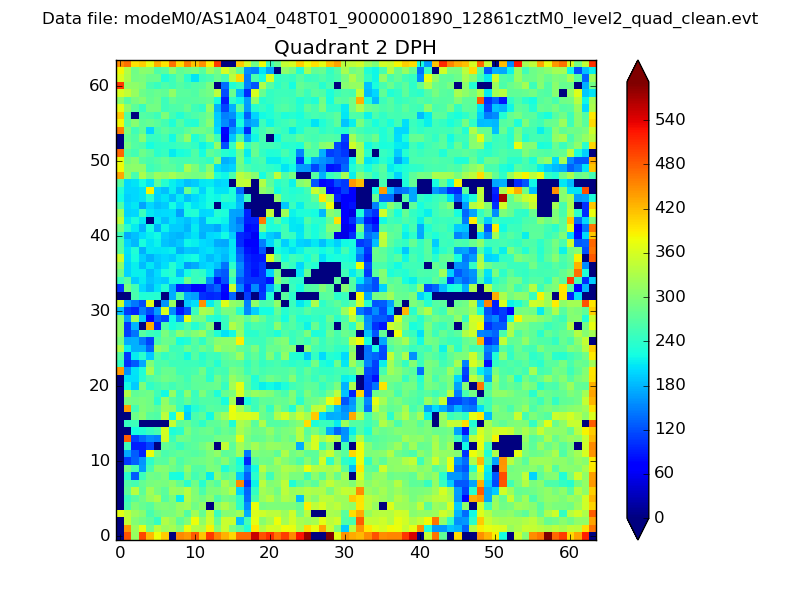
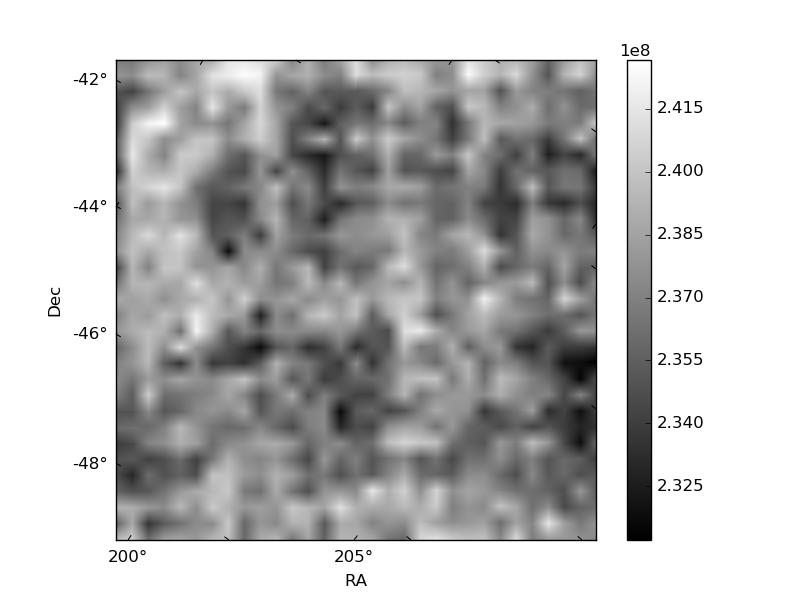
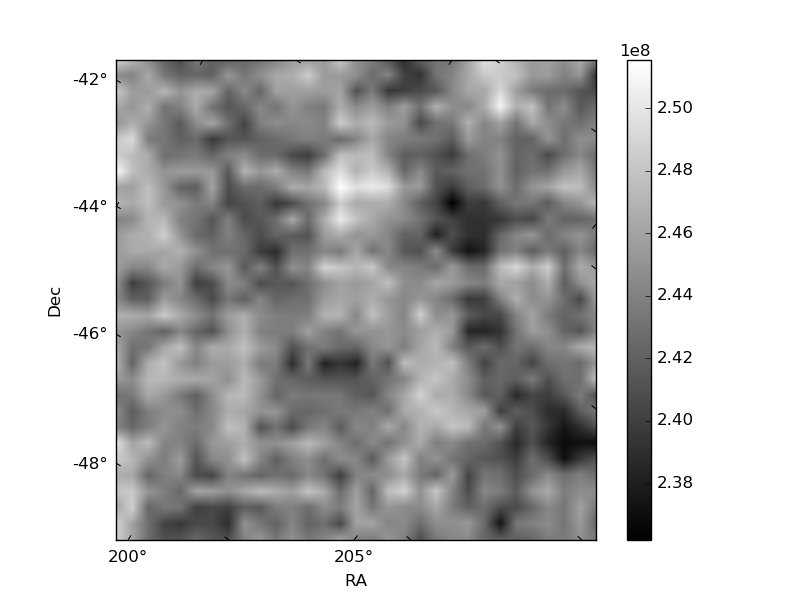
Histogram calculated using DETX and DETY for each event in the final _common_clean file
| Quadrant A | 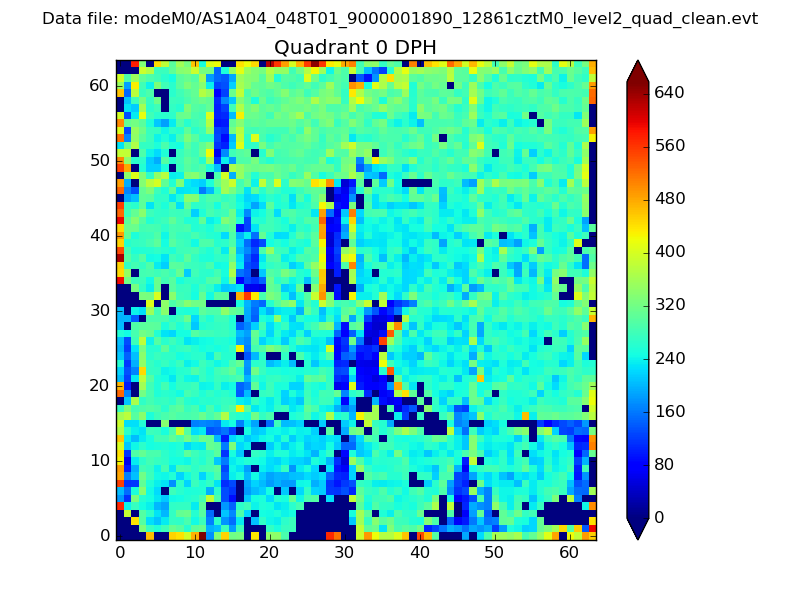 |
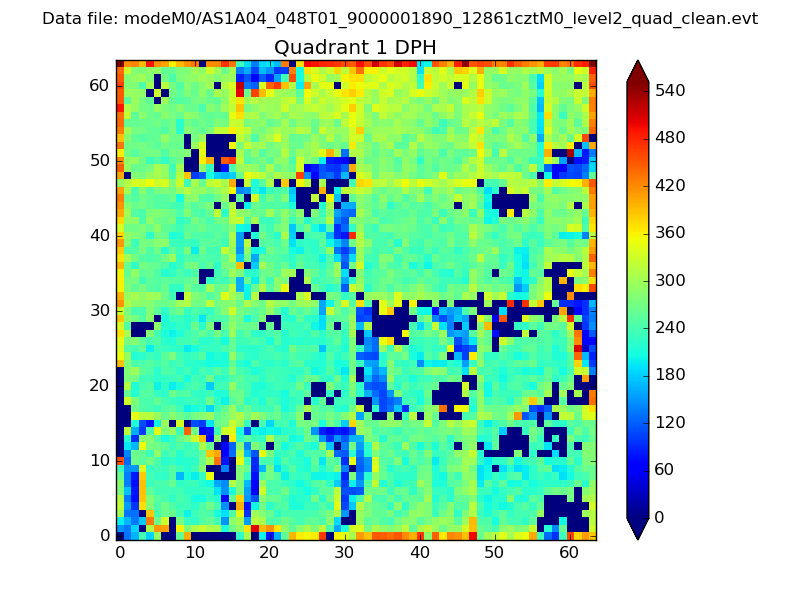 |
Quadrant B |
|---|---|---|---|
| Quadrant D | 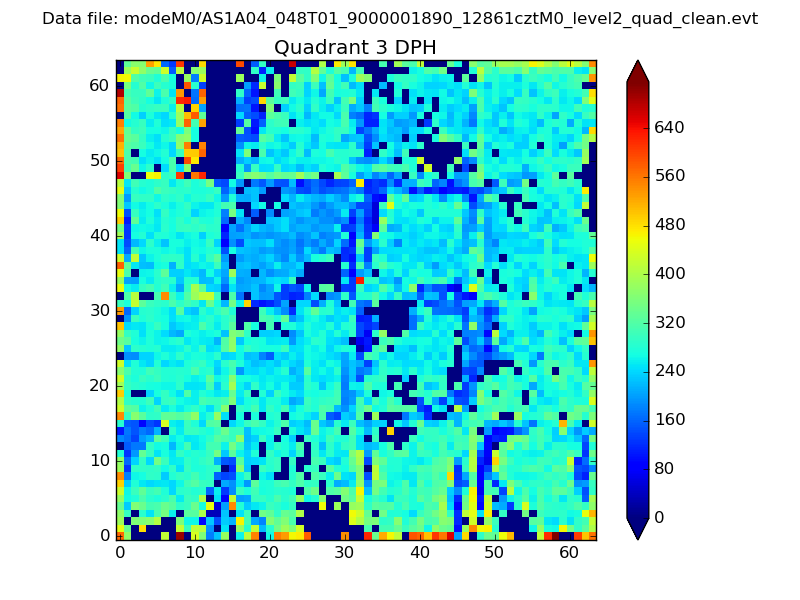 |
 |
Quadrant C |
| Plot type | Count rate plots | Images |
|---|---|---|
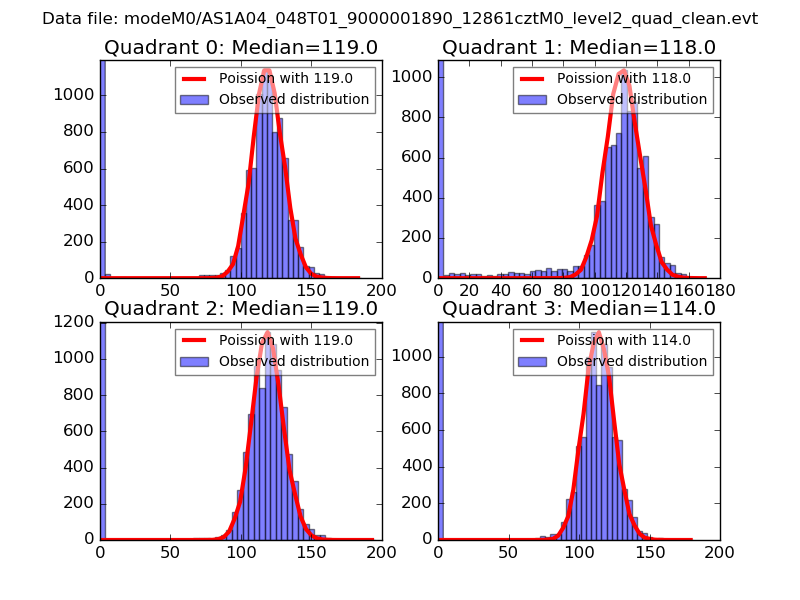
| Comparison with Poisson distribution Blue bars denote a histogram of data divided into 1 sec bins. Red curve is a Poisson curve with rate = median count rate of data. |
 |
 |
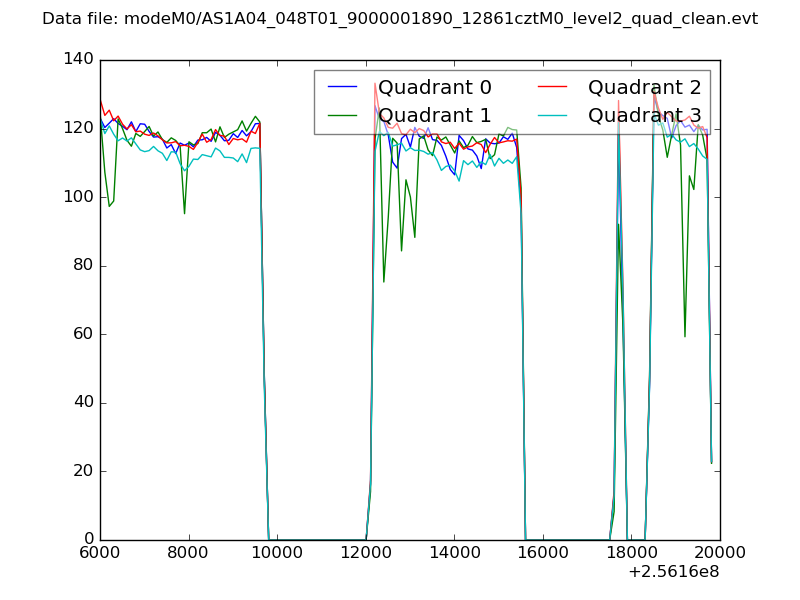
| Quadrant-wise count rates Data is divided into 100 sec bins |
 |
|
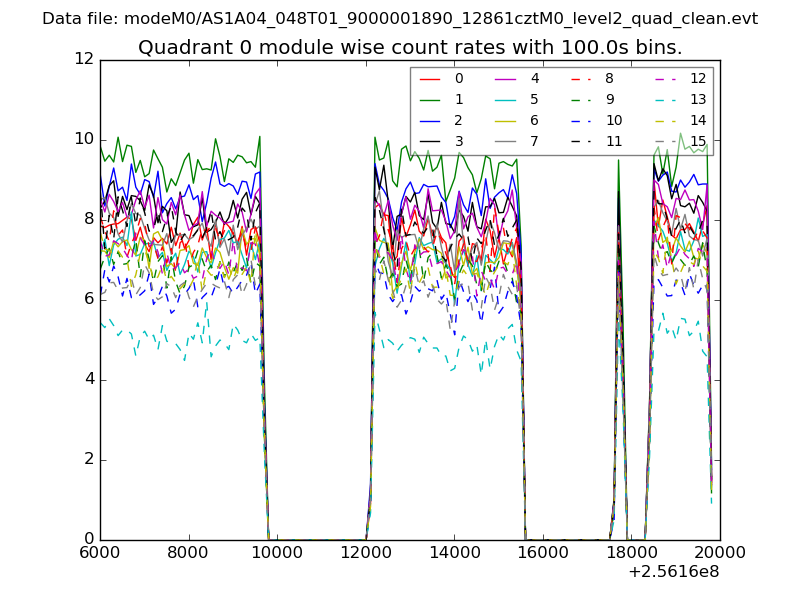
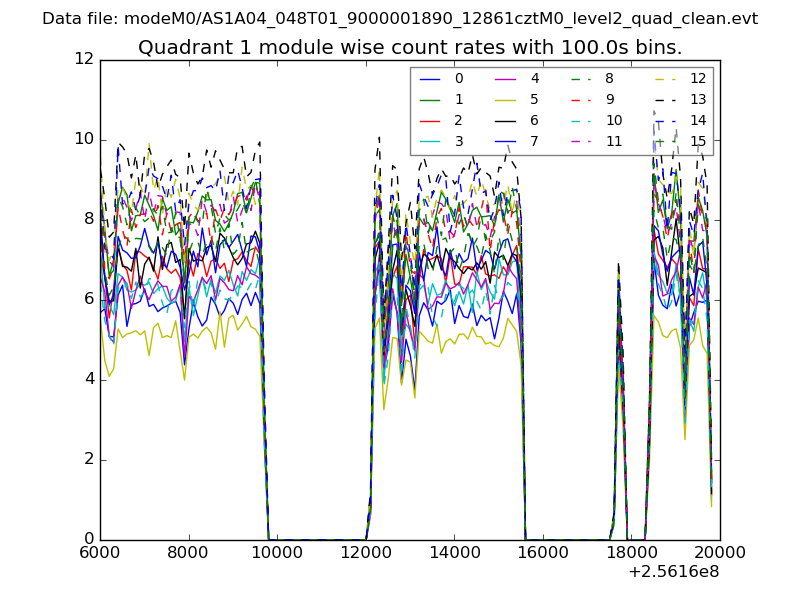
| Module-wise count rates for Quadrant A Data is divided into 100 sec bins |
 |
 |
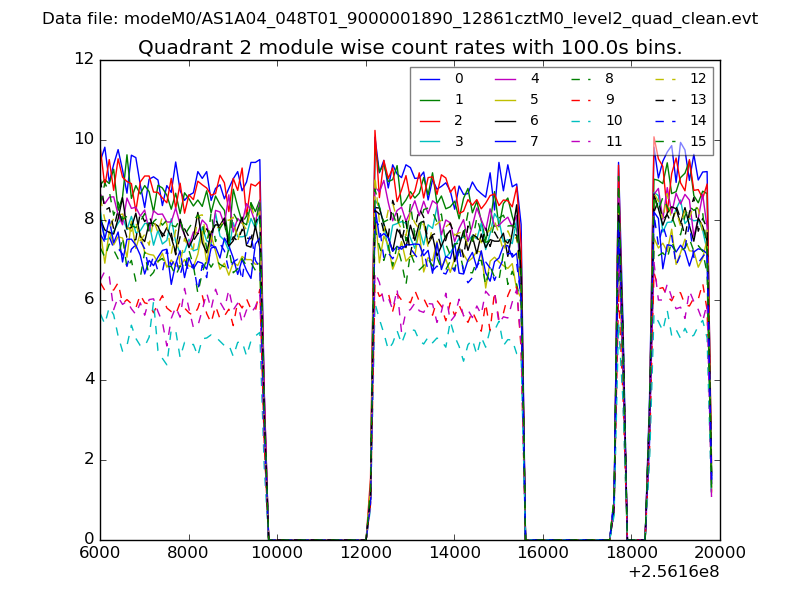
| Module-wise count rates for Quadrant B Data is divided into 100 sec bins |
 |
 |
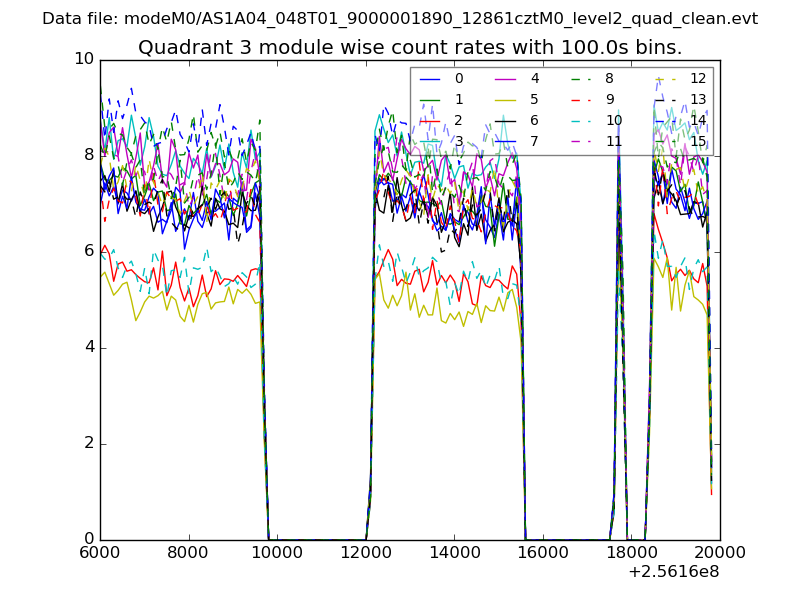
| Module-wise count rates for Quadrant C Data is divided into 100 sec bins |
 |
 |
| Module-wise count rates for Quadrant D Data is divided into 100 sec bins |
 |
 |
| Parameter | Plot |
|---|---|
| CZT HV Monitor | 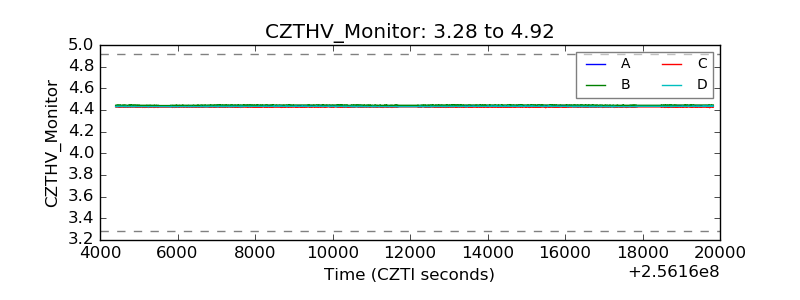 |
| D_VDD | 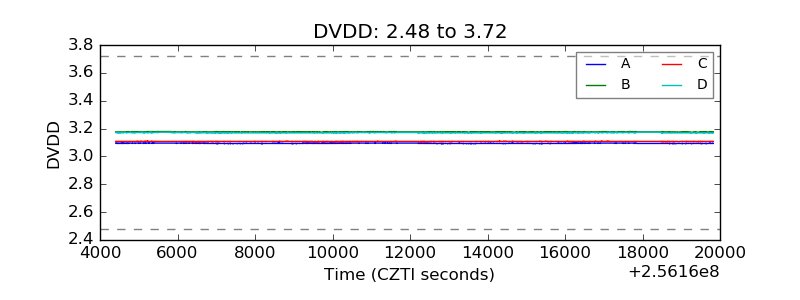 |
| Temperature 1 | 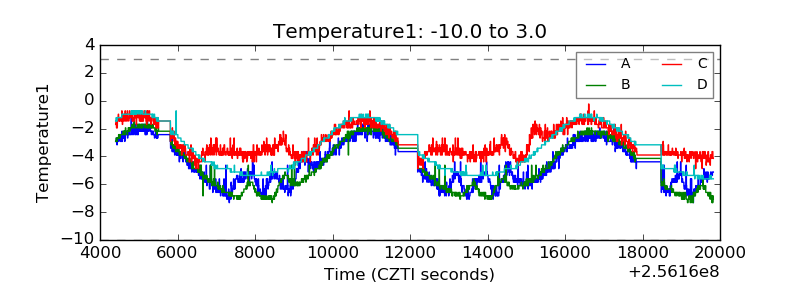 |
| Veto HV Monitor | 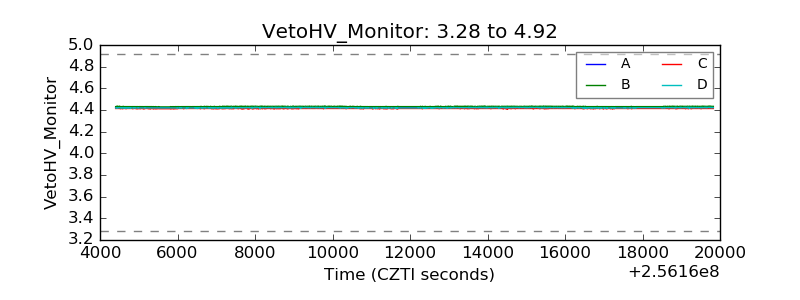 |
| Veto LLD | 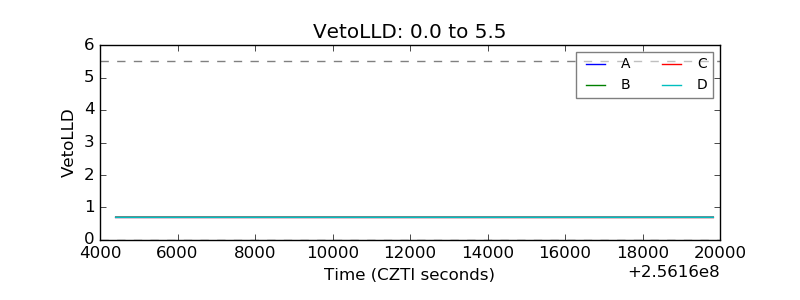 |
| Alpha Counter | 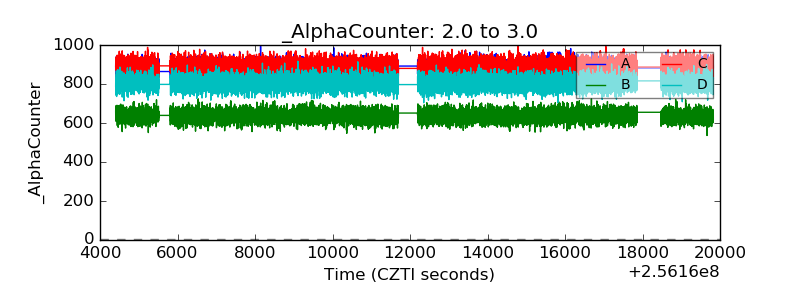 |
| _CPM_Rate | 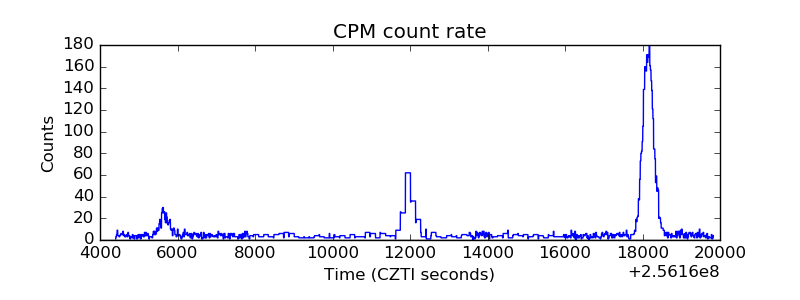 |
| CZT Counter | 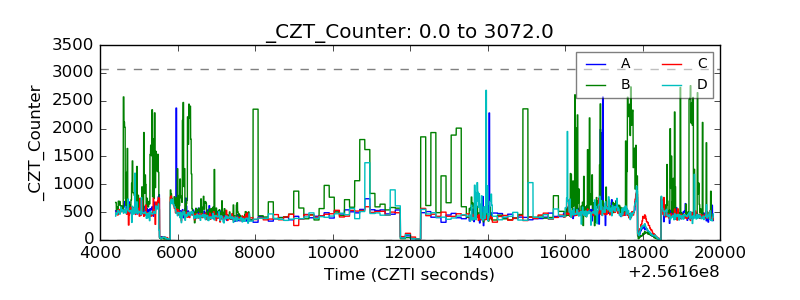 |
| +2.5 Volts monitor | 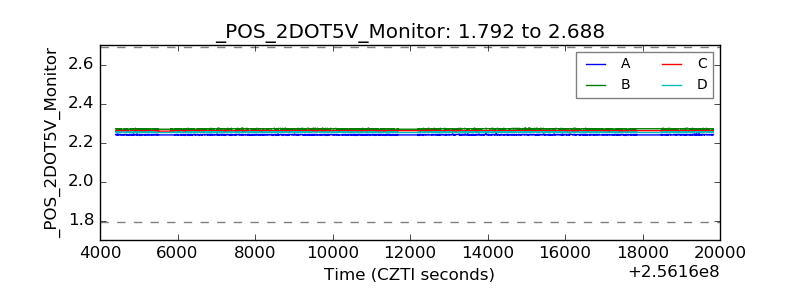 |
| +5 Volts monitor | 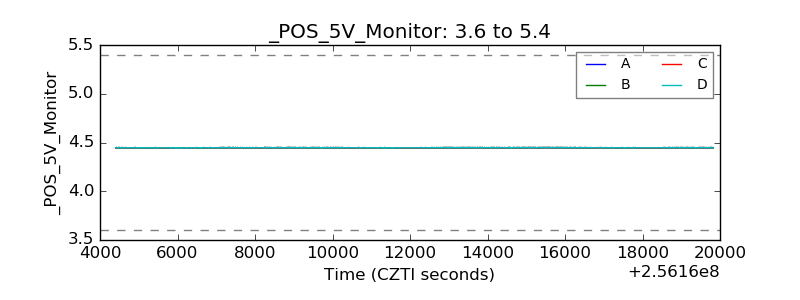 |
| _ROLL_ROT | 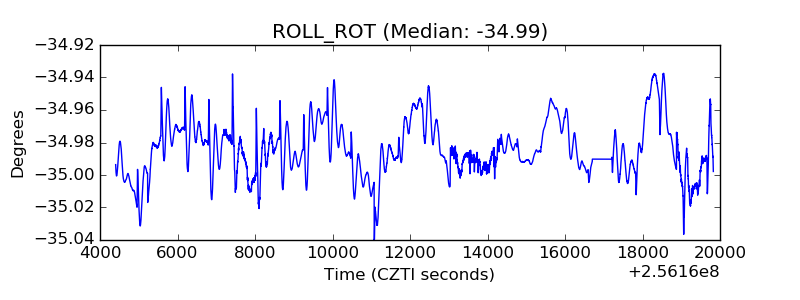 |
| _Roll_DEC | 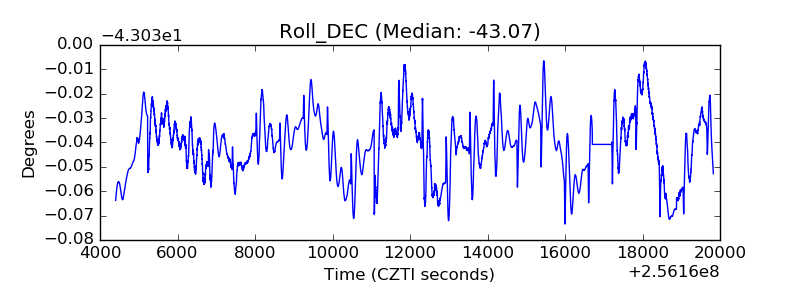 |
| _Roll_RA | 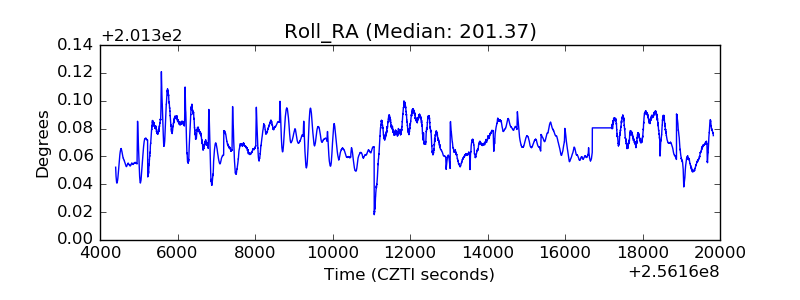 |
| Veto Counter | 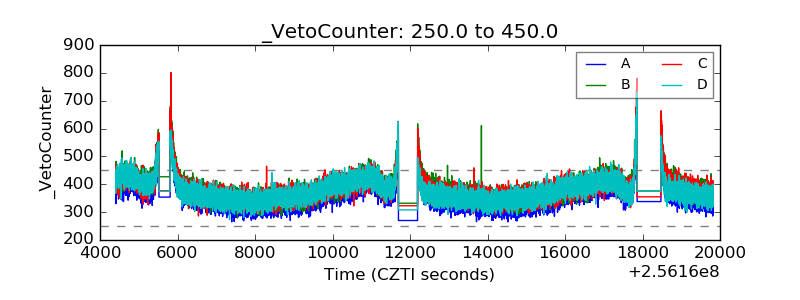 |