| Param | Original file | Final file |
|---|---|---|
| Filename | modeM0/AS1A04_048T01_9000001890_12862cztM0_level2.evt | modeM0/AS1A04_048T01_9000001890_12862cztM0_level2_quad_clean.evt |
| Size (bytes) | 968,477,760 | 152,337,600 |
| Size | 923.6 MB | 145.3 MB |
| Events in quadrant A | 5,765,870 | 974,236 |
| Events in quadrant B | 9,213,658 | 919,389 |
| Events in quadrant C | 5,530,591 | 983,295 |
| Events in quadrant D | 7,998,827 | 896,753 |
| Mode M9 | |||
|---|---|---|---|
| Quadrant | BADHDUFLAG | Total packets | Discarded packets |
| A | 0 | 17 | 0 |
| B | 0 | 17 | 0 |
| C | 0 | 17 | 0 |
| D | 0 | 17 | 0 |
| Mode SS | |||
|---|---|---|---|
| Quadrant | BADHDUFLAG | Total packets | Discarded packets |
| A | 0 | 248 | 0 |
| B | 0 | 248 | 0 |
| C | 0 | 248 | 0 |
| D | 0 | 248 | 0 |
| Mode M0 | |||
|---|---|---|---|
| Quadrant | BADHDUFLAG | Total packets | Discarded packets |
| A | 0 | 25142 | 3 |
| B | 0 | 35341 | 2 |
| C | 0 | 24659 | 2 |
| D | 0 | 32266 | 2 |
| Quadrant | Total seconds | Saturated seconds | Saturation percentage |
|---|---|---|---|
| A | 12136 | 65 | 0.535597% |
| B | 12136 | 1450 | 11.947924% |
| C | 12136 | 28 | 0.230719% |
| D | 12136 | 788 | 6.493078% |
Noise dominated data is calculated using 1-second bins in cleaned event files. If a bin has >2000 counts, and if more than 50% of those come from <1% of pixels, then it is considered to be noise-dominated and hence unusable.
| Quadrant | # 1 sec bins | Bins with >0 counts | Bins with >2000 counts | High rate bins dominated by noise | Noise dominated (total time) | Noise dominated (detector-on time) | Marked lightcurve |
|---|---|---|---|---|---|---|---|
| A | 13912 | 12139 | 25 | 25 | 0.18% | 0.21% | 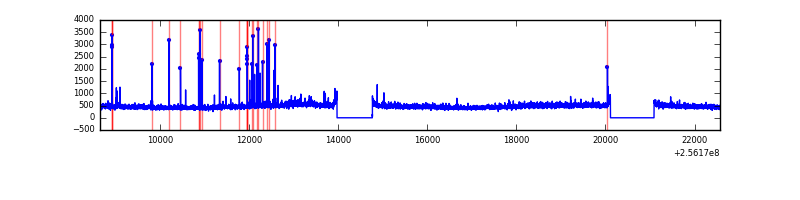 |
| B | 13912 | 12139 | 986 | 986 | 7.09% | 8.12% | 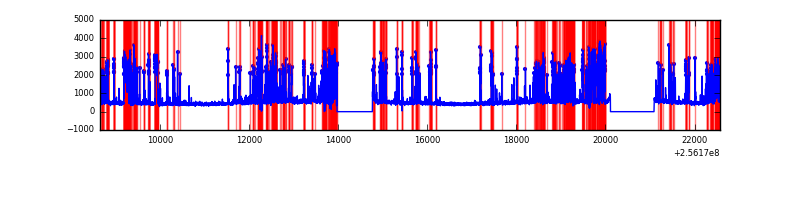 |
| C | 13912 | 12139 | 4 | 4 | 0.03% | 0.03% | 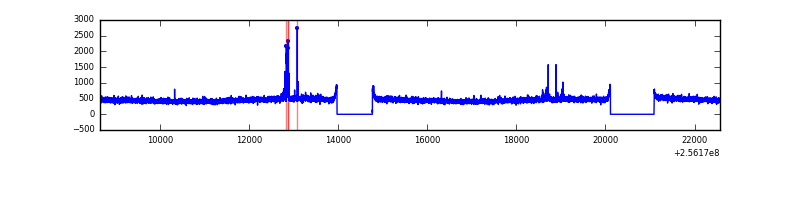 |
| D | 13912 | 12139 | 764 | 764 | 5.49% | 6.29% | 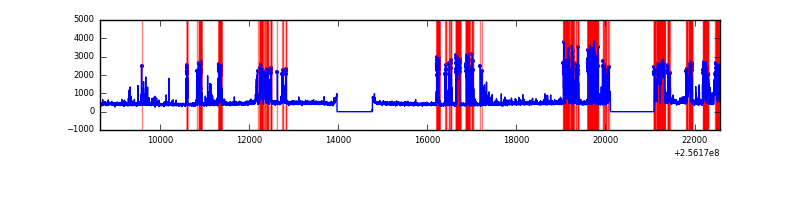 |
Top three noisy pixels from each quadrant. If the there are fewer than three noisy pixels in the level2.evt file, extra rows are filled as -1
| Pixel properties | Quadrant properties | ||||||
|---|---|---|---|---|---|---|---|
| Quadrant | DetID | PixID | Counts | Sigma | Mean | Median | Sigma |
| A | 12 | 189 | 176908 | 608.94 | 1423 | 1392 | 288.2 |
| A | 15 | 222 | 81282 | 277.17 | 1423 | 1392 | 288.2 |
| A | 9 | 143 | 23300 | 76.01 | 1423 | 1392 | 288.2 |
| B | 4 | 239 | 3568133 | 14146.42 | 1334 | 1298 | 252.1 |
| B | 0 | 219 | 161117 | 633.86 | 1334 | 1298 | 252.1 |
| B | 3 | 64 | 84381 | 329.52 | 1334 | 1298 | 252.1 |
| C | 14 | 234 | 65146 | 196.78 | 1402 | 1410 | 323.9 |
| C | 13 | 61 | 10156 | 27.0 | 1402 | 1410 | 323.9 |
| C | 3 | 202 | 3505 | 6.47 | 1402 | 1410 | 323.9 |
| D | 1 | 52 | 2266087 | 7041.98 | 1350 | 1314 | 321.6 |
| D | 10 | 157 | 514543 | 1595.81 | 1350 | 1314 | 321.6 |
| D | 2 | 234 | 41941 | 126.32 | 1350 | 1314 | 321.6 |
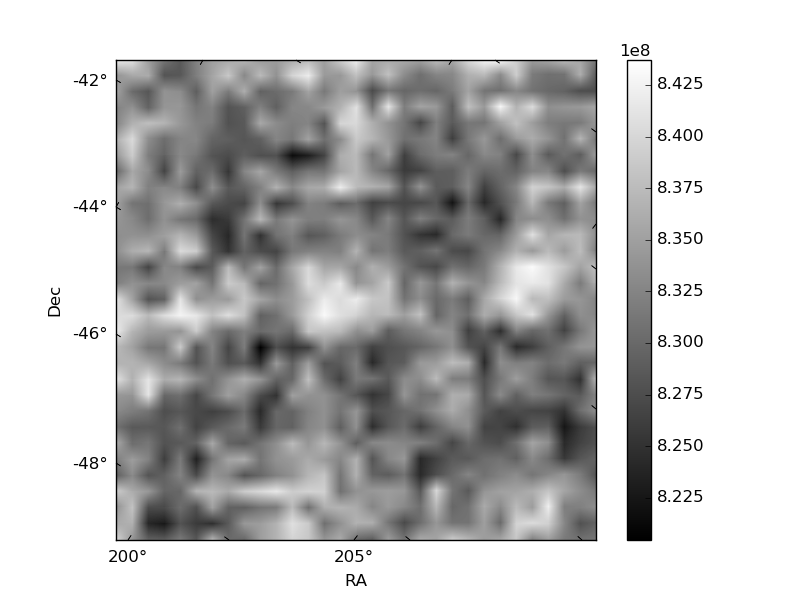
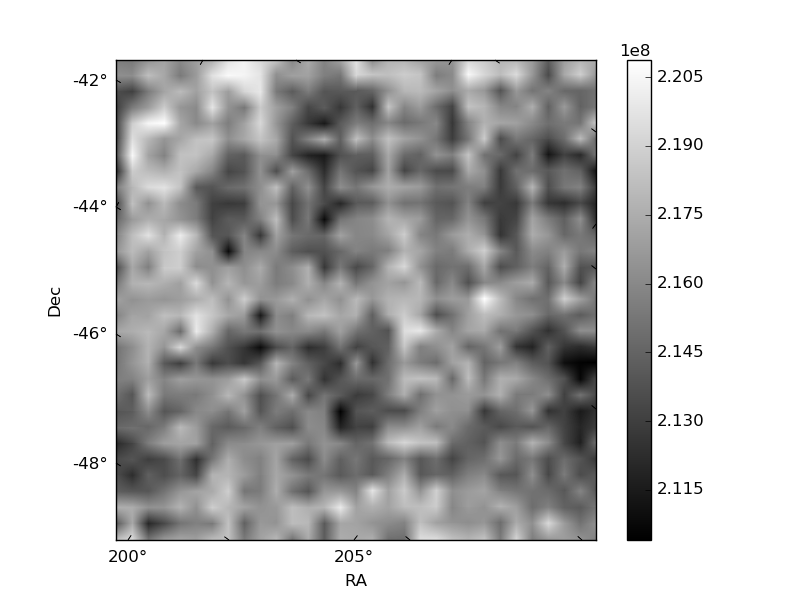
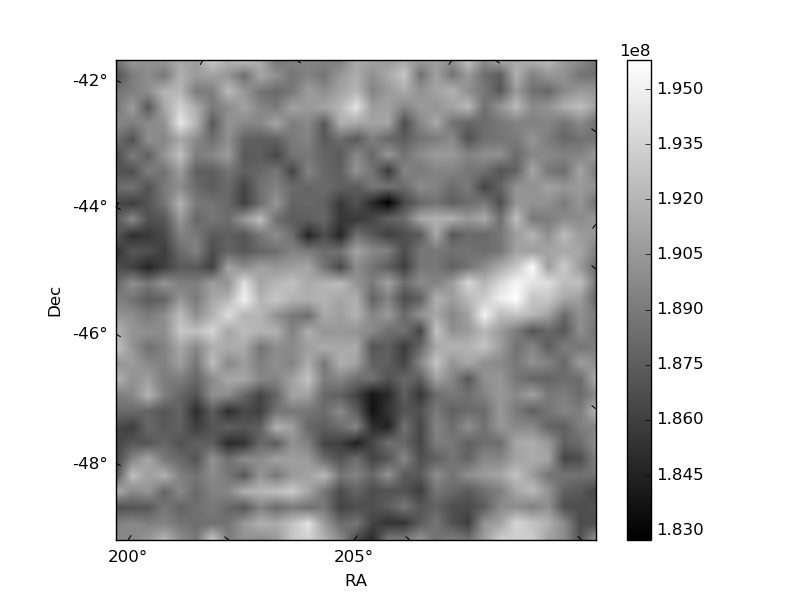
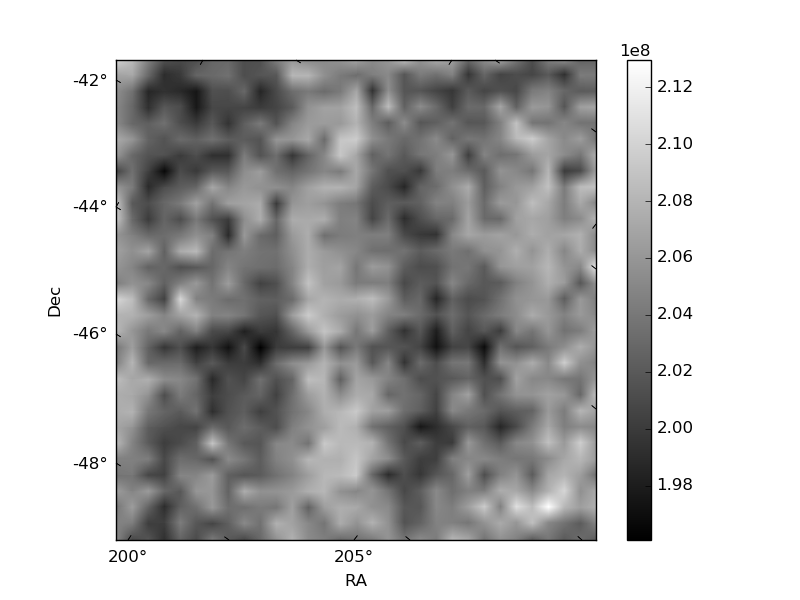
Histogram calculated using DETX and DETY for each event in the final _common_clean file
| Quadrant A | 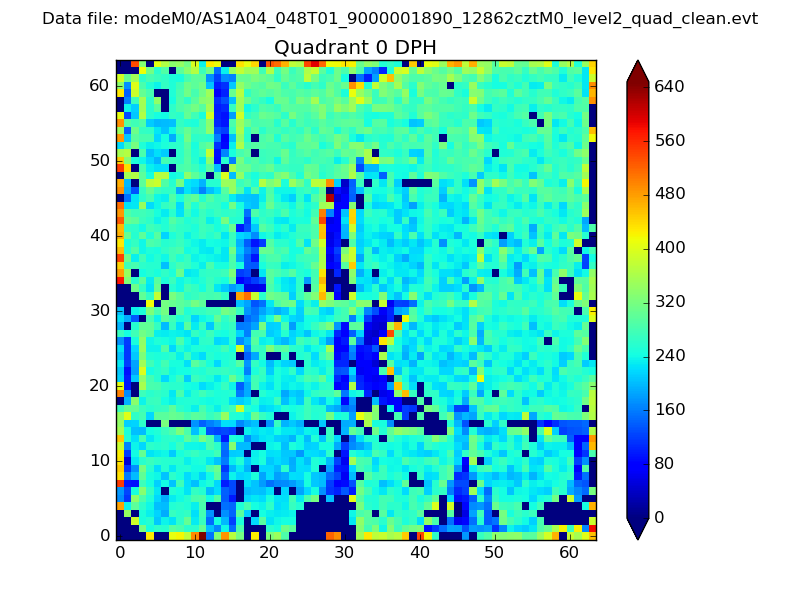 |
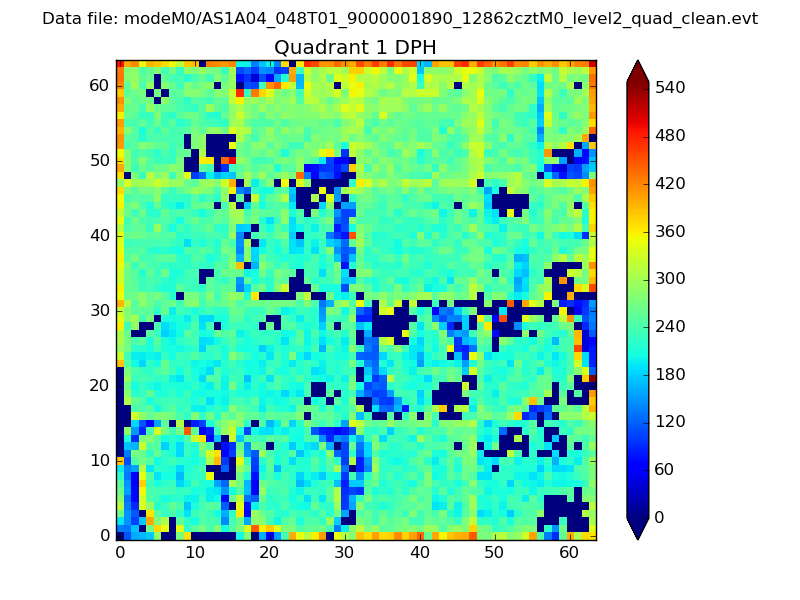 |
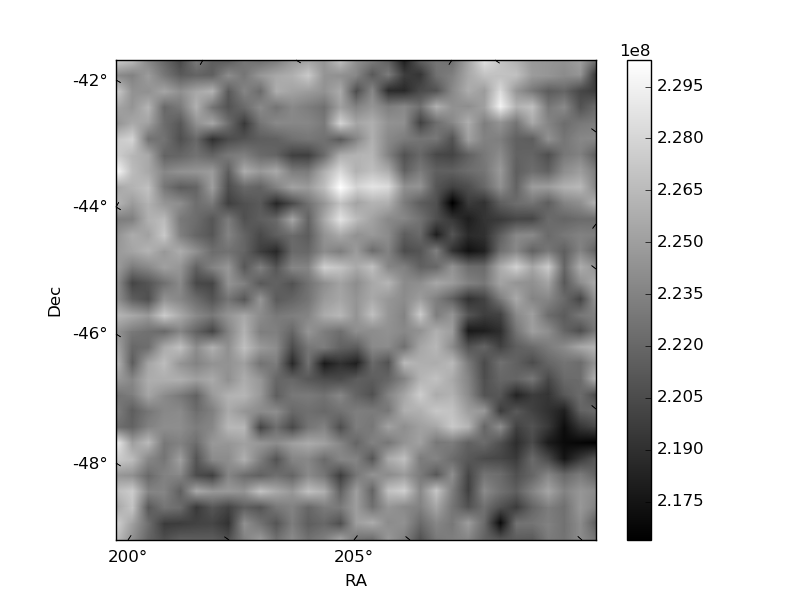
Quadrant B |
|---|---|---|---|
| Quadrant D | 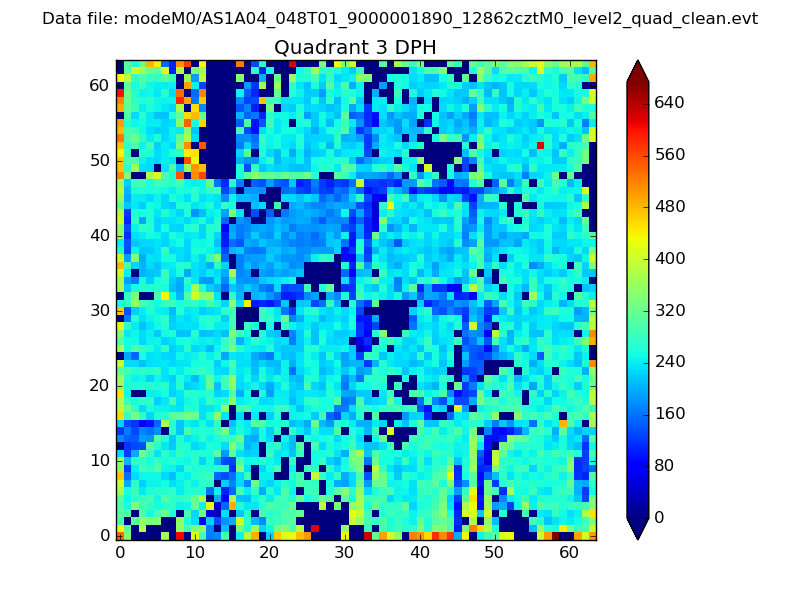 |
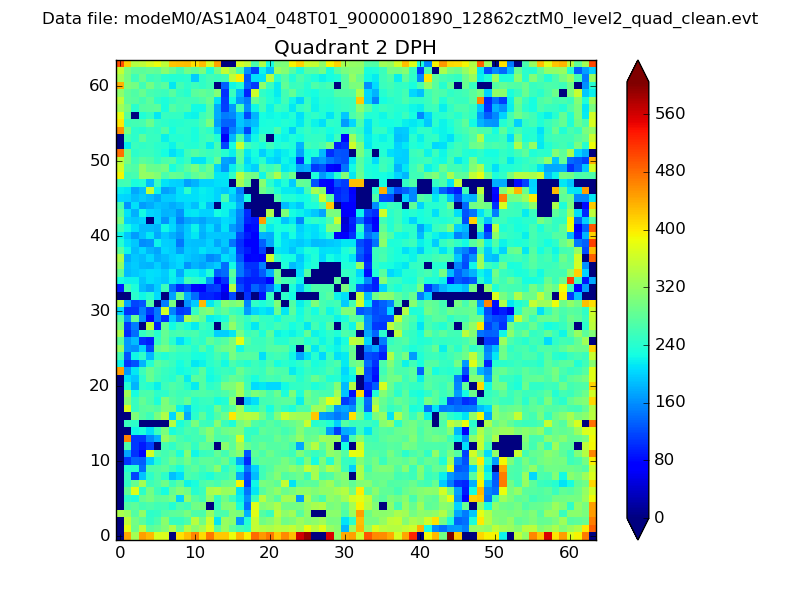 |
Quadrant C |
| Plot type | Count rate plots | Images |
|---|---|---|
| Comparison with Poisson distribution Blue bars denote a histogram of data divided into 1 sec bins. Red curve is a Poisson curve with rate = median count rate of data. |
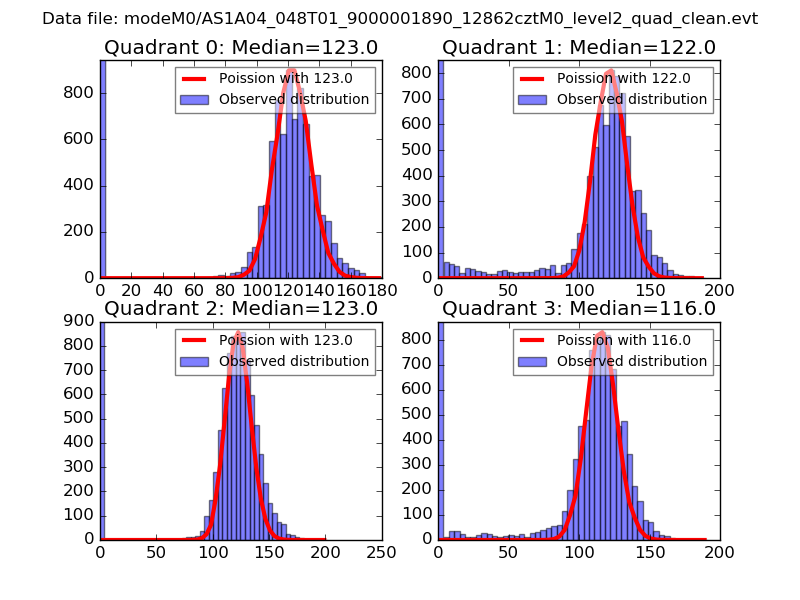 |
 |
| Quadrant-wise count rates Data is divided into 100 sec bins |
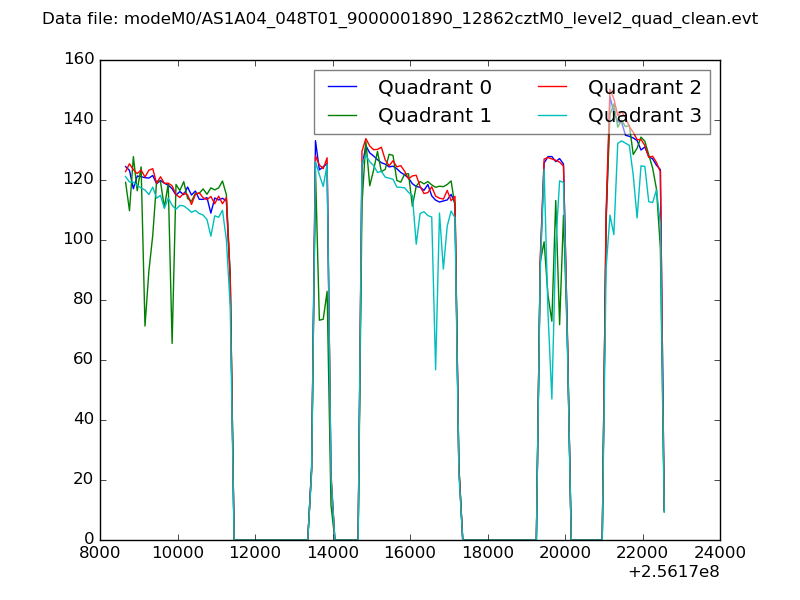 |
|
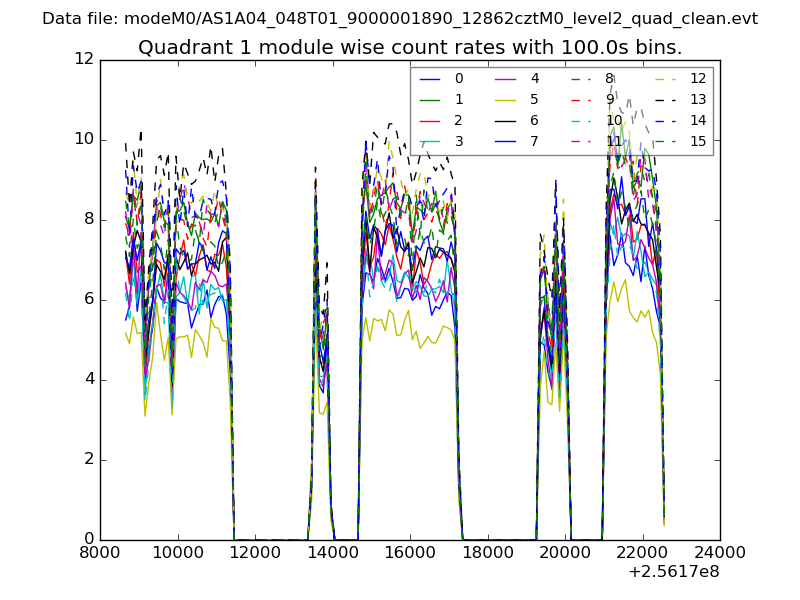
| Module-wise count rates for Quadrant A Data is divided into 100 sec bins |
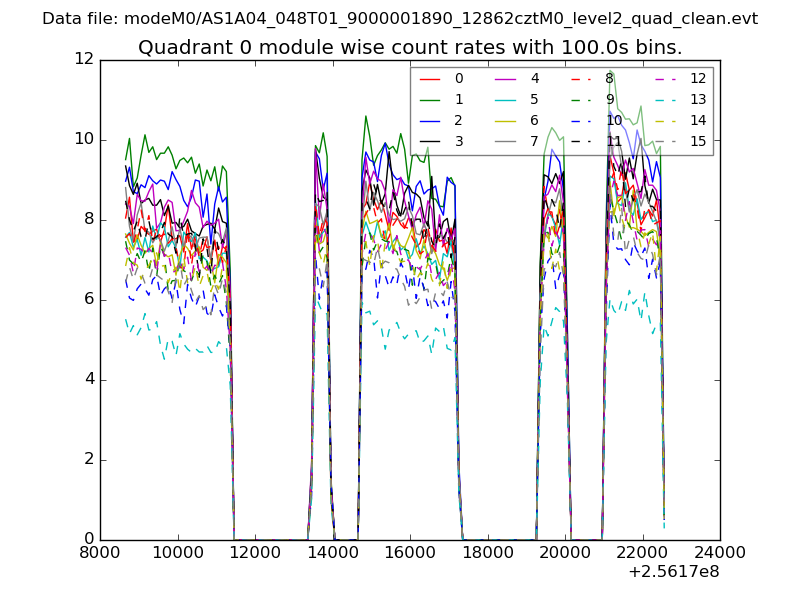 |
 |
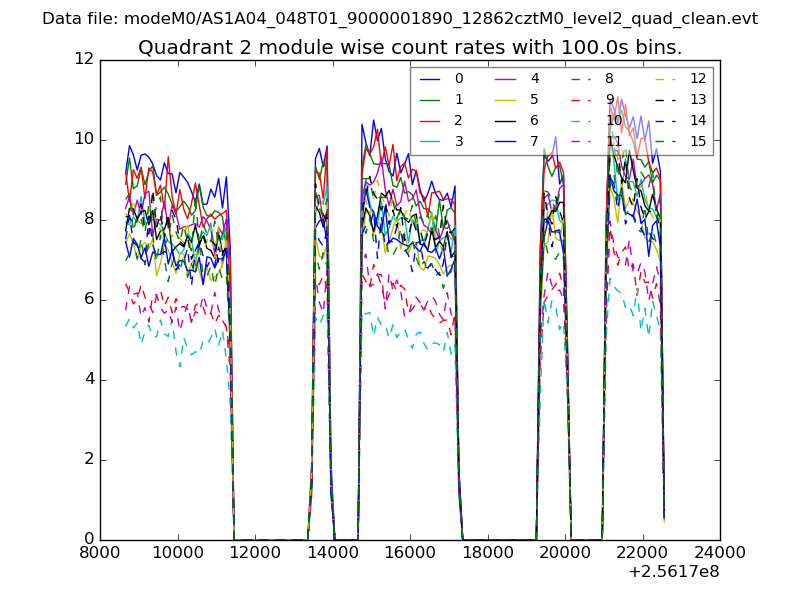
| Module-wise count rates for Quadrant B Data is divided into 100 sec bins |
 |
 |
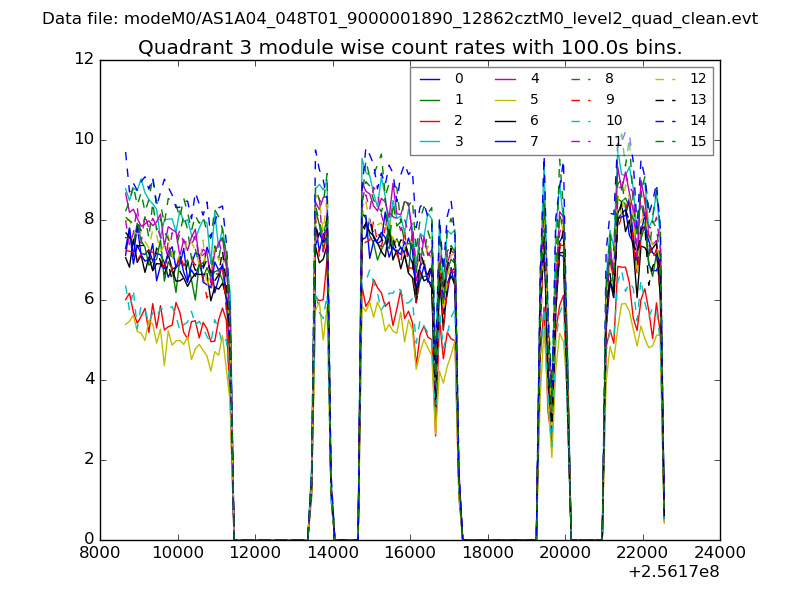
| Module-wise count rates for Quadrant C Data is divided into 100 sec bins |
 |
 |
| Module-wise count rates for Quadrant D Data is divided into 100 sec bins |
 |
 |
| Parameter | Plot |
|---|---|
| CZT HV Monitor | 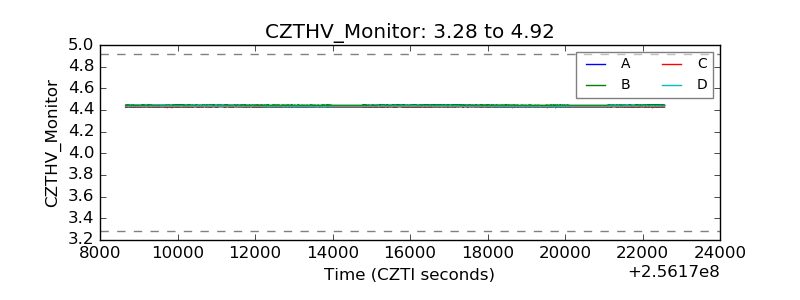 |
| D_VDD |  |
| Temperature 1 | 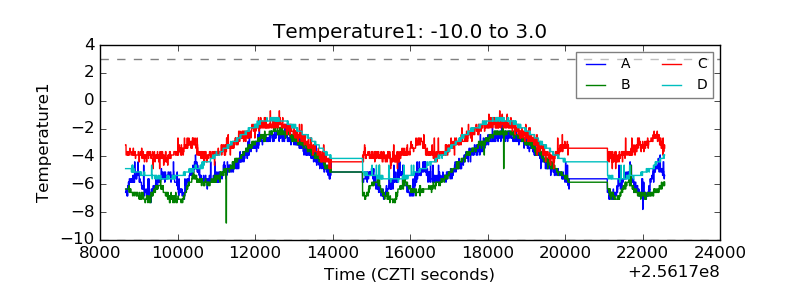 |
| Veto HV Monitor | 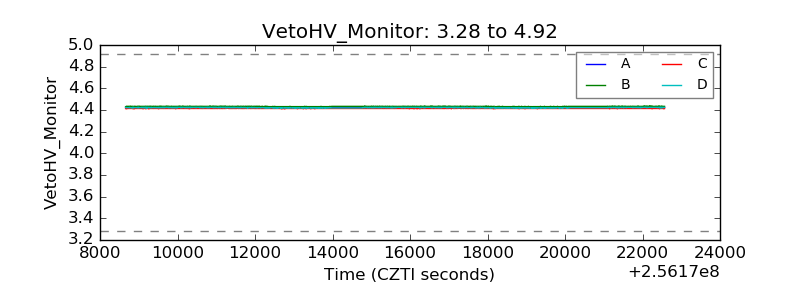 |
| Veto LLD | 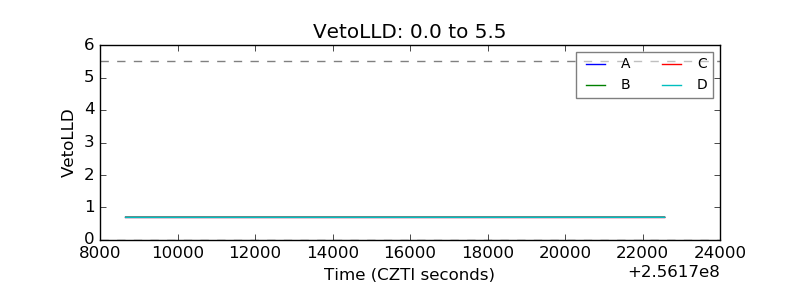 |
| Alpha Counter | 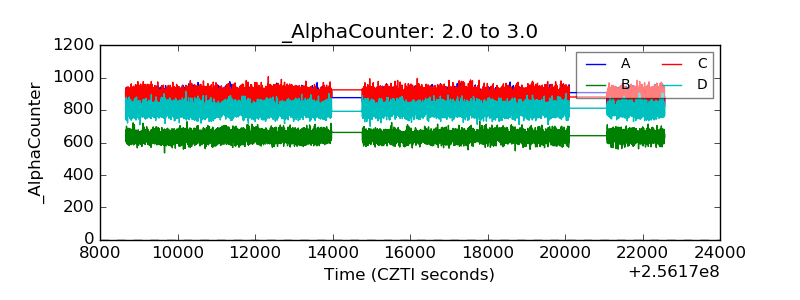 |
| _CPM_Rate | 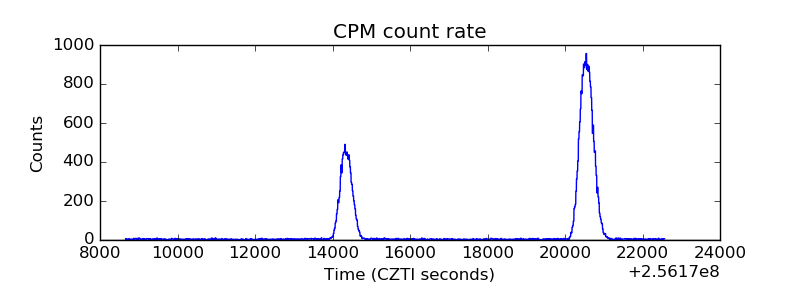 |
| CZT Counter | 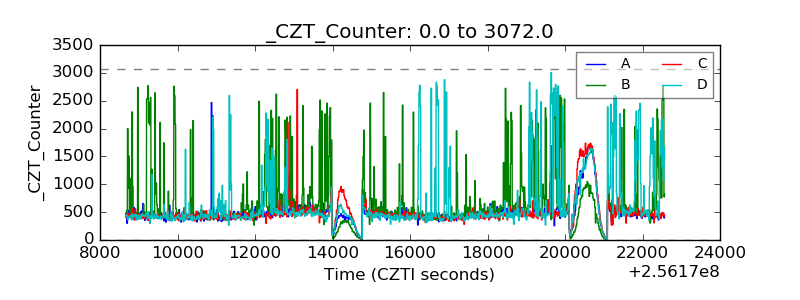 |
| +2.5 Volts monitor |  |
| +5 Volts monitor |  |
| _ROLL_ROT | 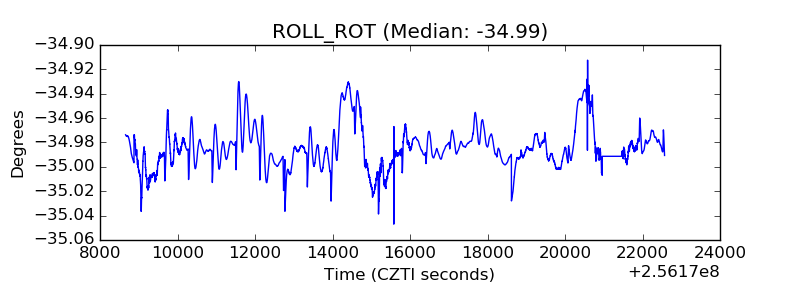 |
| _Roll_DEC | 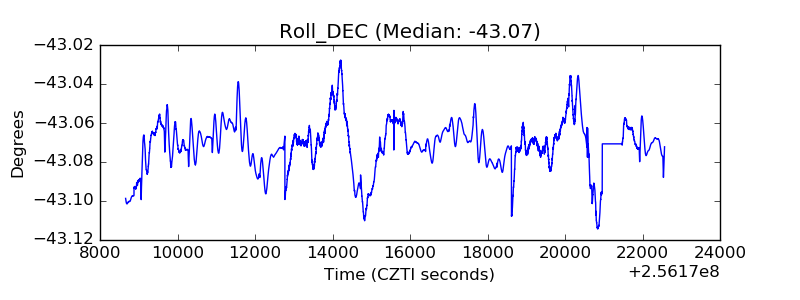 |
| _Roll_RA | 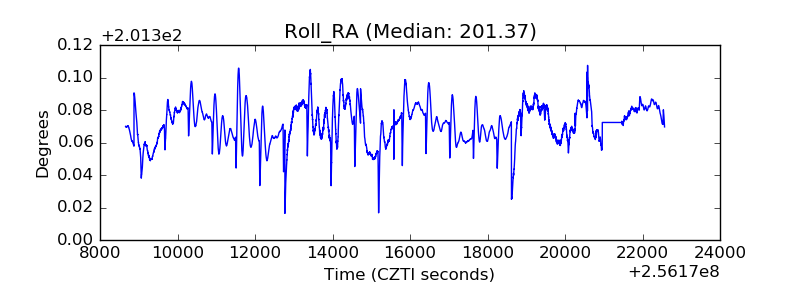 |
| Veto Counter | 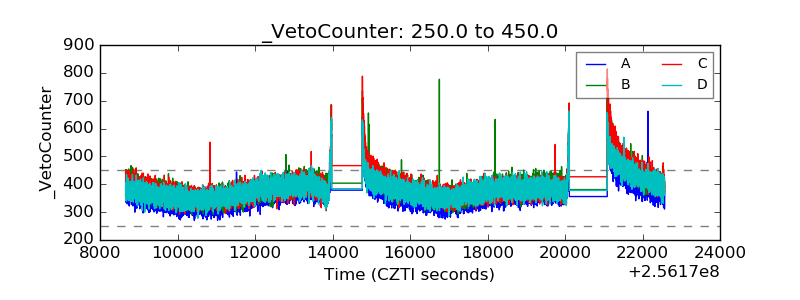 |