| Param | Original file | Final file |
|---|---|---|
| Filename | modeM0/AS1A04_048T01_9000001890_12864cztM0_level2.evt | modeM0/AS1A04_048T01_9000001890_12864cztM0_level2_quad_clean.evt |
| Size (bytes) | 630,587,520 | 91,370,880 |
| Size | 601.4 MB | 87.1 MB |
| Events in quadrant A | 3,114,953 | 596,603 |
| Events in quadrant B | 5,662,485 | 564,022 |
| Events in quadrant C | 3,076,442 | 603,876 |
| Events in quadrant D | 6,803,718 | 549,326 |
| Mode M9 | |||
|---|---|---|---|
| Quadrant | BADHDUFLAG | Total packets | Discarded packets |
| A | 0 | 11 | 0 |
| B | 0 | 11 | 0 |
| C | 0 | 11 | 0 |
| D | 0 | 12 | 0 |
| Mode SS | |||
|---|---|---|---|
| Quadrant | BADHDUFLAG | Total packets | Discarded packets |
| A | 0 | 132 | 0 |
| B | 0 | 132 | 0 |
| C | 0 | 132 | 0 |
| D | 0 | 132 | 0 |
| Mode M0 | |||
|---|---|---|---|
| Quadrant | BADHDUFLAG | Total packets | Discarded packets |
| A | 0 | 13359 | 3 |
| B | 0 | 21104 | 2 |
| C | 0 | 13332 | 2 |
| D | 0 | 24442 | 2 |
| Quadrant | Total seconds | Saturated seconds | Saturation percentage |
|---|---|---|---|
| A | 6490 | 56 | 0.862866% |
| B | 6490 | 933 | 14.375963% |
| C | 6490 | 54 | 0.832049% |
| D | 6490 | 1322 | 20.369800% |
Noise dominated data is calculated using 1-second bins in cleaned event files. If a bin has >2000 counts, and if more than 50% of those come from <1% of pixels, then it is considered to be noise-dominated and hence unusable.
| Quadrant | # 1 sec bins | Bins with >0 counts | Bins with >2000 counts | High rate bins dominated by noise | Noise dominated (total time) | Noise dominated (detector-on time) | Marked lightcurve |
|---|---|---|---|---|---|---|---|
| A | 7556 | 6492 | 2 | 2 | 0.03% | 0.03% | 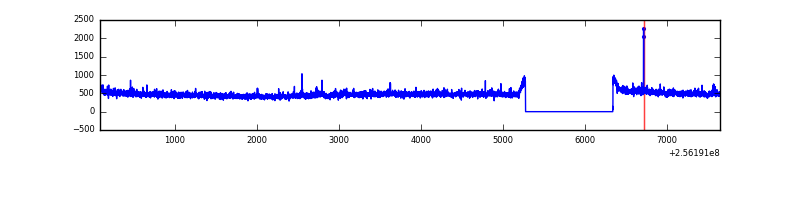 |
| B | 7556 | 6491 | 585 | 585 | 7.74% | 9.01% | 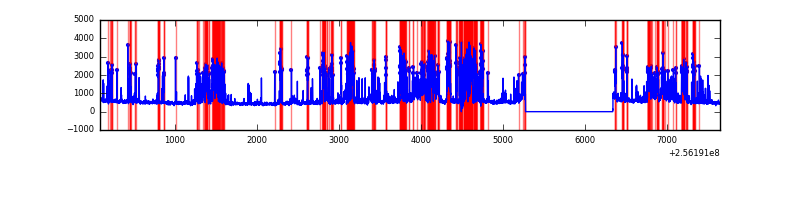 |
| C | 7556 | 6492 | 0 | 0 | 0.00% | 0.00% | 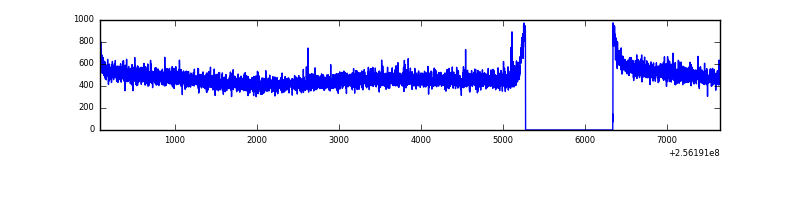 |
| D | 7556 | 6492 | 1312 | 1312 | 17.36% | 20.21% | 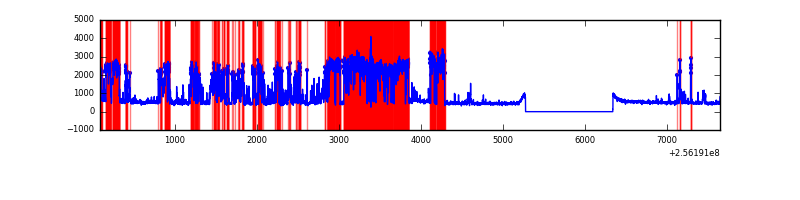 |
Top three noisy pixels from each quadrant. If the there are fewer than three noisy pixels in the level2.evt file, extra rows are filled as -1
| Pixel properties | Quadrant properties | ||||||
|---|---|---|---|---|---|---|---|
| Quadrant | DetID | PixID | Counts | Sigma | Mean | Median | Sigma |
| A | 12 | 189 | 42996 | 262.5 | 796 | 780 | 160.8 |
| A | 0 | 226 | 7354 | 40.88 | 796 | 780 | 160.8 |
| A | 12 | 194 | 6198 | 33.69 | 796 | 780 | 160.8 |
| B | 4 | 239 | 2120024 | 15269.03 | 736 | 719 | 138.8 |
| B | 0 | 85 | 326677 | 2348.44 | 736 | 719 | 138.8 |
| B | 3 | 64 | 99362 | 710.7 | 736 | 719 | 138.8 |
| C | 13 | 61 | 5679 | 26.79 | 788 | 792 | 182.4 |
| C | 4 | 112 | 4234 | 18.87 | 788 | 792 | 182.4 |
| C | 4 | 175 | 2327 | 8.41 | 788 | 792 | 182.4 |
| D | 1 | 52 | 4023777 | 23483.25 | 720 | 701 | 171.3 |
| D | 2 | 234 | 19872 | 111.9 | 720 | 701 | 171.3 |
| D | 2 | 136 | 17346 | 97.16 | 720 | 701 | 171.3 |
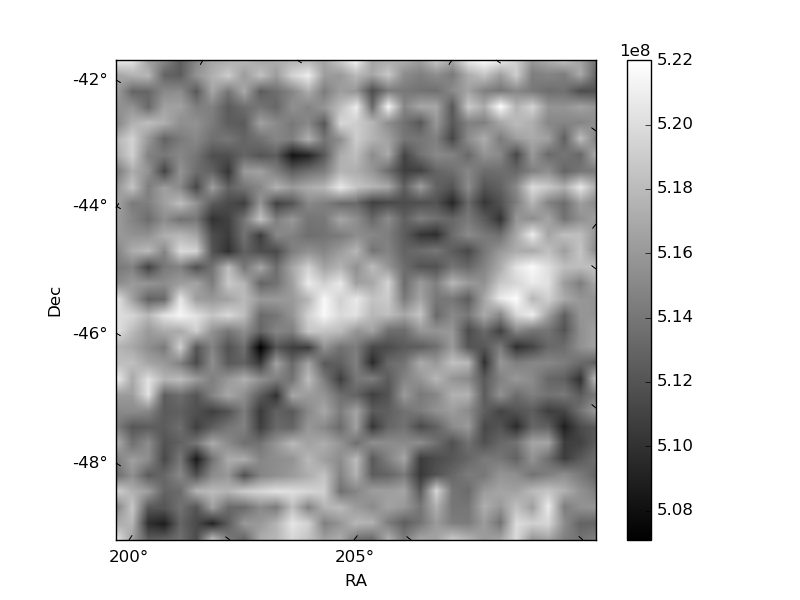
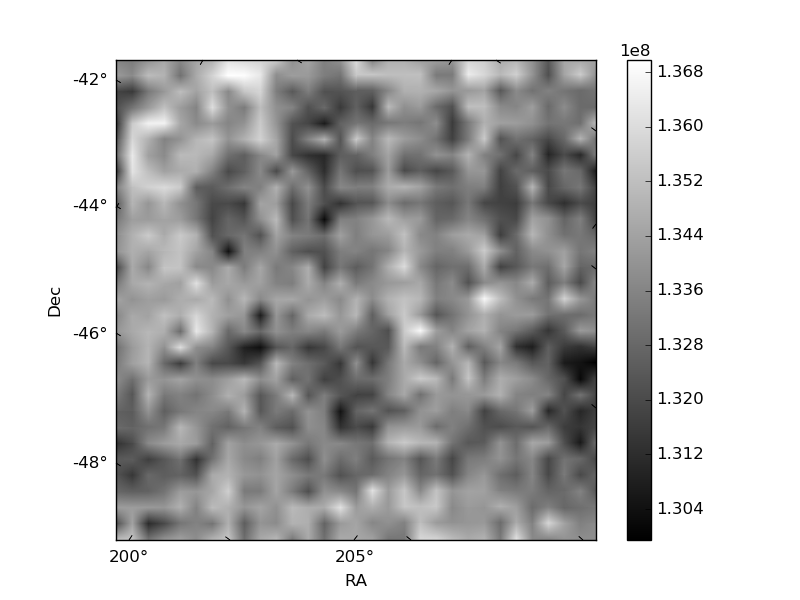
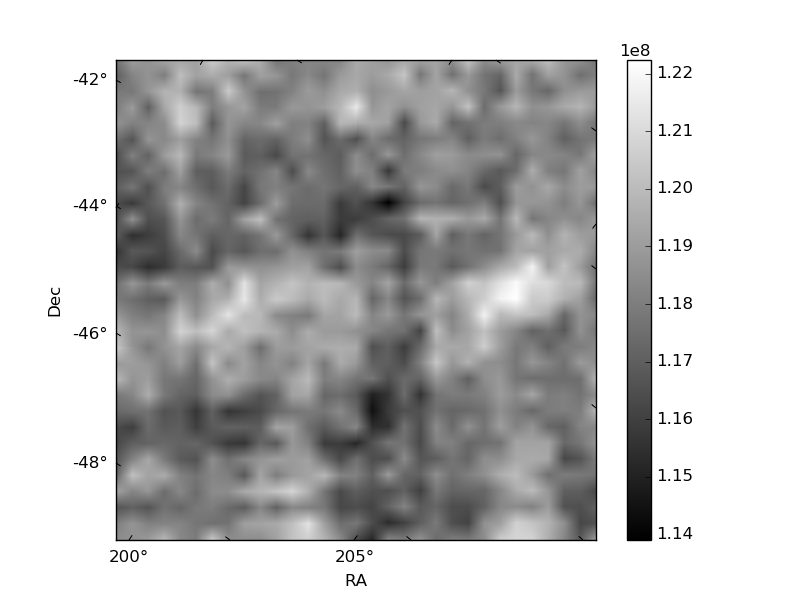
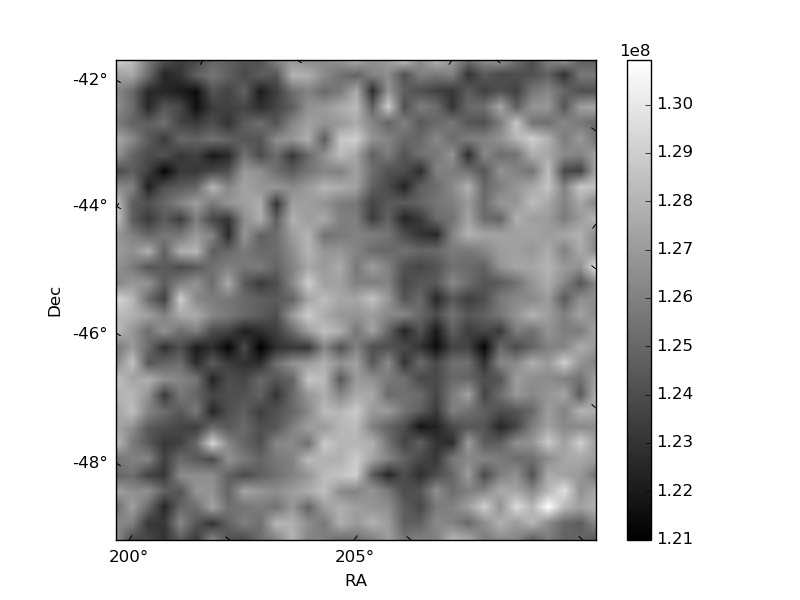
Histogram calculated using DETX and DETY for each event in the final _common_clean file
| Quadrant A | 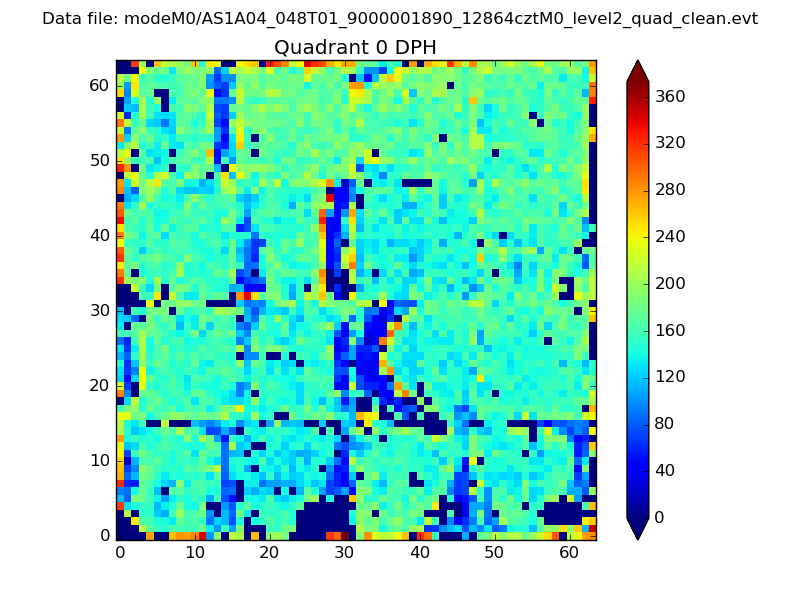 |
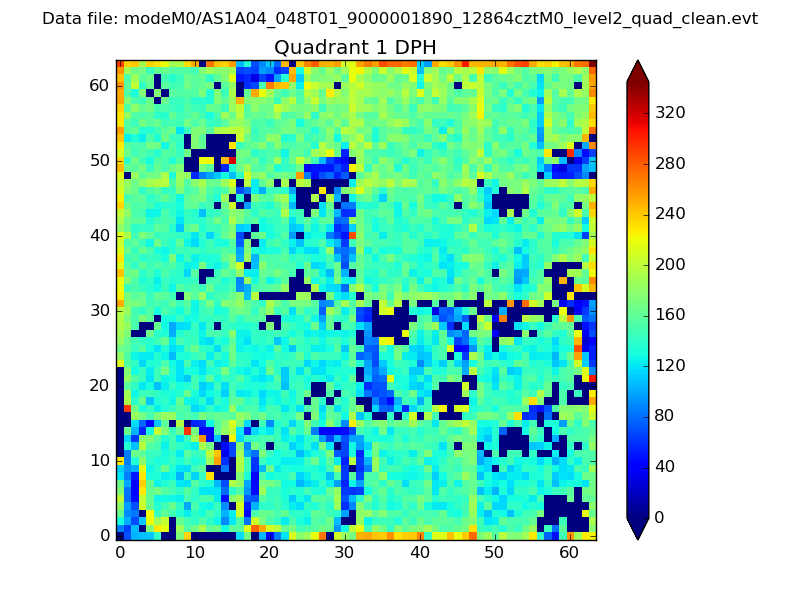 |
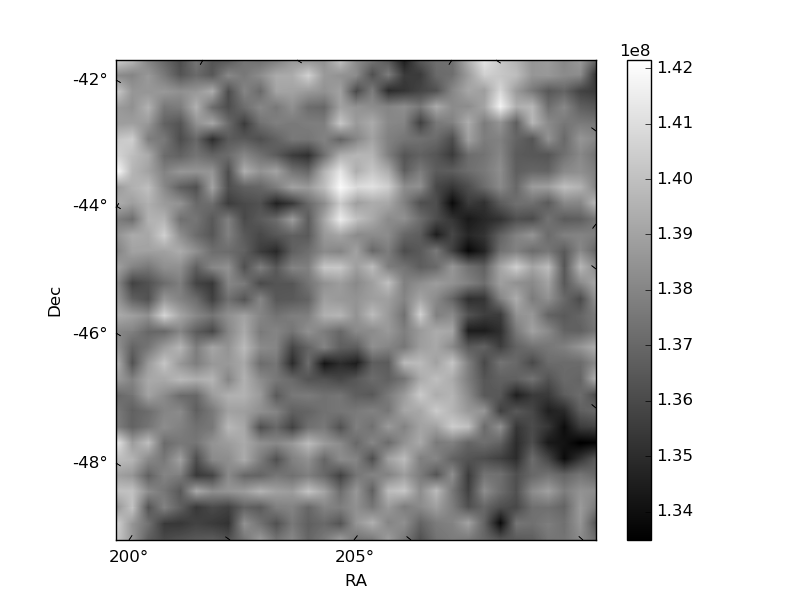
Quadrant B |
|---|---|---|---|
| Quadrant D | 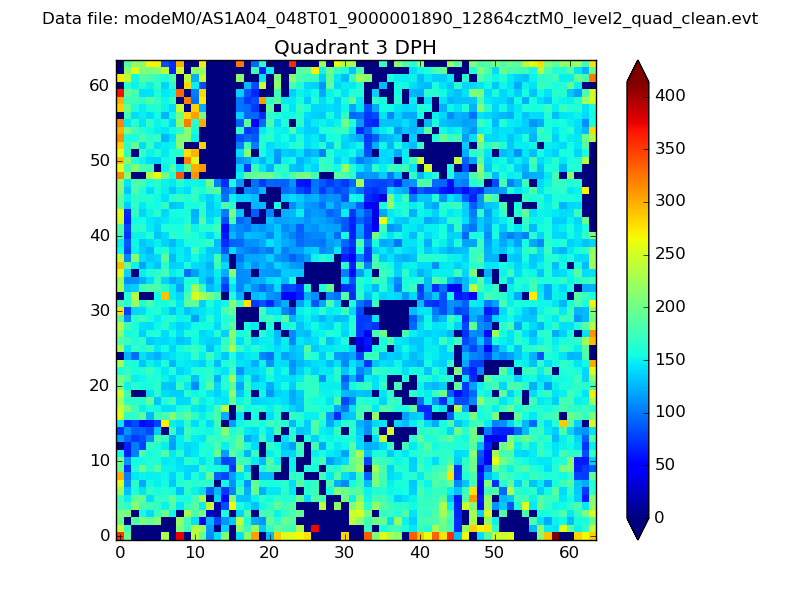 |
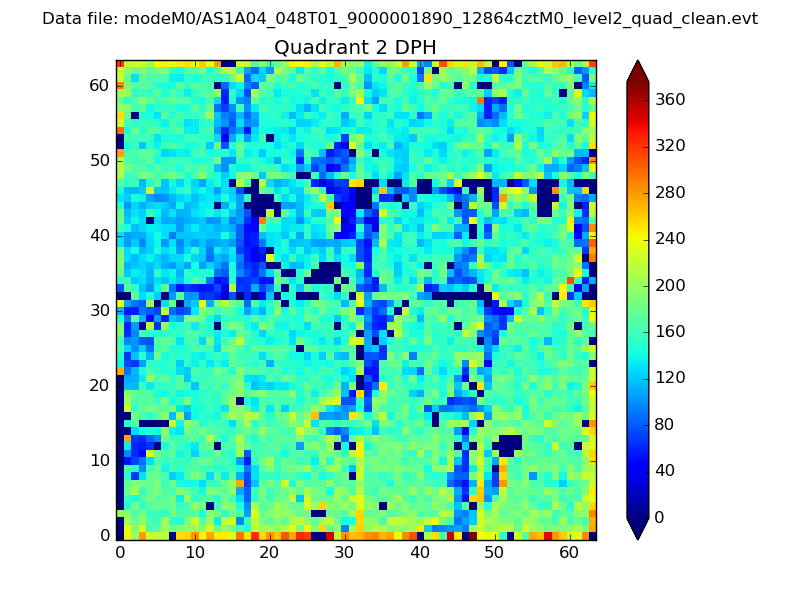 |
Quadrant C |
| Plot type | Count rate plots | Images |
|---|---|---|
| Comparison with Poisson distribution Blue bars denote a histogram of data divided into 1 sec bins. Red curve is a Poisson curve with rate = median count rate of data. |
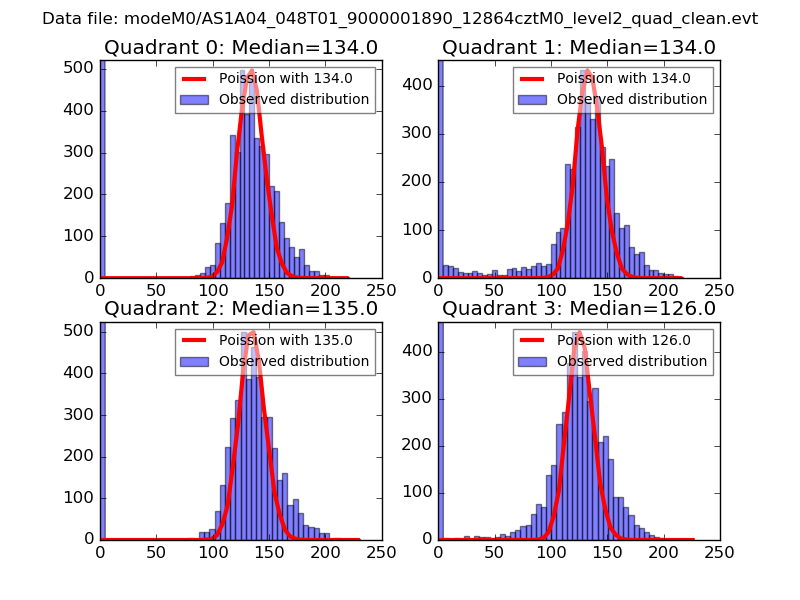 |
 |
| Quadrant-wise count rates Data is divided into 100 sec bins |
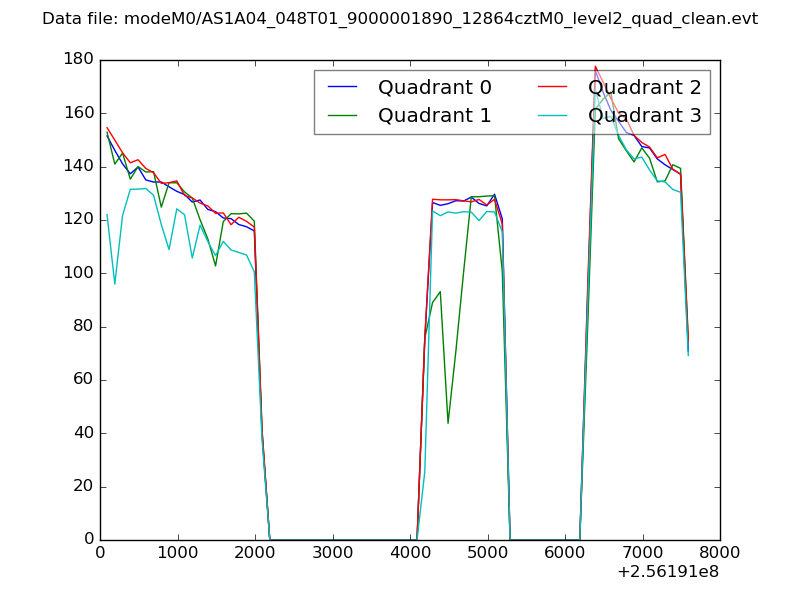 |
|
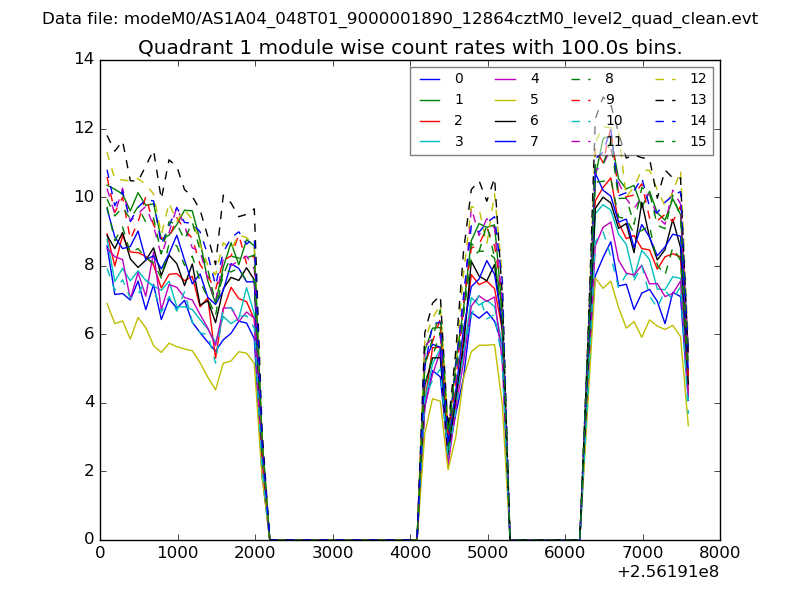
| Module-wise count rates for Quadrant A Data is divided into 100 sec bins |
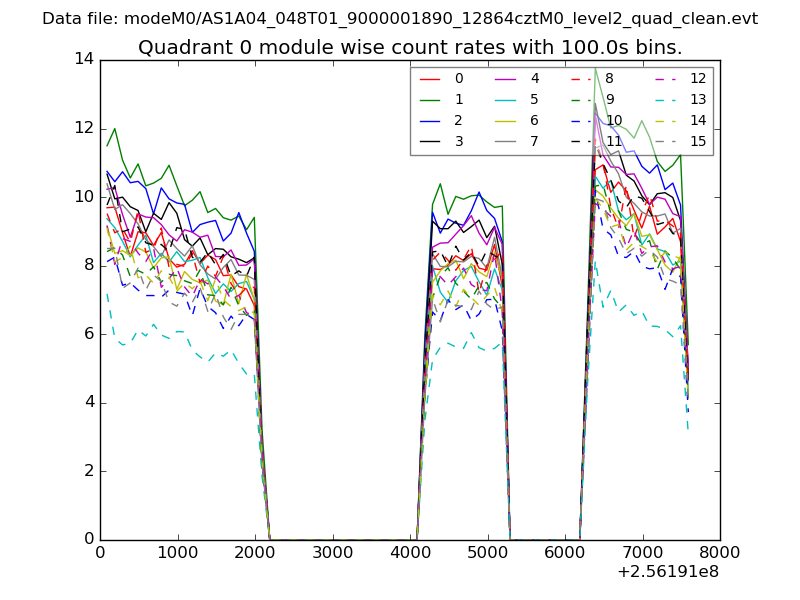 |
 |
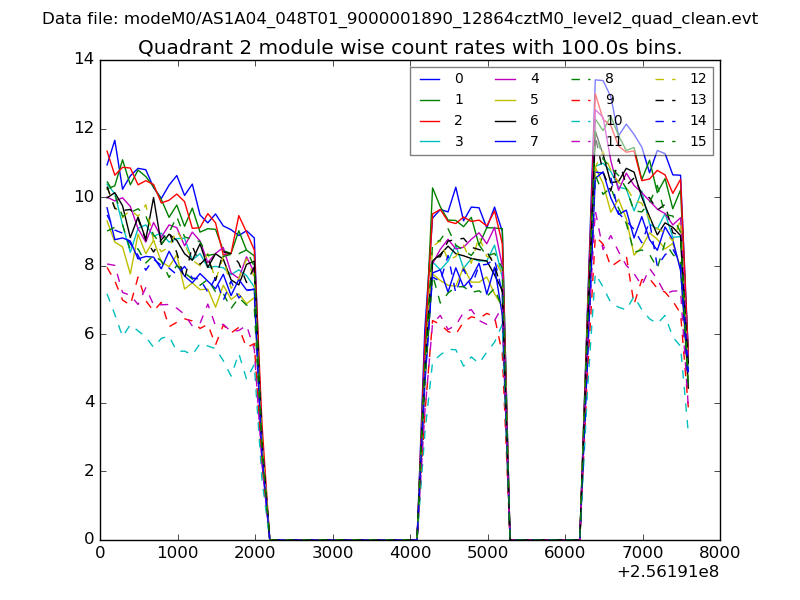
| Module-wise count rates for Quadrant B Data is divided into 100 sec bins |
 |
 |
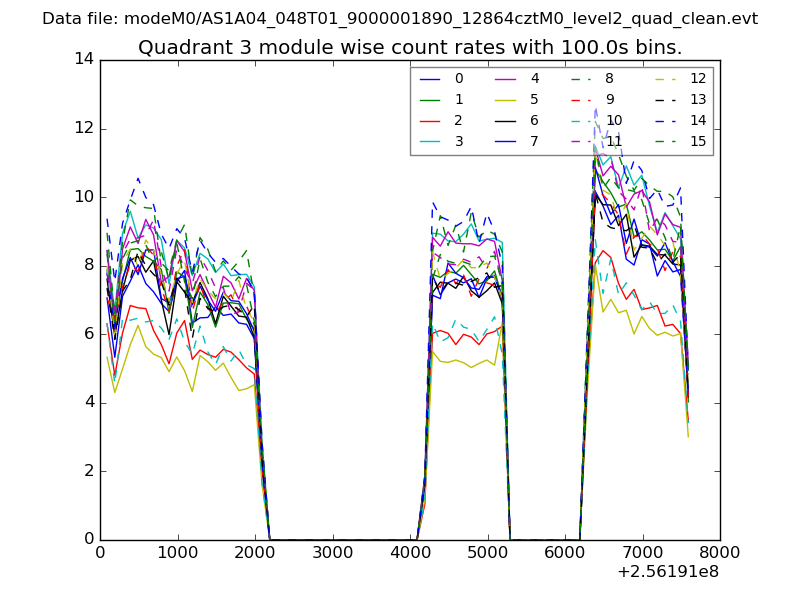
| Module-wise count rates for Quadrant C Data is divided into 100 sec bins |
 |
 |
| Module-wise count rates for Quadrant D Data is divided into 100 sec bins |
 |
 |
| Parameter | Plot |
|---|---|
| CZT HV Monitor | 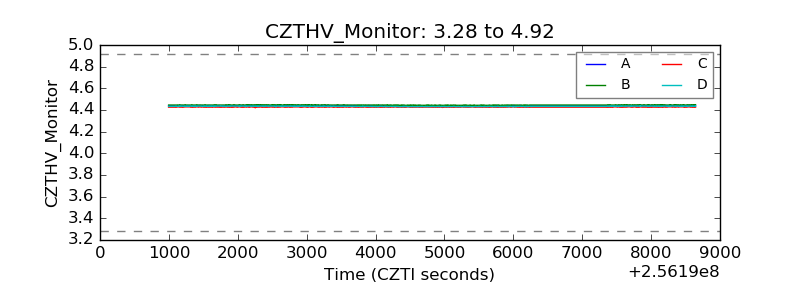 |
| D_VDD | 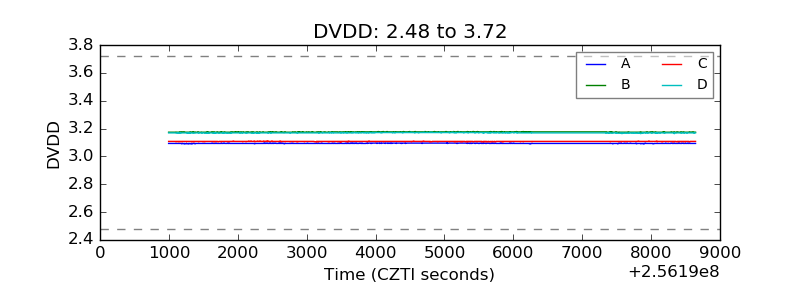 |
| Temperature 1 | 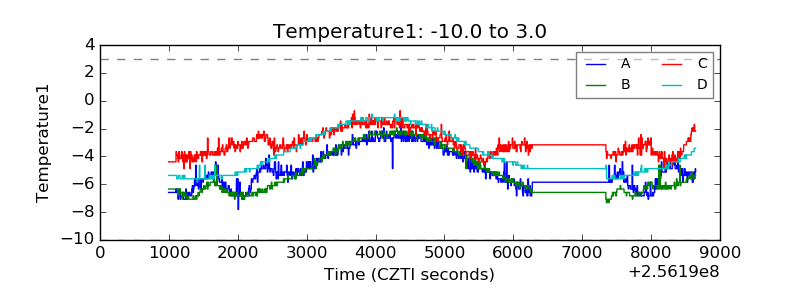 |
| Veto HV Monitor | 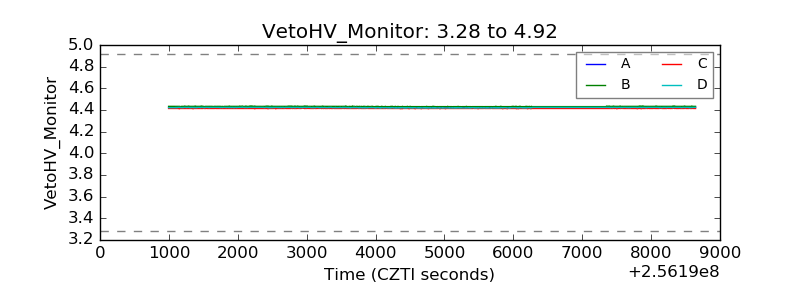 |
| Veto LLD | 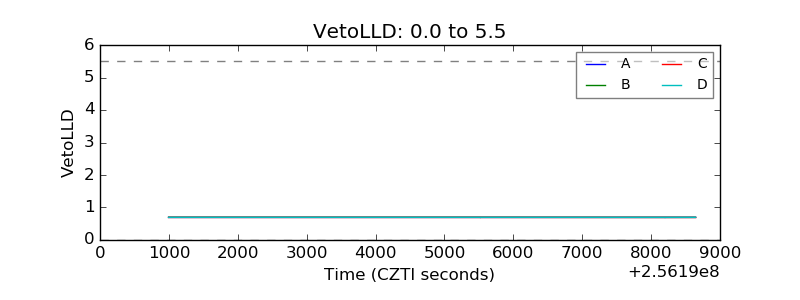 |
| Alpha Counter | 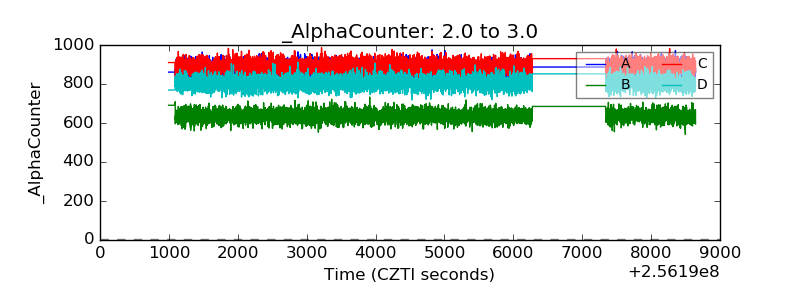 |
| _CPM_Rate | 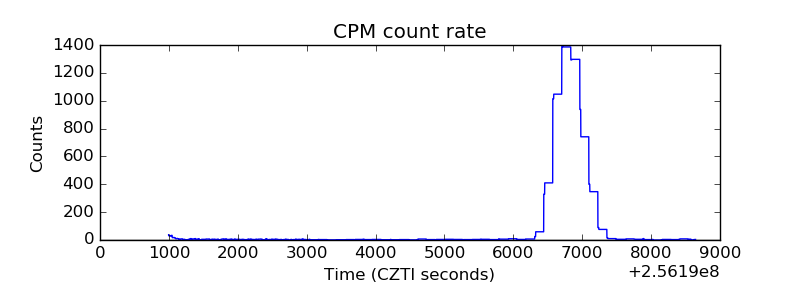 |
| CZT Counter | 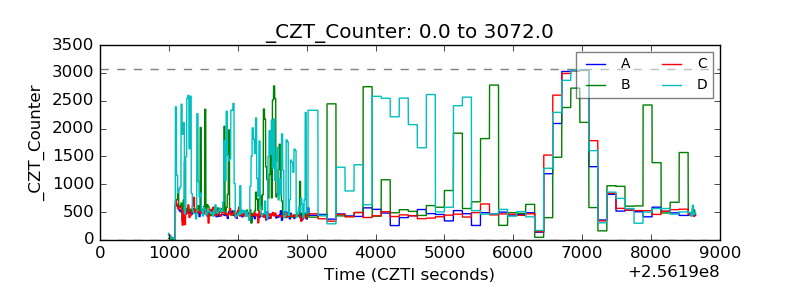 |
| +2.5 Volts monitor | 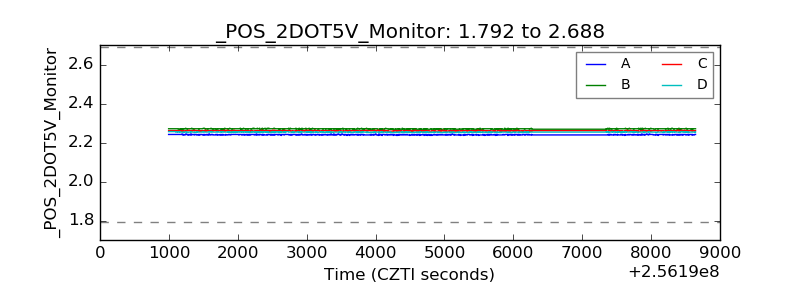 |
| +5 Volts monitor |  |
| _ROLL_ROT | 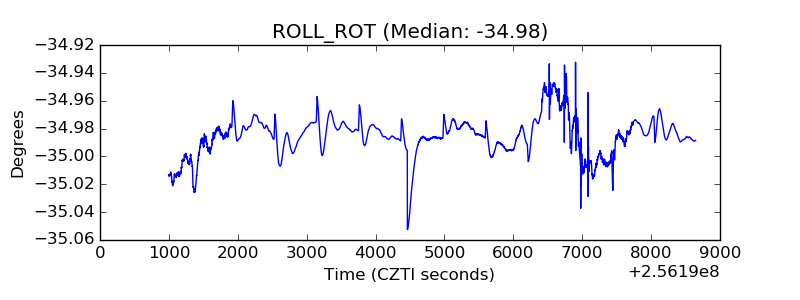 |
| _Roll_DEC | 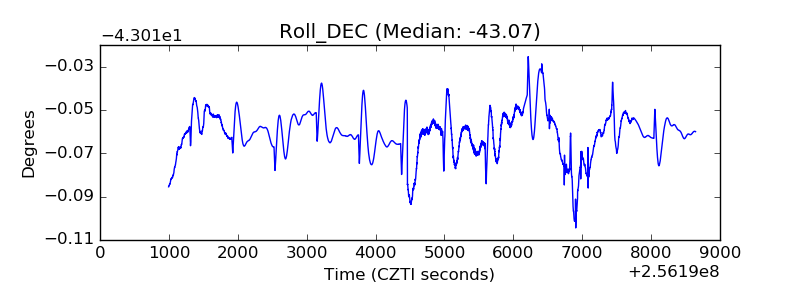 |
| _Roll_RA | 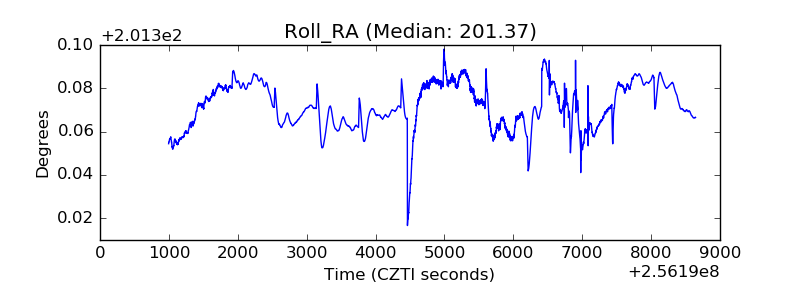 |
| Veto Counter | 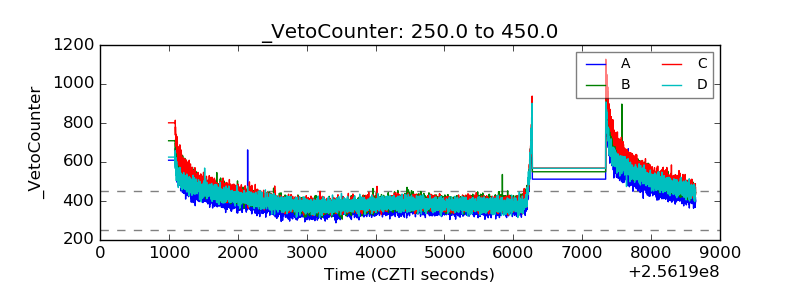 |