| Param | Original file | Final file |
|---|---|---|
| Filename | modeM0/AS1A04_048T01_9000001890_12865cztM0_level2.evt | modeM0/AS1A04_048T01_9000001890_12865cztM0_level2_quad_clean.evt |
| Size (bytes) | 480,450,240 | 83,784,960 |
| Size | 458.2 MB | 79.9 MB |
| Events in quadrant A | 3,026,555 | 544,417 |
| Events in quadrant B | 5,037,316 | 508,089 |
| Events in quadrant C | 2,906,995 | 549,241 |
| Events in quadrant D | 3,176,345 | 520,474 |
| Mode M9 | |||
|---|---|---|---|
| Quadrant | BADHDUFLAG | Total packets | Discarded packets |
| A | 0 | 12 | 0 |
| B | 0 | 12 | 0 |
| C | 0 | 12 | 0 |
| D | 0 | 12 | 0 |
| Mode SS | |||
|---|---|---|---|
| Quadrant | BADHDUFLAG | Total packets | Discarded packets |
| A | 0 | 120 | 0 |
| B | 0 | 120 | 0 |
| C | 0 | 120 | 0 |
| D | 0 | 120 | 0 |
| Mode M0 | |||
|---|---|---|---|
| Quadrant | BADHDUFLAG | Total packets | Discarded packets |
| A | 0 | 12620 | 2 |
| B | 0 | 18842 | 1 |
| C | 0 | 12409 | 1 |
| D | 0 | 13256 | 1 |
| Quadrant | Total seconds | Saturated seconds | Saturation percentage |
|---|---|---|---|
| A | 5939 | 74 | 1.246001% |
| B | 5939 | 816 | 13.739687% |
| C | 5939 | 57 | 0.959758% |
| D | 5939 | 103 | 1.734299% |
Noise dominated data is calculated using 1-second bins in cleaned event files. If a bin has >2000 counts, and if more than 50% of those come from <1% of pixels, then it is considered to be noise-dominated and hence unusable.
| Quadrant | # 1 sec bins | Bins with >0 counts | Bins with >2000 counts | High rate bins dominated by noise | Noise dominated (total time) | Noise dominated (detector-on time) | Marked lightcurve |
|---|---|---|---|---|---|---|---|
| A | 7105 | 5941 | 1 | 1 | 0.01% | 0.02% | 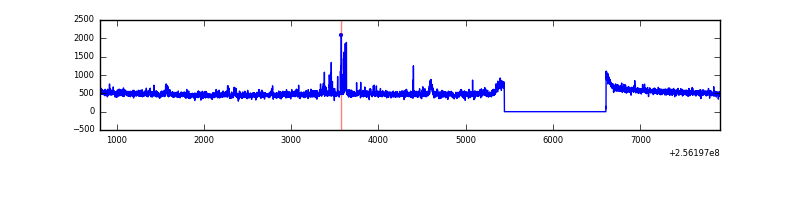 |
| B | 7105 | 5941 | 486 | 486 | 6.84% | 8.18% | 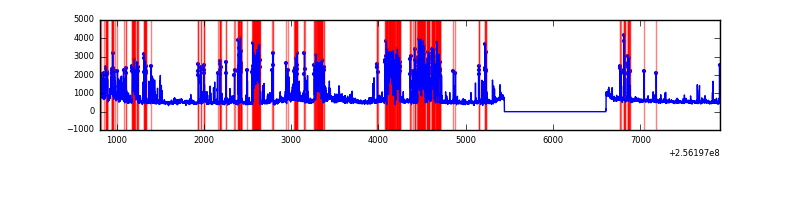 |
| C | 7105 | 5941 | 0 | 0 | 0.00% | 0.00% |  |
| D | 7105 | 5941 | 40 | 40 | 0.56% | 0.67% | 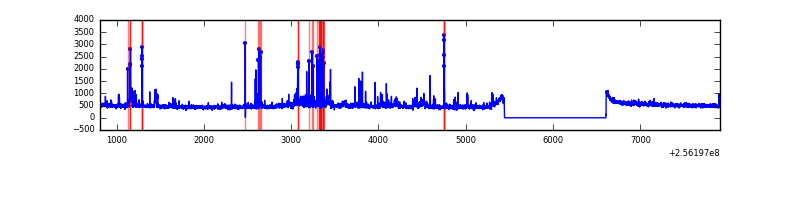 |
Top three noisy pixels from each quadrant. If the there are fewer than three noisy pixels in the level2.evt file, extra rows are filled as -1
| Pixel properties | Quadrant properties | ||||||
|---|---|---|---|---|---|---|---|
| Quadrant | DetID | PixID | Counts | Sigma | Mean | Median | Sigma |
| A | 12 | 189 | 70656 | 456.75 | 757 | 742 | 153.1 |
| A | 15 | 174 | 39252 | 251.59 | 757 | 742 | 153.1 |
| A | 8 | 15 | 7366 | 43.27 | 757 | 742 | 153.1 |
| B | 4 | 239 | 1264191 | 9576.43 | 696 | 679 | 131.9 |
| B | 0 | 85 | 442762 | 3350.64 | 696 | 679 | 131.9 |
| B | 3 | 64 | 257826 | 1948.97 | 696 | 679 | 131.9 |
| C | 13 | 61 | 5341 | 26.61 | 745 | 749 | 172.5 |
| C | 3 | 202 | 1874 | 6.52 | 745 | 749 | 172.5 |
| C | 14 | 234 | 1728 | 5.67 | 745 | 749 | 172.5 |
| D | 1 | 52 | 334318 | 1910.53 | 737 | 717 | 174.6 |
| D | 2 | 234 | 22562 | 125.11 | 737 | 717 | 174.6 |
| D | 8 | 195 | 16956 | 93.0 | 737 | 717 | 174.6 |
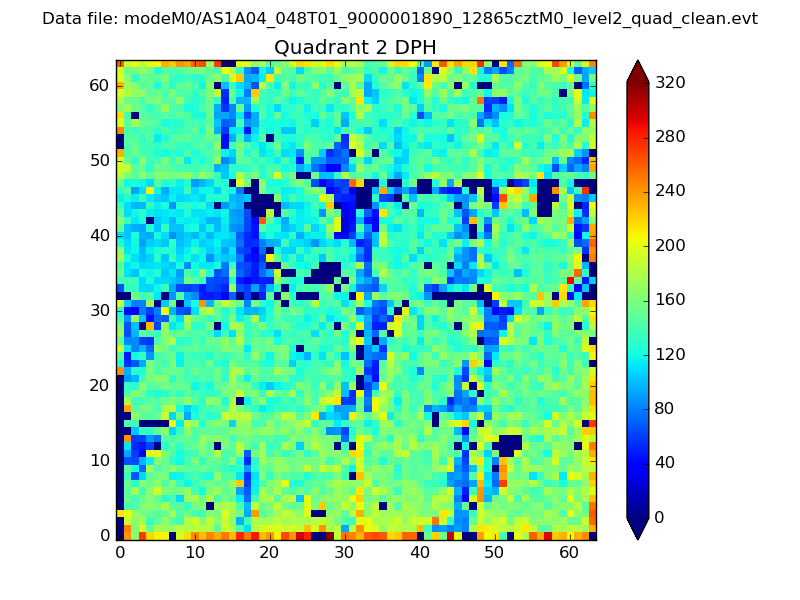
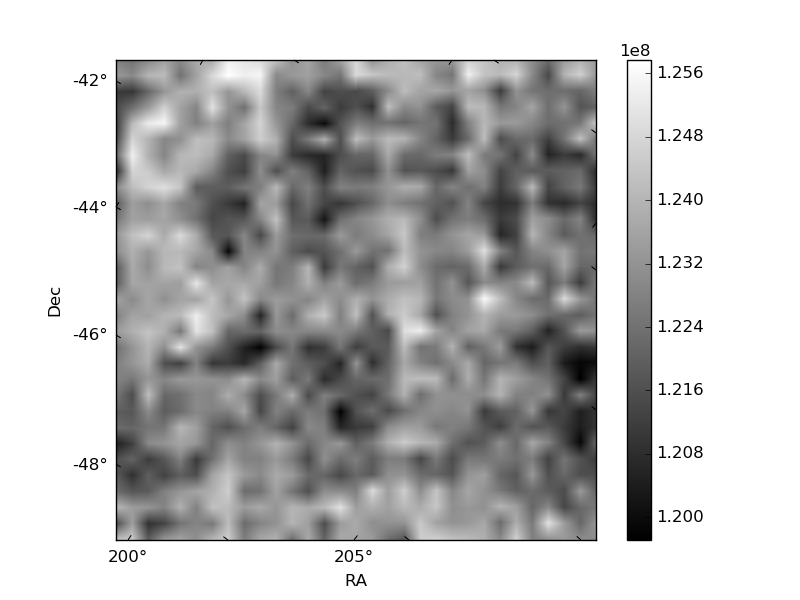
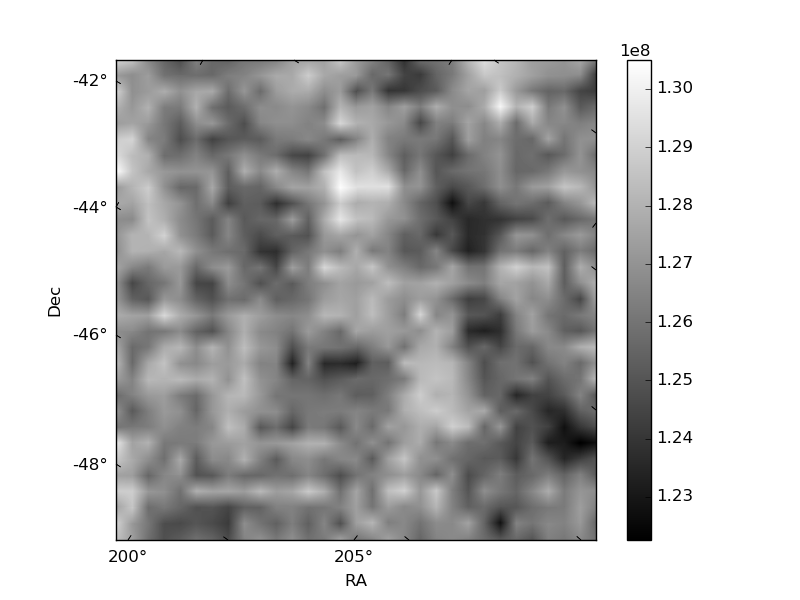
Histogram calculated using DETX and DETY for each event in the final _common_clean file
| Quadrant A | 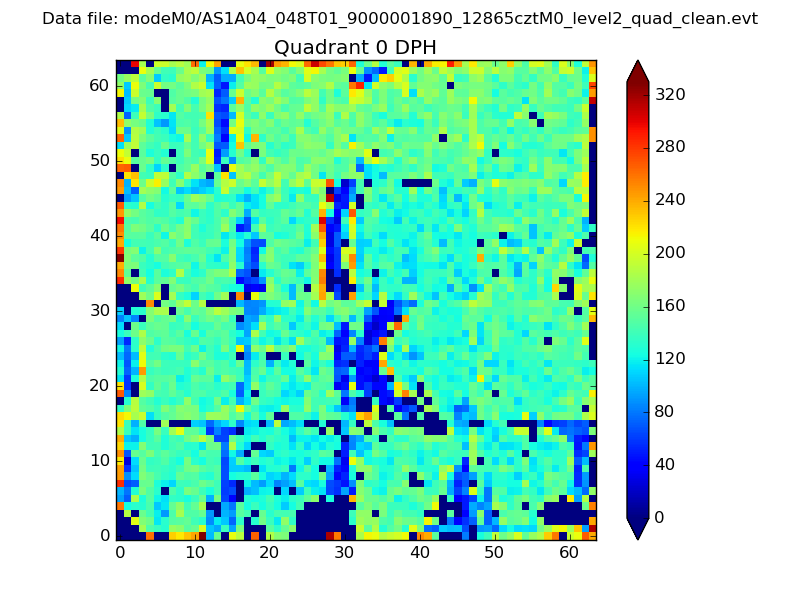 |
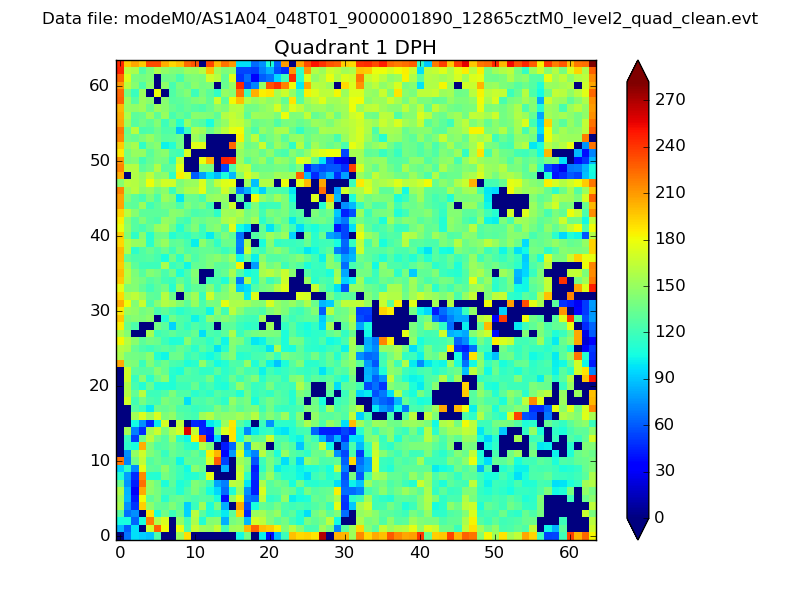 |
Quadrant B |
|---|---|---|---|
| Quadrant D | 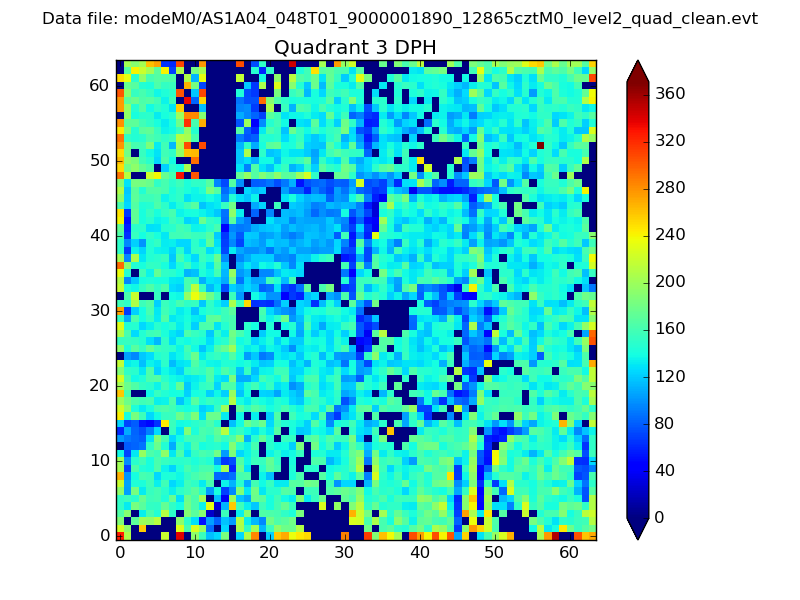 |
 |
Quadrant C |
| Plot type | Count rate plots | Images |
|---|---|---|
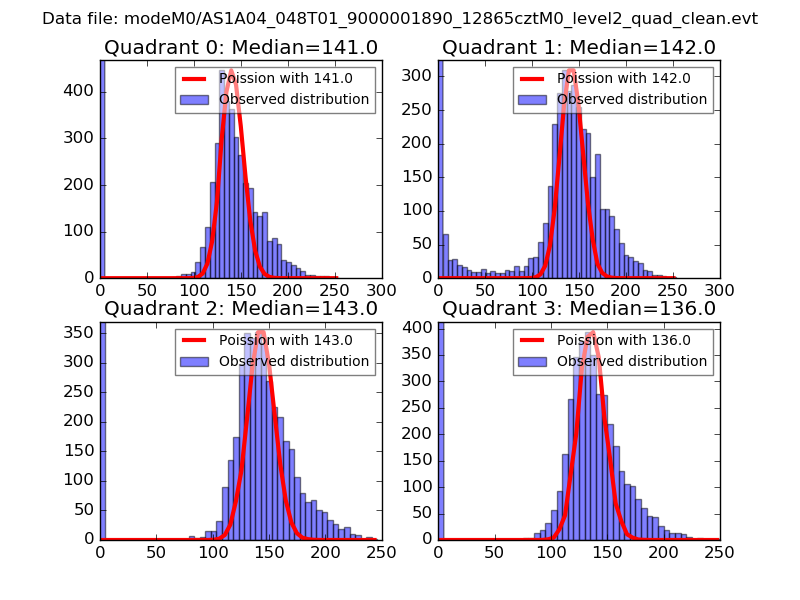
| Comparison with Poisson distribution Blue bars denote a histogram of data divided into 1 sec bins. Red curve is a Poisson curve with rate = median count rate of data. |
 |
 |
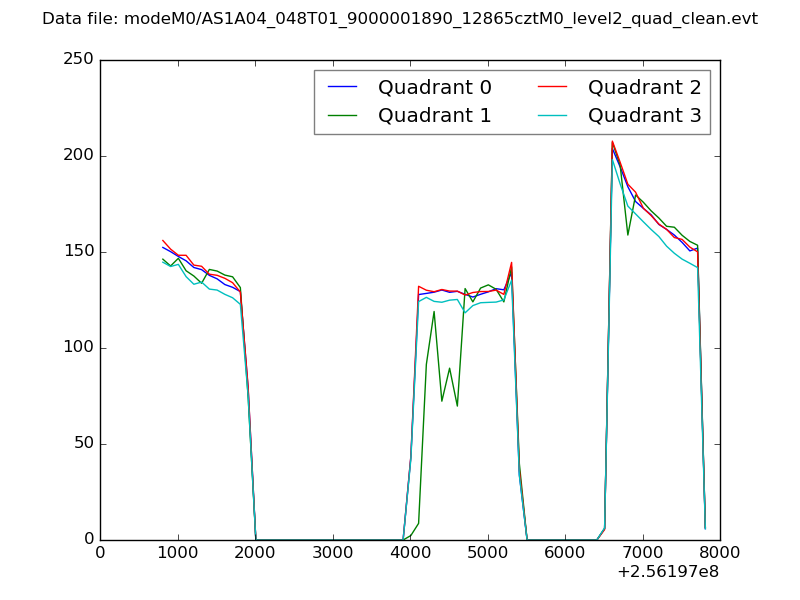
| Quadrant-wise count rates Data is divided into 100 sec bins |
 |
|
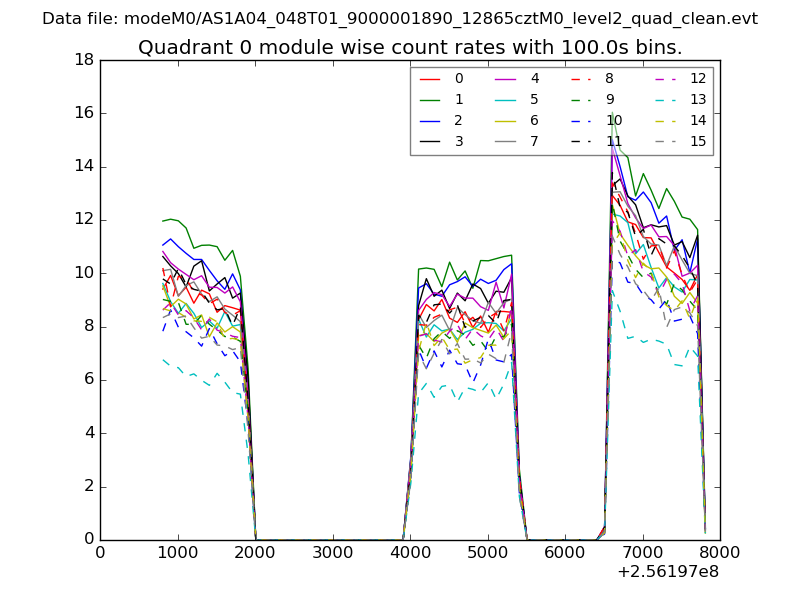
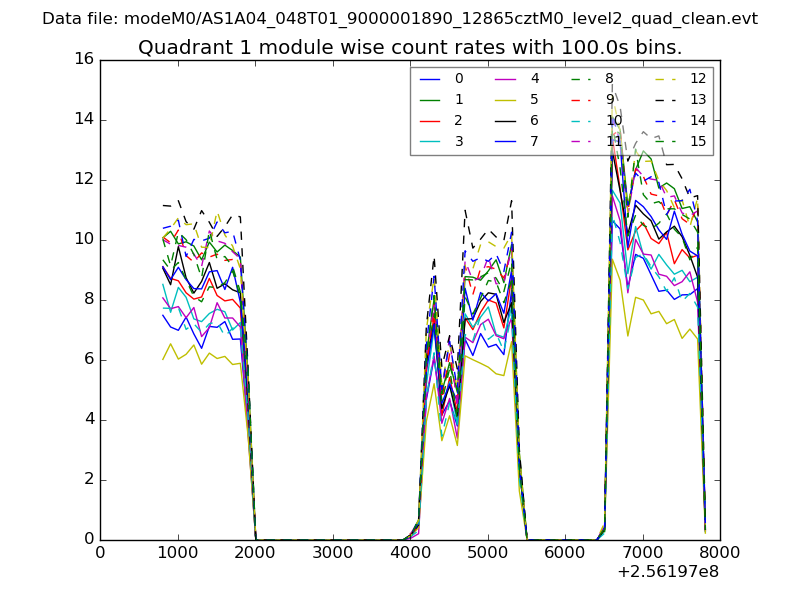
| Module-wise count rates for Quadrant A Data is divided into 100 sec bins |
 |
 |
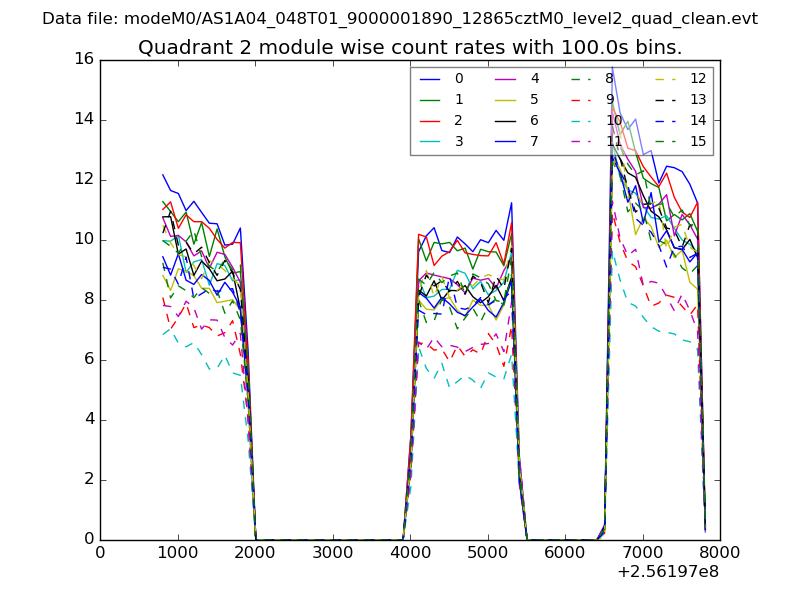
| Module-wise count rates for Quadrant B Data is divided into 100 sec bins |
 |
 |
| Module-wise count rates for Quadrant C Data is divided into 100 sec bins |
 |
 |
| Module-wise count rates for Quadrant D Data is divided into 100 sec bins |
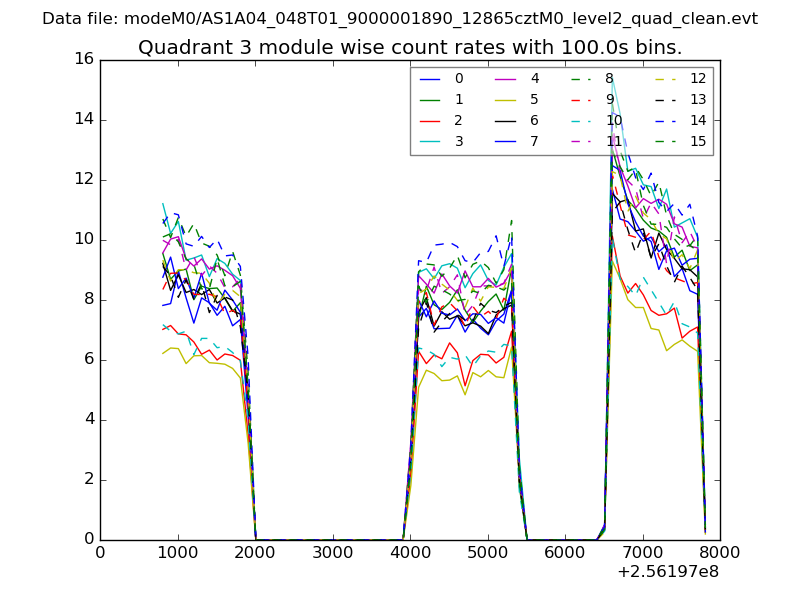 |
 |
| Parameter | Plot |
|---|---|
| CZT HV Monitor | 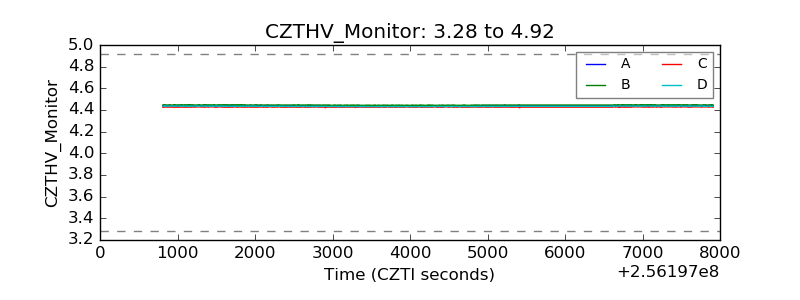 |
| D_VDD |  |
| Temperature 1 | 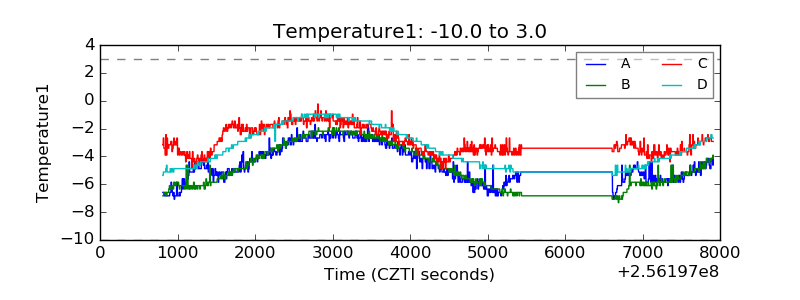 |
| Veto HV Monitor | 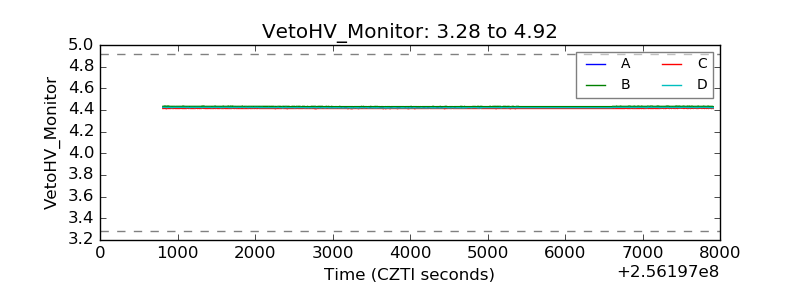 |
| Veto LLD | 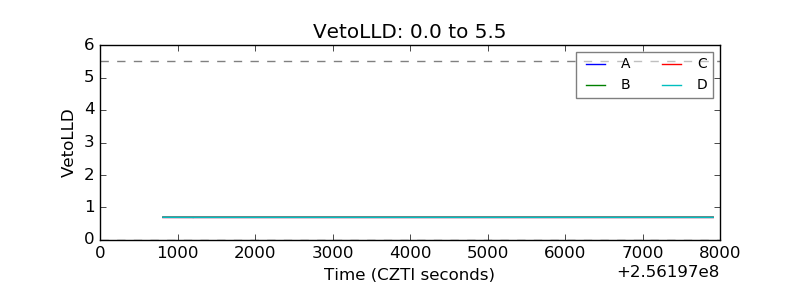 |
| Alpha Counter | 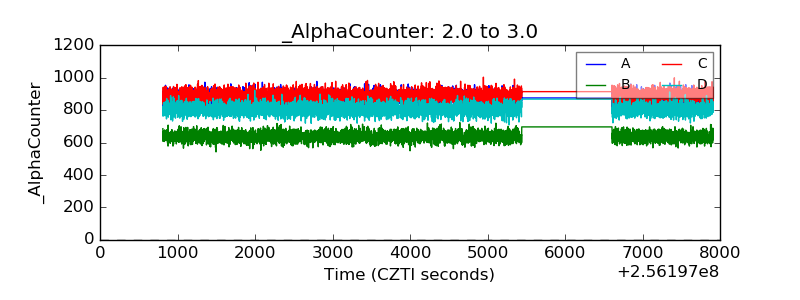 |
| _CPM_Rate | 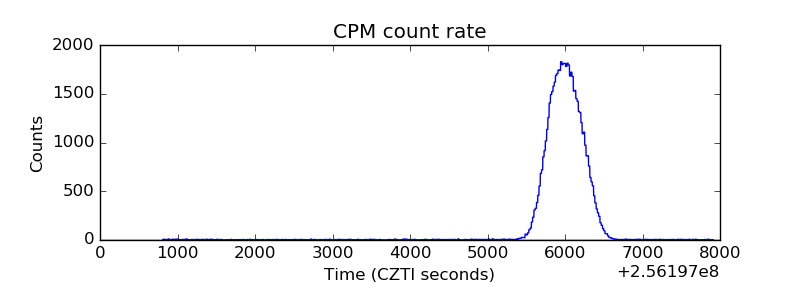 |
| CZT Counter | 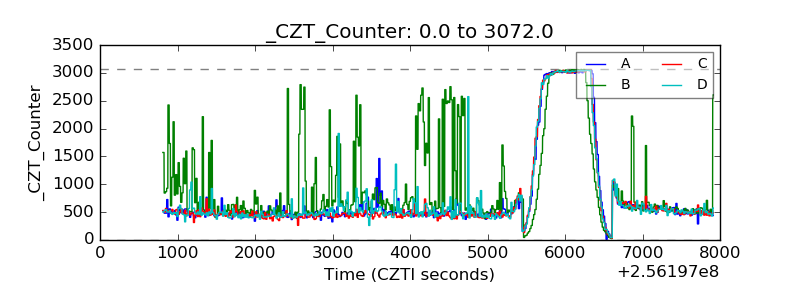 |
| +2.5 Volts monitor |  |
| +5 Volts monitor |  |
| _ROLL_ROT | 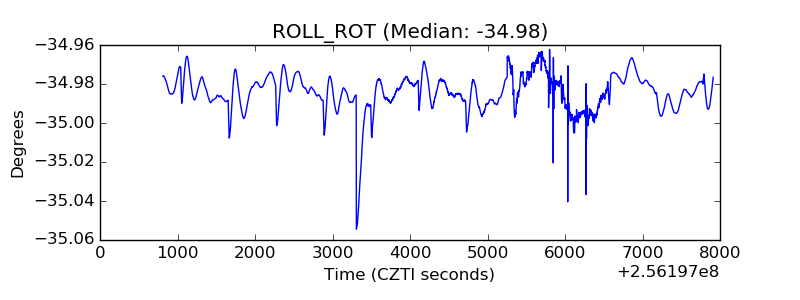 |
| _Roll_DEC | 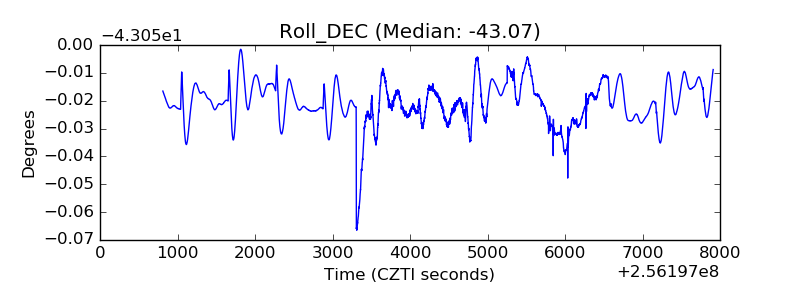 |
| _Roll_RA | 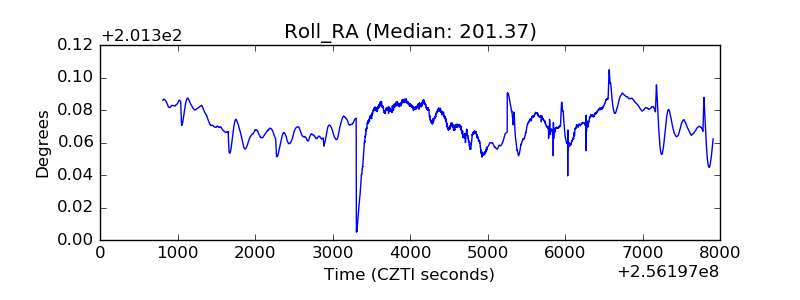 |
| Veto Counter | 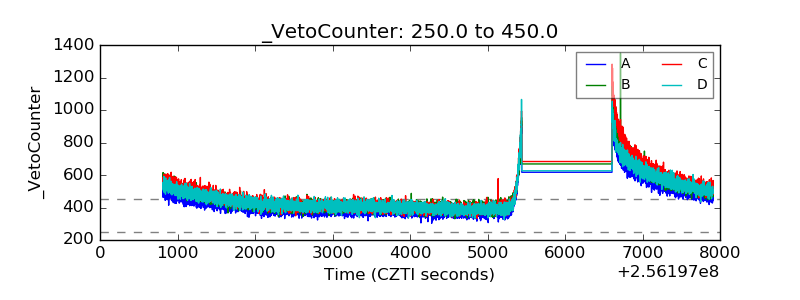 |