| Param | Original file | Final file |
|---|---|---|
| Filename | modeM0/AS1A04_048T01_9000001890_12867cztM0_level2.evt | modeM0/AS1A04_048T01_9000001890_12867cztM0_level2_quad_clean.evt |
| Size (bytes) | 522,207,360 | 78,716,160 |
| Size | 498.0 MB | 75.1 MB |
| Events in quadrant A | 3,366,799 | 505,930 |
| Events in quadrant B | 5,229,745 | 468,604 |
| Events in quadrant C | 3,205,978 | 502,228 |
| Events in quadrant D | 3,594,741 | 476,647 |
| Mode M9 | |||
|---|---|---|---|
| Quadrant | BADHDUFLAG | Total packets | Discarded packets |
| A | 0 | 14 | 0 |
| B | 0 | 14 | 0 |
| C | 0 | 14 | 0 |
| D | 0 | 15 | 0 |
| Mode SS | |||
|---|---|---|---|
| Quadrant | BADHDUFLAG | Total packets | Discarded packets |
| A | 0 | 126 | 0 |
| B | 0 | 126 | 0 |
| C | 0 | 126 | 0 |
| D | 0 | 126 | 0 |
| Mode M0 | |||
|---|---|---|---|
| Quadrant | BADHDUFLAG | Total packets | Discarded packets |
| A | 0 | 13850 | 3 |
| B | 0 | 19613 | 2 |
| C | 0 | 13321 | 2 |
| D | 0 | 14688 | 2 |
| Quadrant | Total seconds | Saturated seconds | Saturation percentage |
|---|---|---|---|
| A | 6156 | 110 | 1.786875% |
| B | 6156 | 872 | 14.165042% |
| C | 6156 | 90 | 1.461988% |
| D | 6156 | 127 | 2.063028% |
Noise dominated data is calculated using 1-second bins in cleaned event files. If a bin has >2000 counts, and if more than 50% of those come from <1% of pixels, then it is considered to be noise-dominated and hence unusable.
| Quadrant | # 1 sec bins | Bins with >0 counts | Bins with >2000 counts | High rate bins dominated by noise | Noise dominated (total time) | Noise dominated (detector-on time) | Marked lightcurve |
|---|---|---|---|---|---|---|---|
| A | 7472 | 6158 | 1 | 1 | 0.01% | 0.02% | 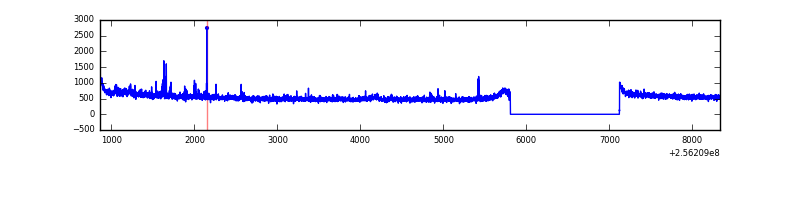 |
| B | 7472 | 6158 | 564 | 564 | 7.55% | 9.16% | 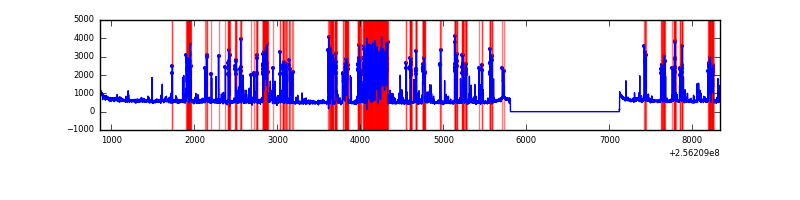 |
| C | 7472 | 6158 | 2 | 2 | 0.03% | 0.03% | 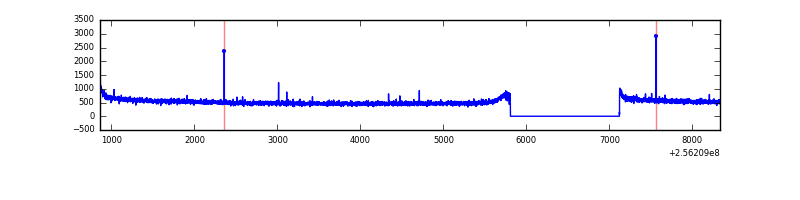 |
| D | 7472 | 6158 | 36 | 36 | 0.48% | 0.58% | 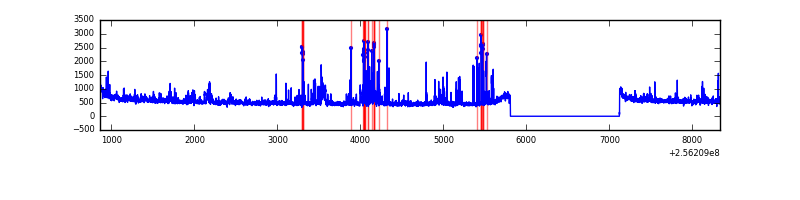 |
Top three noisy pixels from each quadrant. If the there are fewer than three noisy pixels in the level2.evt file, extra rows are filled as -1
| Pixel properties | Quadrant properties | ||||||
|---|---|---|---|---|---|---|---|
| Quadrant | DetID | PixID | Counts | Sigma | Mean | Median | Sigma |
| A | 12 | 189 | 50725 | 297.48 | 847 | 833 | 167.7 |
| A | 8 | 15 | 26203 | 151.27 | 847 | 833 | 167.7 |
| A | 9 | 143 | 21239 | 121.67 | 847 | 833 | 167.7 |
| B | 4 | 239 | 1701165 | 11834.66 | 778 | 762 | 143.7 |
| B | 3 | 64 | 218940 | 1518.5 | 778 | 762 | 143.7 |
| B | 0 | 85 | 160689 | 1113.08 | 778 | 762 | 143.7 |
| C | 14 | 234 | 10399 | 51.71 | 819 | 824 | 185.1 |
| C | 13 | 61 | 5834 | 27.06 | 819 | 824 | 185.1 |
| C | 3 | 202 | 2015 | 6.43 | 819 | 824 | 185.1 |
| D | 1 | 52 | 455908 | 2352.67 | 819 | 799 | 193.4 |
| D | 2 | 234 | 24676 | 123.43 | 819 | 799 | 193.4 |
| D | 2 | 136 | 14646 | 71.58 | 819 | 799 | 193.4 |
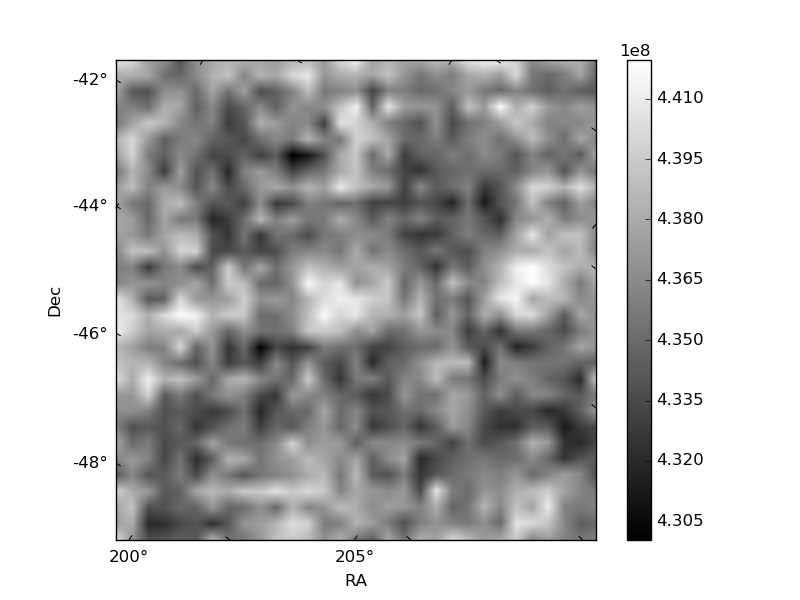
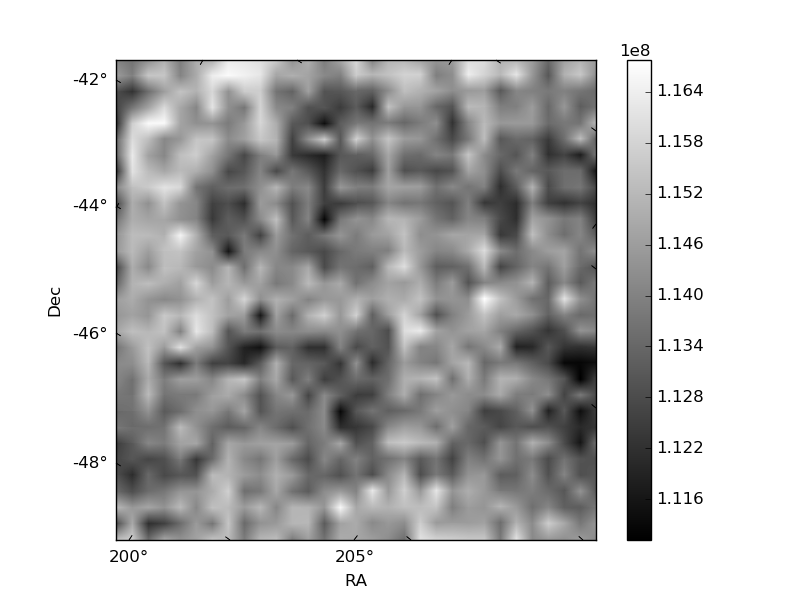
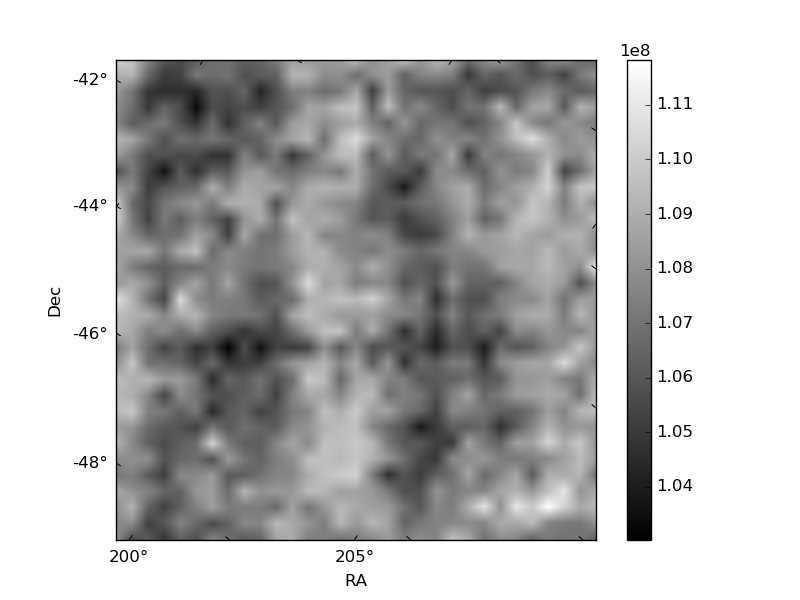
Histogram calculated using DETX and DETY for each event in the final _common_clean file
| Quadrant A | 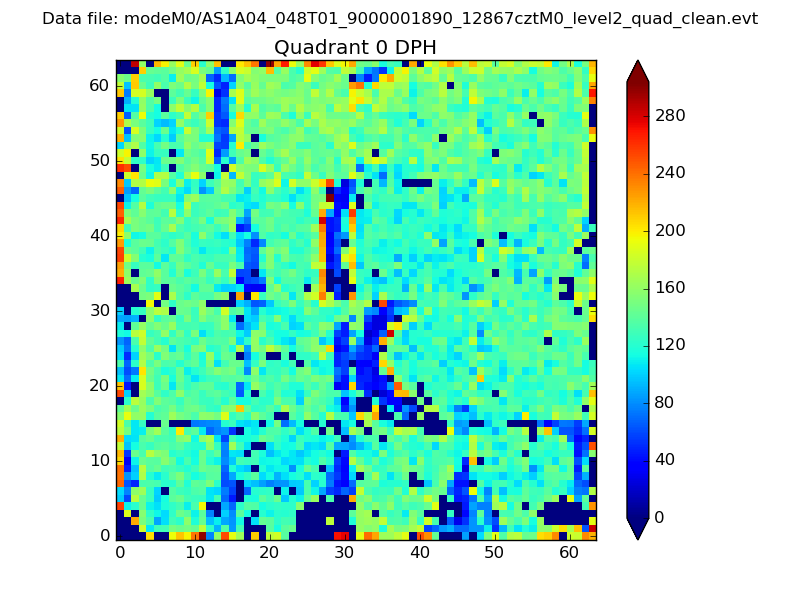 |
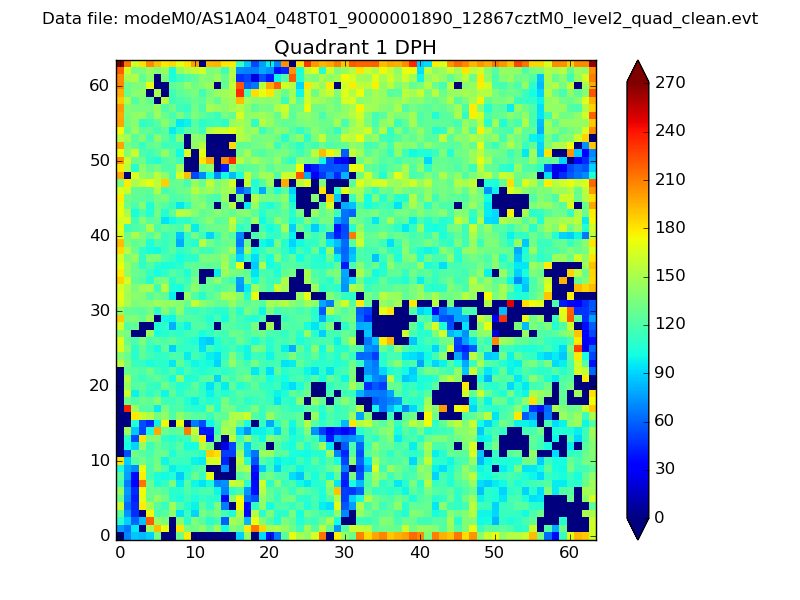 |
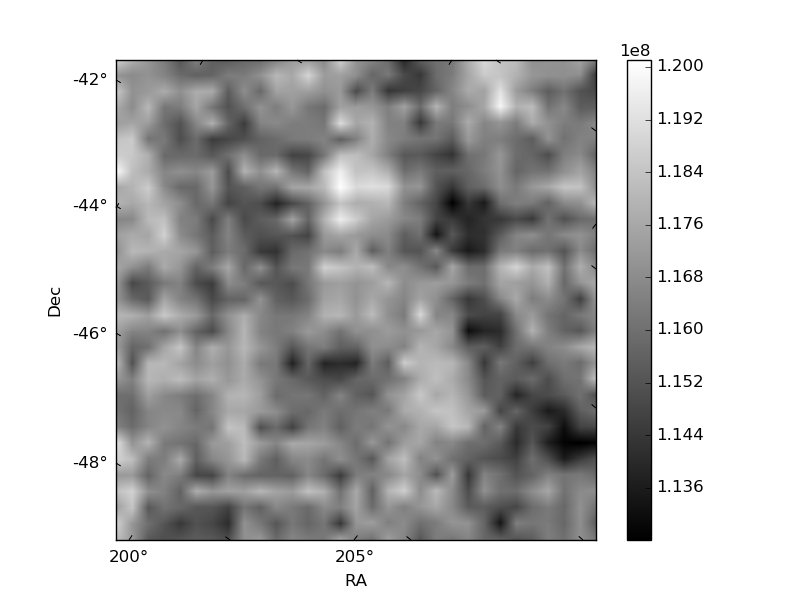
Quadrant B |
|---|---|---|---|
| Quadrant D | 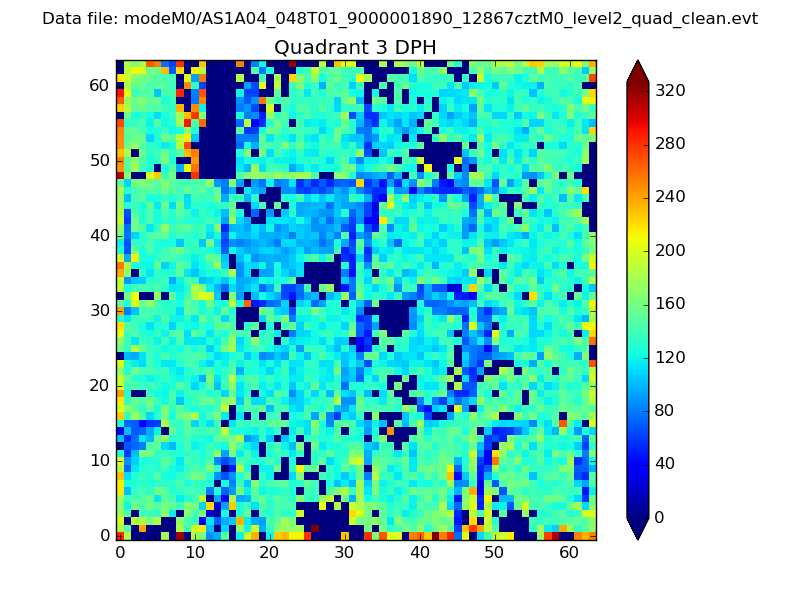 |
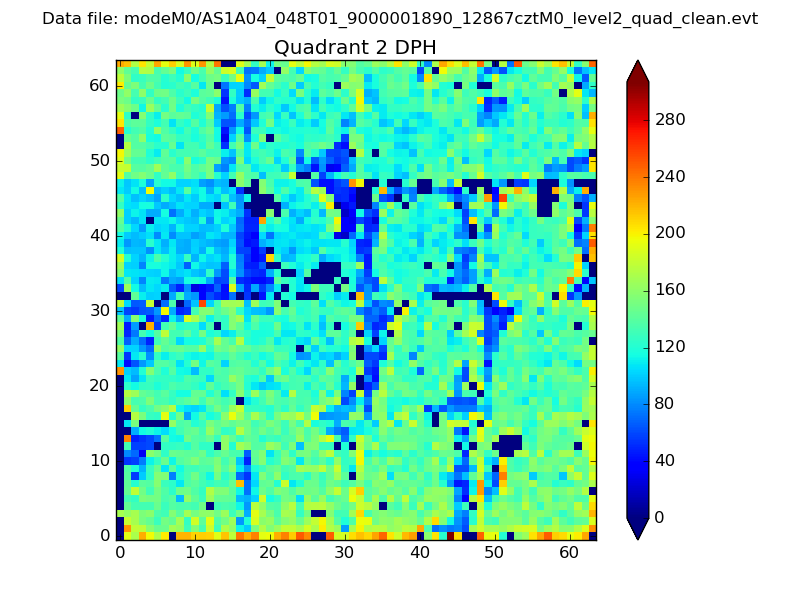 |
Quadrant C |
| Plot type | Count rate plots | Images |
|---|---|---|
| Comparison with Poisson distribution Blue bars denote a histogram of data divided into 1 sec bins. Red curve is a Poisson curve with rate = median count rate of data. |
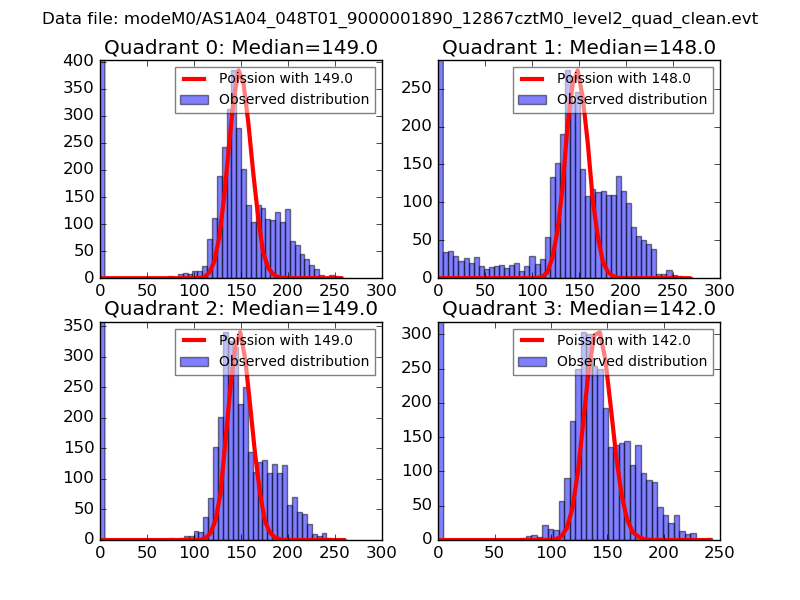 |
 |
| Quadrant-wise count rates Data is divided into 100 sec bins |
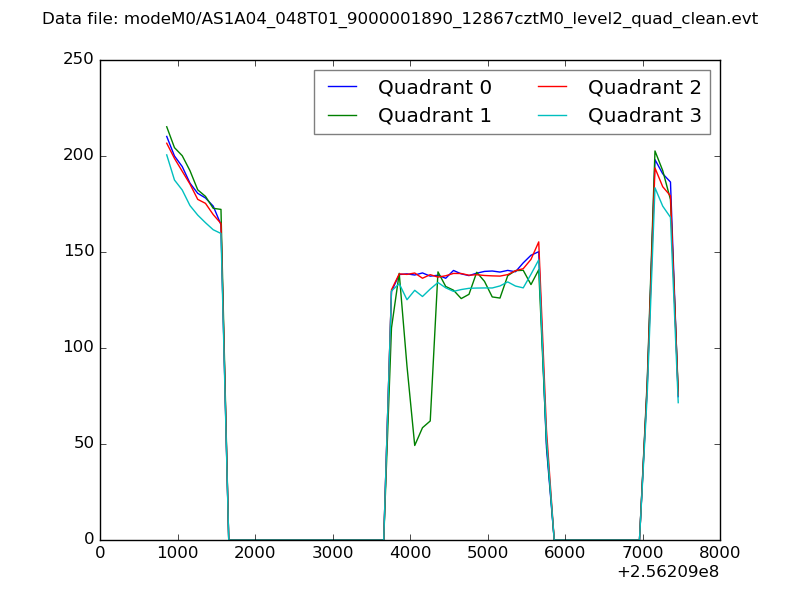 |
|
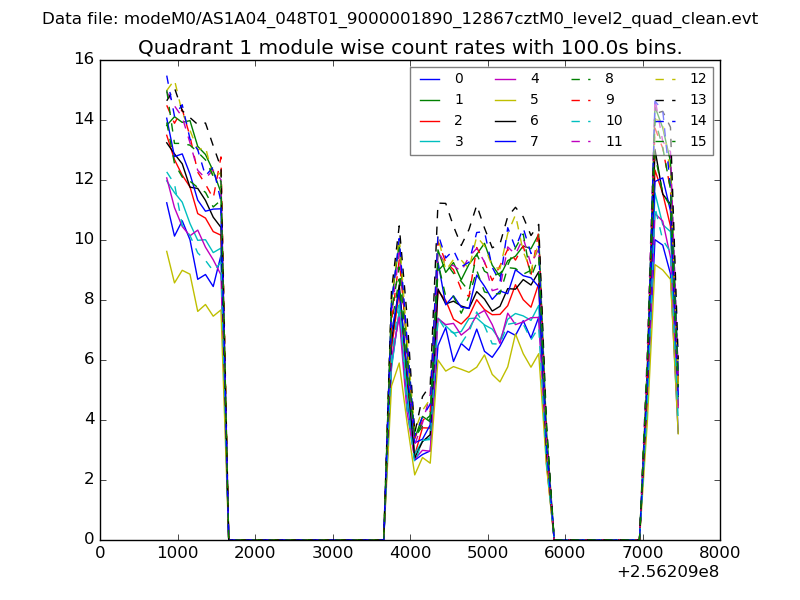
| Module-wise count rates for Quadrant A Data is divided into 100 sec bins |
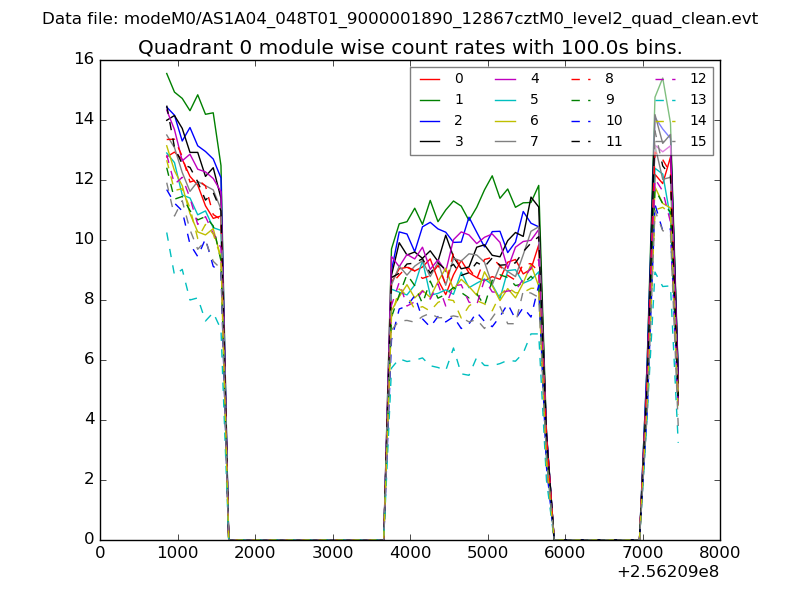 |
 |
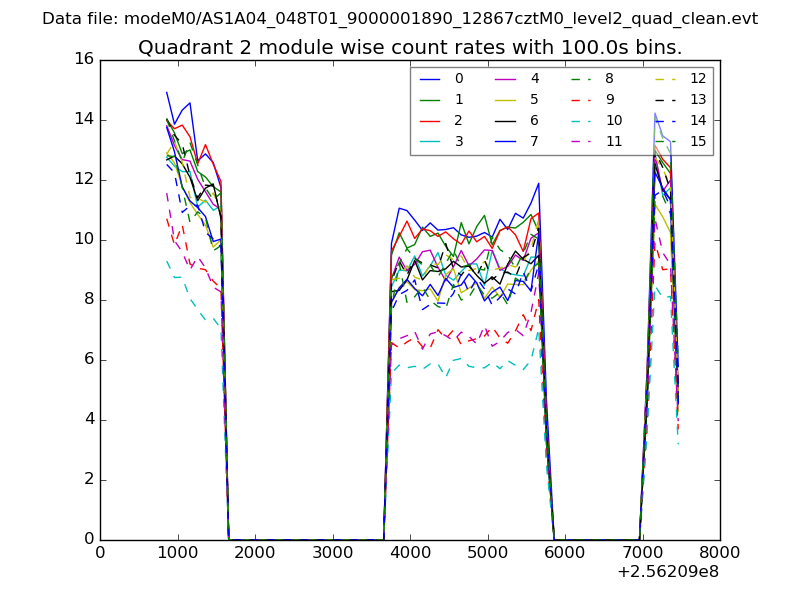
| Module-wise count rates for Quadrant B Data is divided into 100 sec bins |
 |
 |
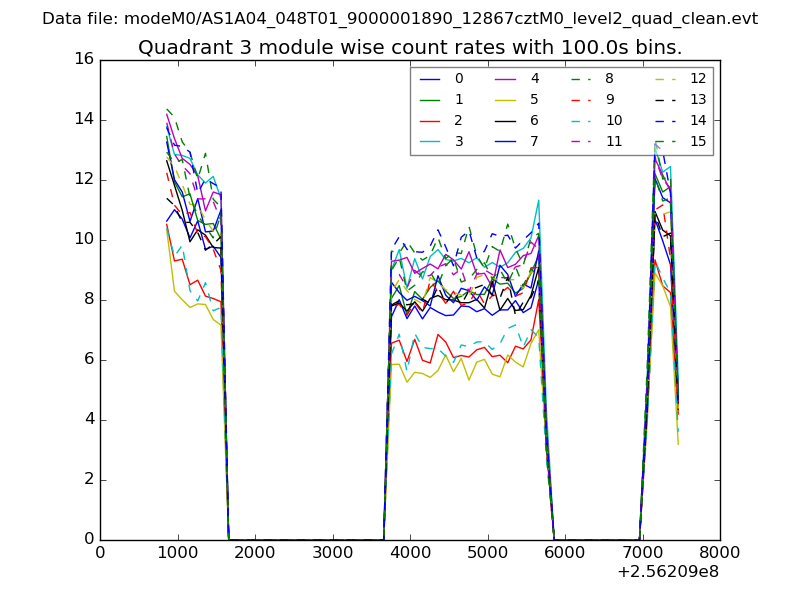
| Module-wise count rates for Quadrant C Data is divided into 100 sec bins |
 |
 |
| Module-wise count rates for Quadrant D Data is divided into 100 sec bins |
 |
 |
| Parameter | Plot |
|---|---|
| CZT HV Monitor | 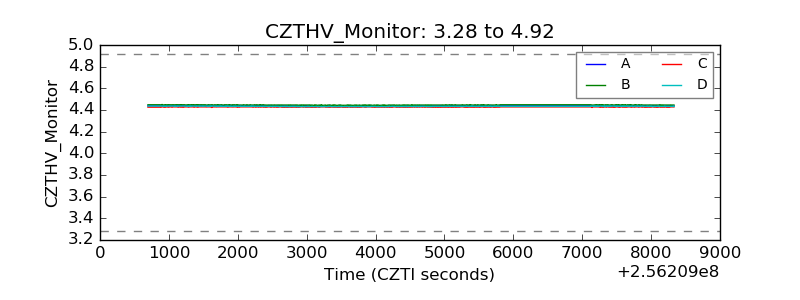 |
| D_VDD | 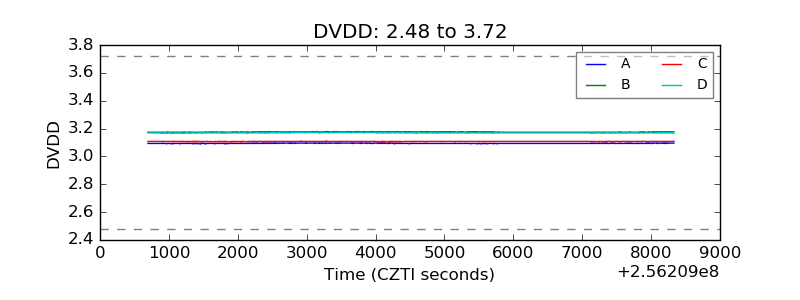 |
| Temperature 1 | 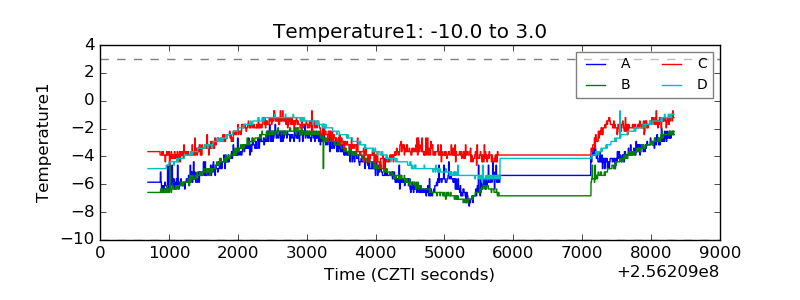 |
| Veto HV Monitor | 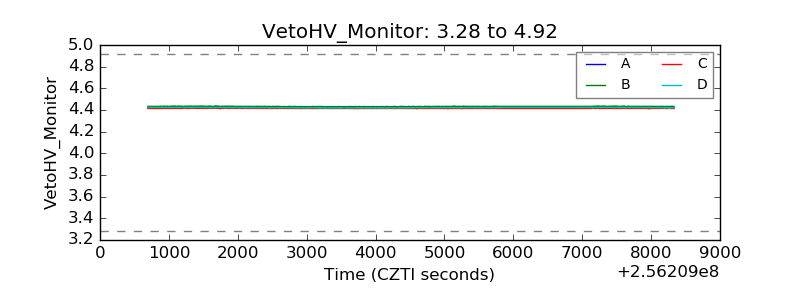 |
| Veto LLD | 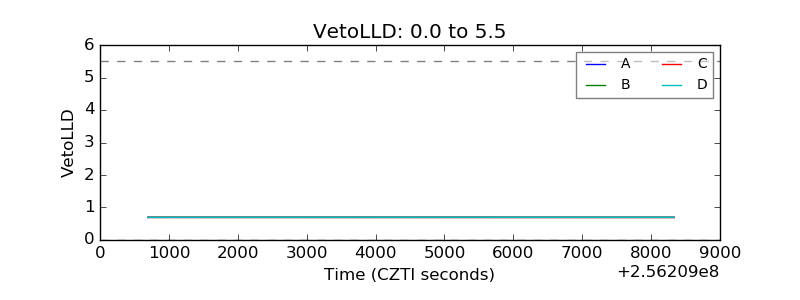 |
| Alpha Counter | 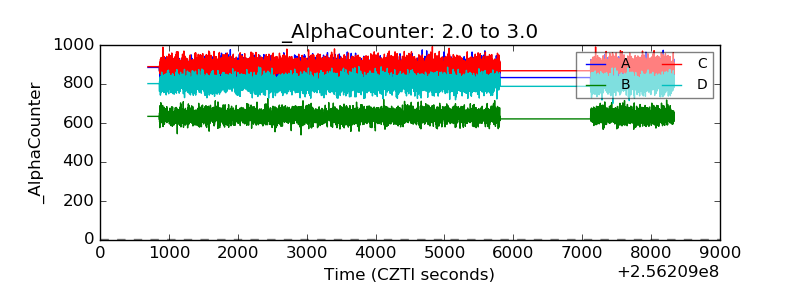 |
| _CPM_Rate | 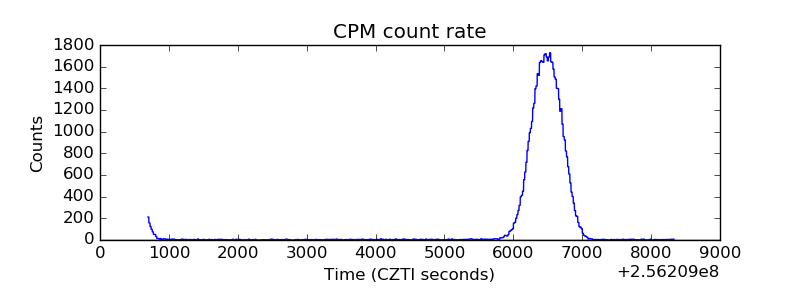 |
| CZT Counter | 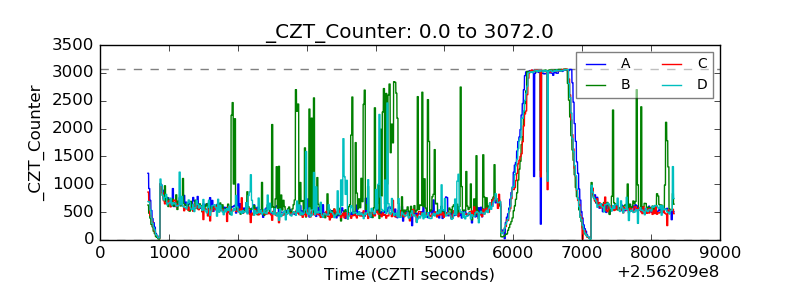 |
| +2.5 Volts monitor |  |
| +5 Volts monitor |  |
| _ROLL_ROT | 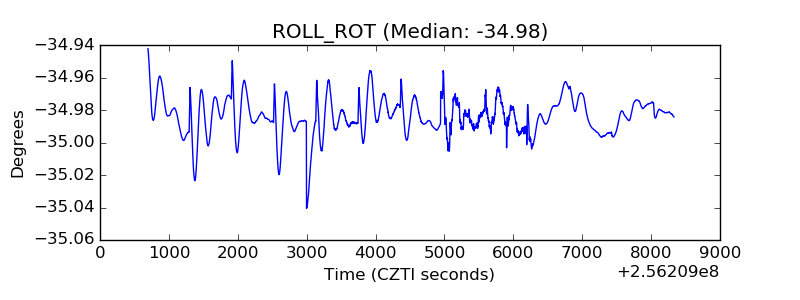 |
| _Roll_DEC | 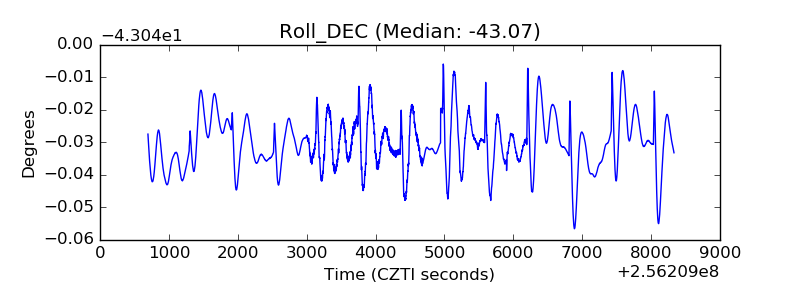 |
| _Roll_RA | 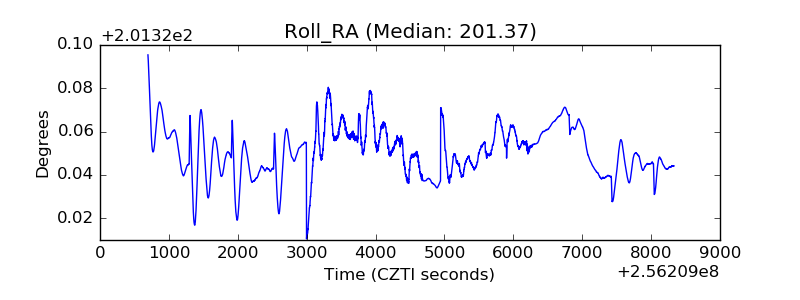 |
| Veto Counter | 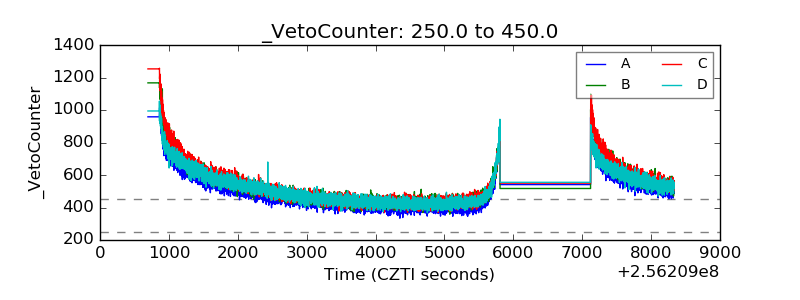 |