| Param | Original file | Final file |
|---|---|---|
| Filename | modeM0/AS1A04_048T01_9000001890_12868cztM0_level2.evt | modeM0/AS1A04_048T01_9000001890_12868cztM0_level2_quad_clean.evt |
| Size (bytes) | 250,824,960 | 21,271,680 |
| Size | 239.2 MB | 20.3 MB |
| Events in quadrant A | 1,510,049 | 117,979 |
| Events in quadrant B | 2,341,926 | 105,659 |
| Events in quadrant C | 1,444,181 | 115,420 |
| Events in quadrant D | 2,107,479 | 103,400 |
| Mode M9 | |||
|---|---|---|---|
| Quadrant | BADHDUFLAG | Total packets | Discarded packets |
| A | 0 | 1 | 0 |
| B | 0 | 1 | 0 |
| C | 0 | 1 | 0 |
| D | 0 | 2 | 0 |
| Mode SS | |||
|---|---|---|---|
| Quadrant | BADHDUFLAG | Total packets | Discarded packets |
| A | 0 | 56 | 0 |
| B | 0 | 56 | 0 |
| C | 0 | 56 | 0 |
| D | 0 | 56 | 0 |
| Mode M0 | |||
|---|---|---|---|
| Quadrant | BADHDUFLAG | Total packets | Discarded packets |
| A | 0 | 6158 | 1 |
| B | 0 | 8904 | 1 |
| C | 0 | 5986 | 1 |
| D | 0 | 8061 | 1 |
| Quadrant | Total seconds | Saturated seconds | Saturation percentage |
|---|---|---|---|
| A | 2812 | 5 | 0.177809% |
| B | 2812 | 305 | 10.846373% |
| C | 2812 | 7 | 0.248933% |
| D | 2812 | 199 | 7.076814% |
Noise dominated data is calculated using 1-second bins in cleaned event files. If a bin has >2000 counts, and if more than 50% of those come from <1% of pixels, then it is considered to be noise-dominated and hence unusable.
| Quadrant | # 1 sec bins | Bins with >0 counts | Bins with >2000 counts | High rate bins dominated by noise | Noise dominated (total time) | Noise dominated (detector-on time) | Marked lightcurve |
|---|---|---|---|---|---|---|---|
| A | 2813 | 2813 | 0 | 0 | 0.00% | 0.00% |  |
| B | 2813 | 2813 | 191 | 191 | 6.79% | 6.79% | 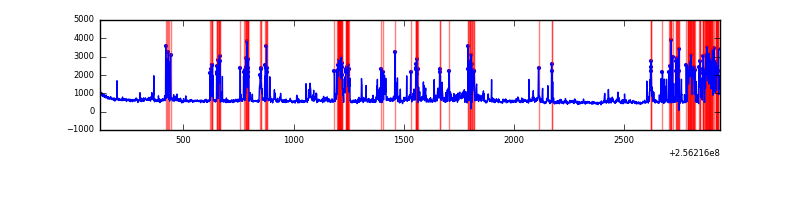 |
| C | 2813 | 2813 | 1 | 1 | 0.04% | 0.04% | 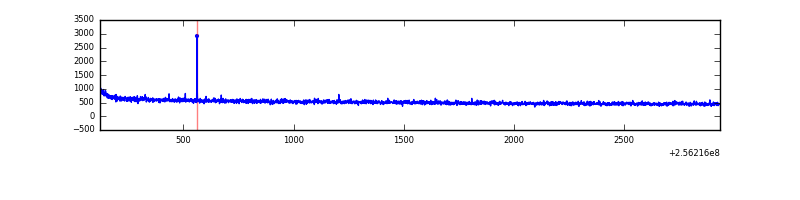 |
| D | 2813 | 2813 | 189 | 189 | 6.72% | 6.72% | 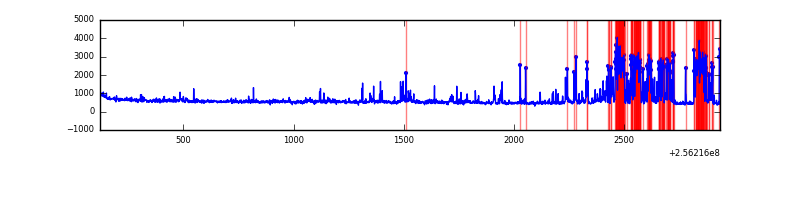 |
Top three noisy pixels from each quadrant. If the there are fewer than three noisy pixels in the level2.evt file, extra rows are filled as -1
| Pixel properties | Quadrant properties | ||||||
|---|---|---|---|---|---|---|---|
| Quadrant | DetID | PixID | Counts | Sigma | Mean | Median | Sigma |
| A | 15 | 174 | 10748 | 133.92 | 386 | 379 | 77.4 |
| A | 8 | 15 | 9007 | 111.43 | 386 | 379 | 77.4 |
| A | 0 | 226 | 3747 | 43.5 | 386 | 379 | 77.4 |
| B | 4 | 239 | 649529 | 9750.12 | 357 | 351 | 66.6 |
| B | 0 | 85 | 174445 | 2614.75 | 357 | 351 | 66.6 |
| B | 3 | 64 | 37637 | 560.01 | 357 | 351 | 66.6 |
| C | 14 | 234 | 5379 | 59.46 | 368 | 371 | 84.2 |
| C | 4 | 112 | 3765 | 40.3 | 368 | 371 | 84.2 |
| C | 13 | 61 | 2695 | 27.59 | 368 | 371 | 84.2 |
| D | 1 | 52 | 715424 | 8201.98 | 361 | 351 | 87.2 |
| D | 2 | 234 | 9026 | 99.5 | 361 | 351 | 87.2 |
| D | 13 | 122 | 7712 | 84.43 | 361 | 351 | 87.2 |
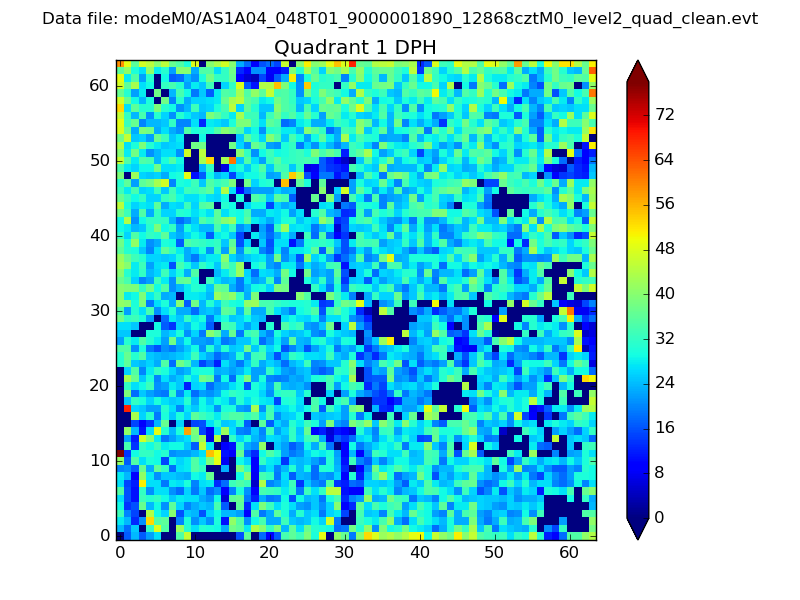
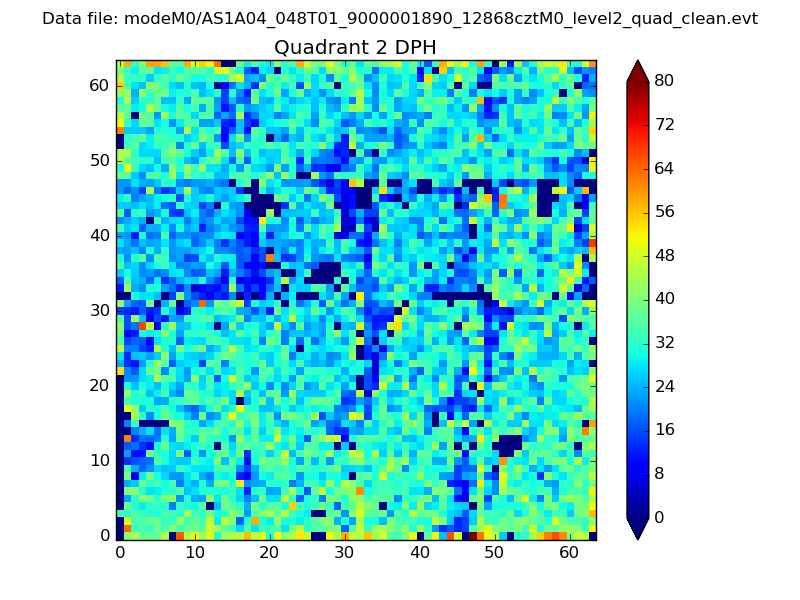
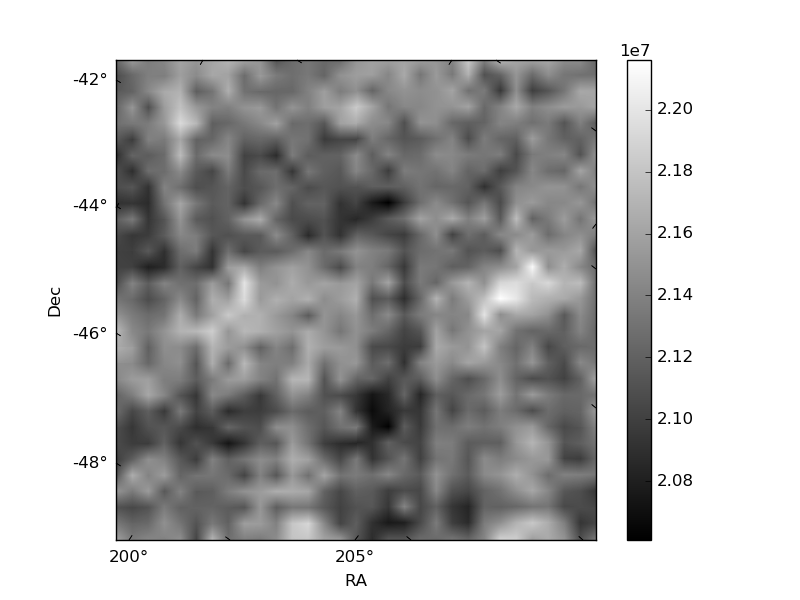
Histogram calculated using DETX and DETY for each event in the final _common_clean file
| Quadrant A | 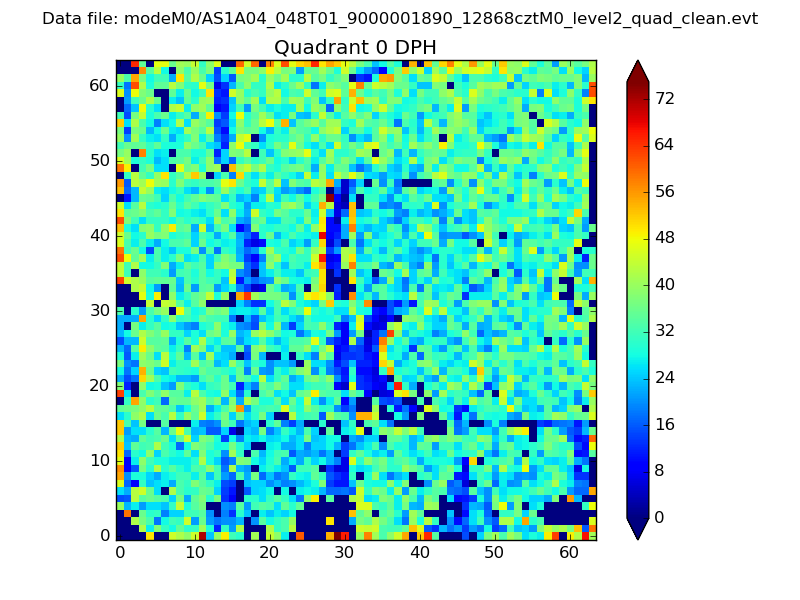 |
 |
Quadrant B |
|---|---|---|---|
| Quadrant D | 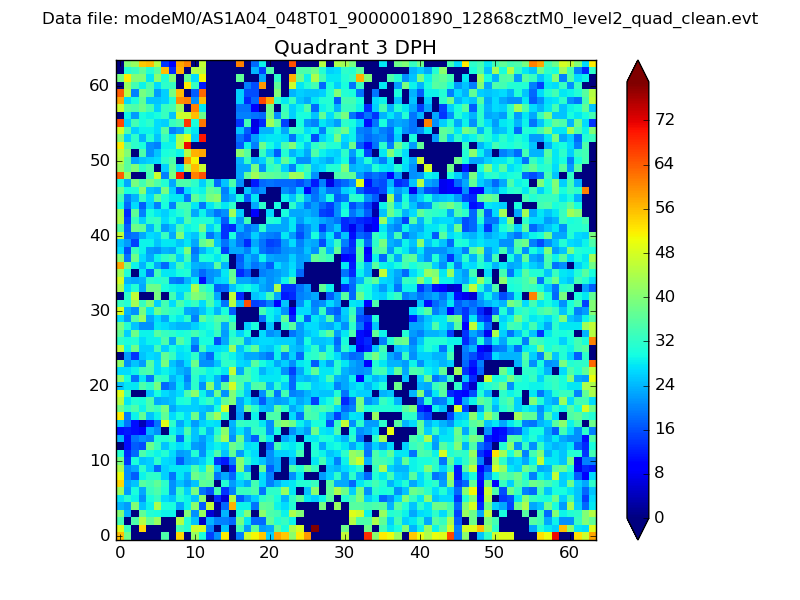 |
 |
Quadrant C |
| Plot type | Count rate plots | Images |
|---|---|---|
| Comparison with Poisson distribution Blue bars denote a histogram of data divided into 1 sec bins. Red curve is a Poisson curve with rate = median count rate of data. |
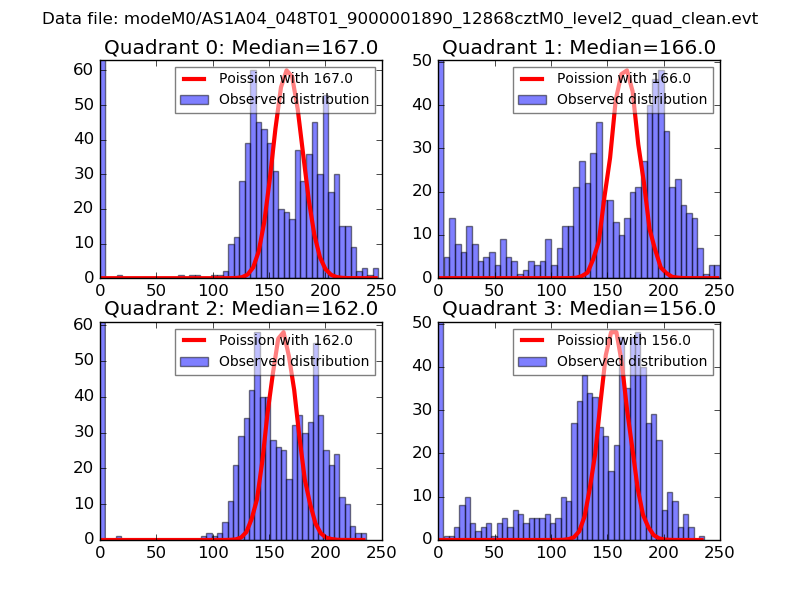 |
 |
| Quadrant-wise count rates Data is divided into 100 sec bins |
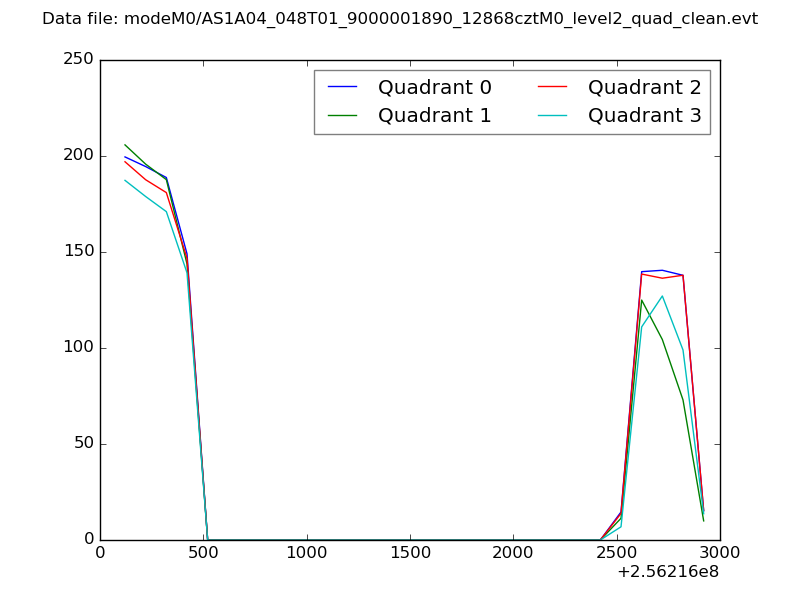 |
|
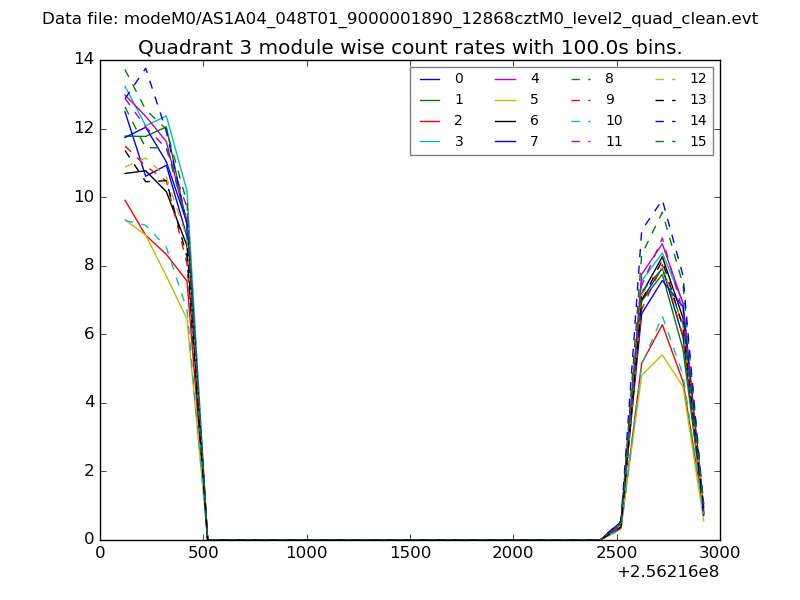
| Module-wise count rates for Quadrant A Data is divided into 100 sec bins |
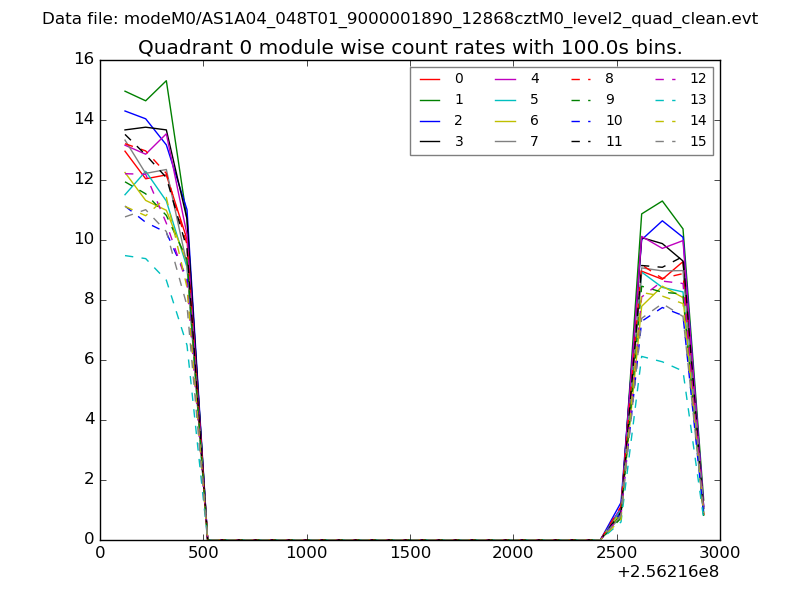 |
 |
| Module-wise count rates for Quadrant B Data is divided into 100 sec bins |
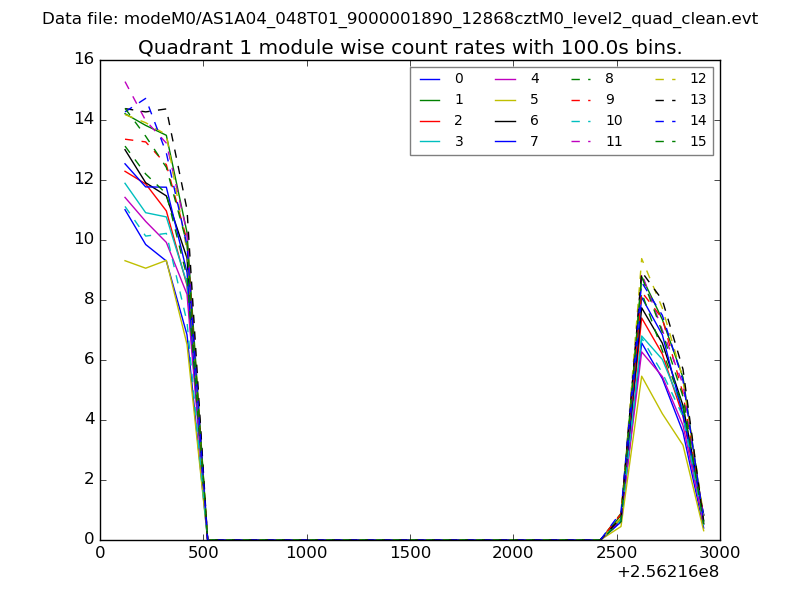 |
 |
| Module-wise count rates for Quadrant C Data is divided into 100 sec bins |
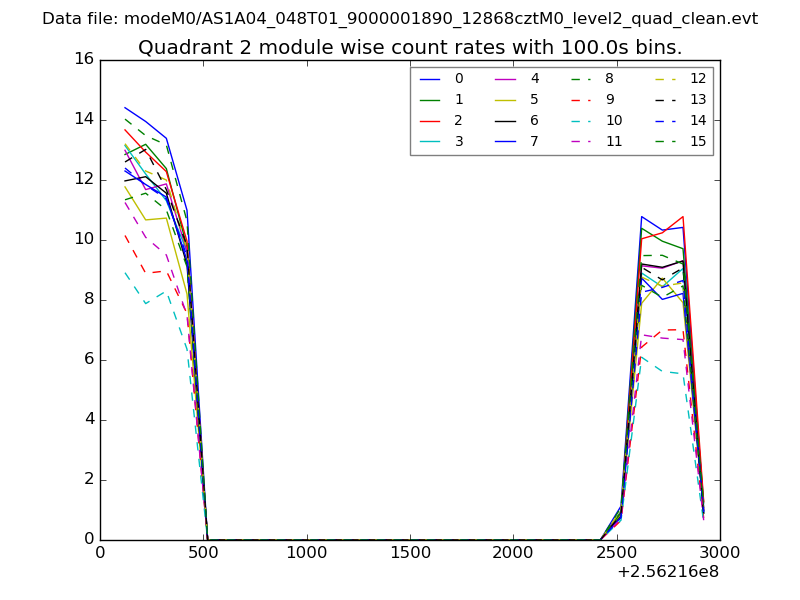 |
 |
| Module-wise count rates for Quadrant D Data is divided into 100 sec bins |
 |
 |
| Parameter | Plot |
|---|---|
| CZT HV Monitor | 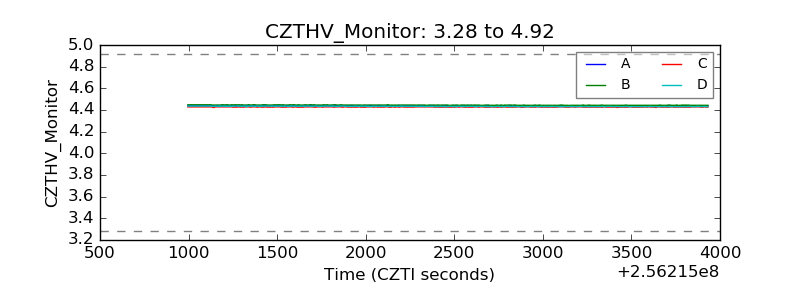 |
| D_VDD | 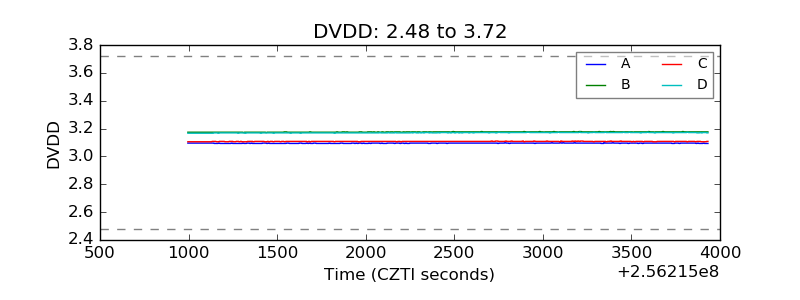 |
| Temperature 1 | 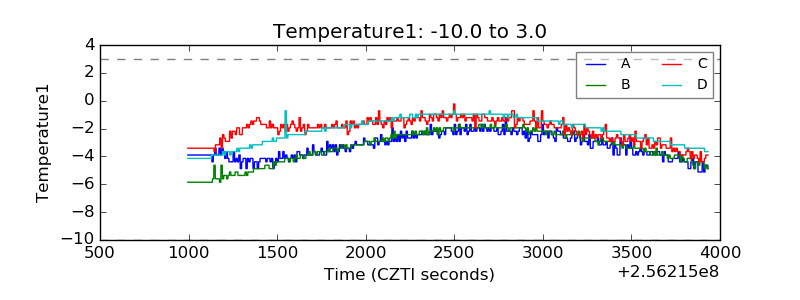 |
| Veto HV Monitor | 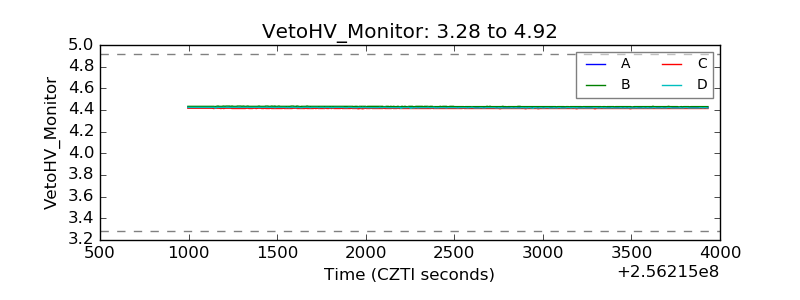 |
| Veto LLD | 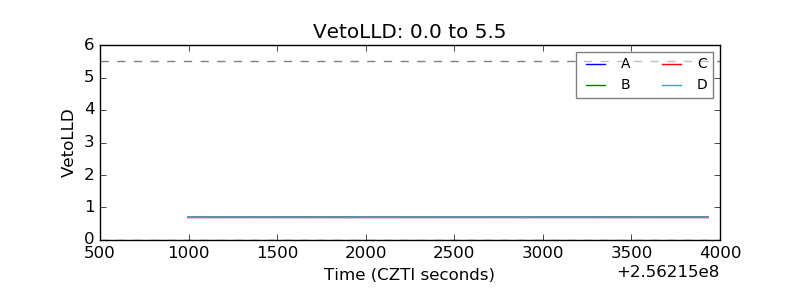 |
| Alpha Counter | 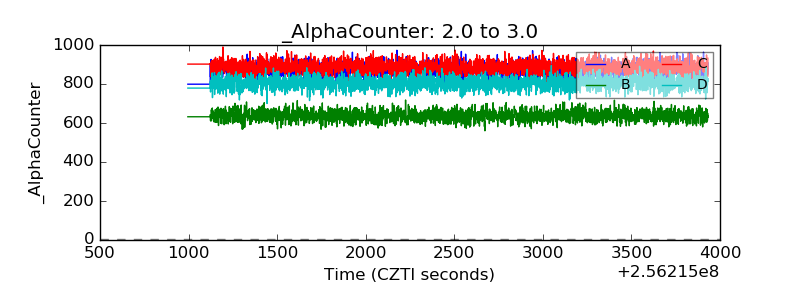 |
| _CPM_Rate | 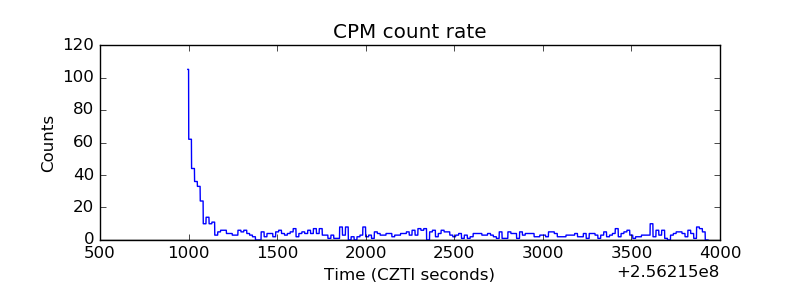 |
| CZT Counter | 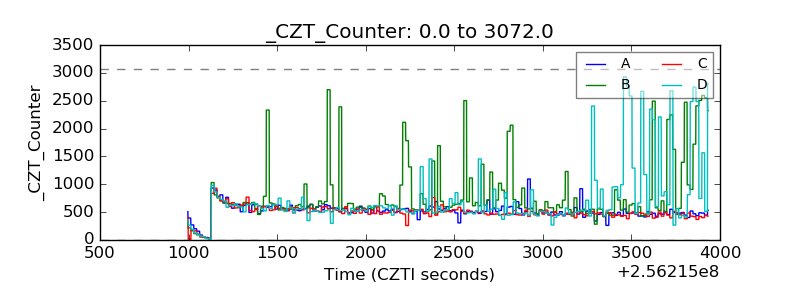 |
| +2.5 Volts monitor |  |
| +5 Volts monitor |  |
| _ROLL_ROT | 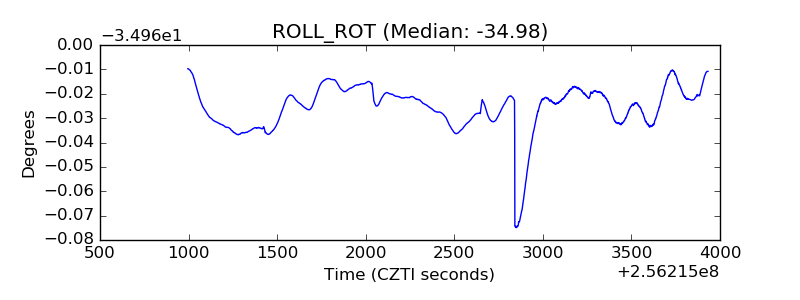 |
| _Roll_DEC | 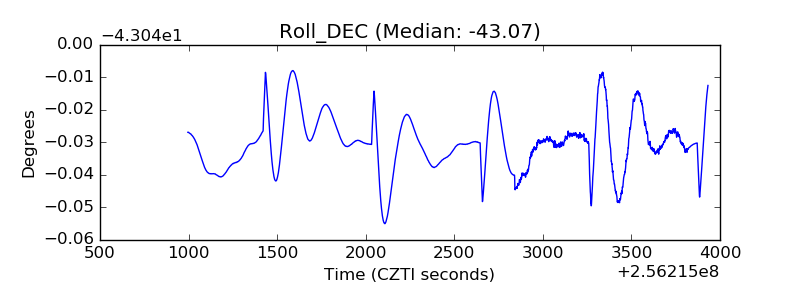 |
| _Roll_RA | 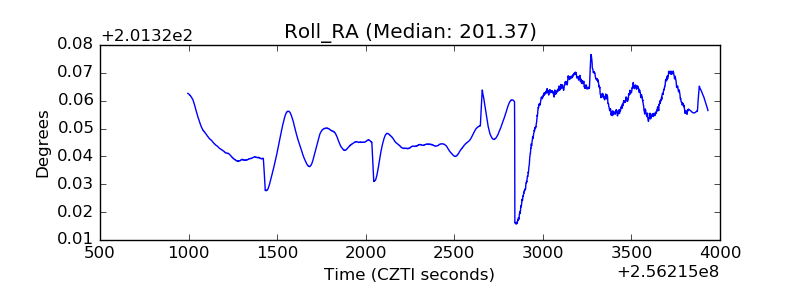 |
| Veto Counter | 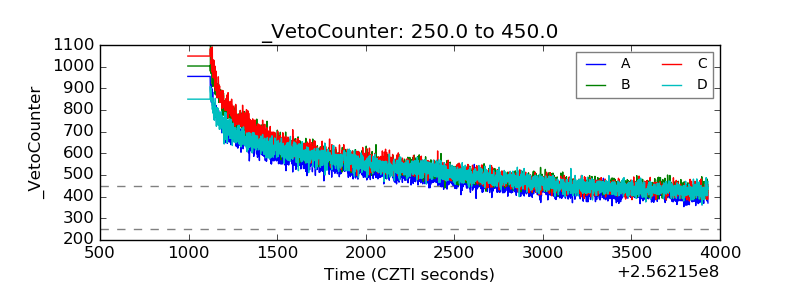 |