| Param | Original file | Final file |
|---|---|---|
| Filename | modeM0/AS1G08_041T01_9000001892_12868cztM0_level2.evt | modeM0/AS1G08_041T01_9000001892_12868cztM0_level2_quad_clean.evt |
| Size (bytes) | 297,532,800 | 51,428,160 |
| Size | 283.7 MB | 49.0 MB |
| Events in quadrant A | 1,713,918 | 350,075 |
| Events in quadrant B | 3,017,754 | 318,096 |
| Events in quadrant C | 1,654,808 | 344,162 |
| Events in quadrant D | 2,406,057 | 317,575 |
| Mode M9 | |||
|---|---|---|---|
| Quadrant | BADHDUFLAG | Total packets | Discarded packets |
| A | 0 | 13 | 0 |
| B | 0 | 13 | 0 |
| C | 0 | 13 | 0 |
| D | 0 | 13 | 0 |
| Mode SS | |||
|---|---|---|---|
| Quadrant | BADHDUFLAG | Total packets | Discarded packets |
| A | 0 | 66 | 0 |
| B | 0 | 66 | 0 |
| C | 0 | 66 | 0 |
| D | 0 | 66 | 0 |
| Mode M0 | |||
|---|---|---|---|
| Quadrant | BADHDUFLAG | Total packets | Discarded packets |
| A | 0 | 6904 | 2 |
| B | 0 | 11008 | 1 |
| C | 0 | 6785 | 1 |
| D | 0 | 9137 | 1 |
| Quadrant | Total seconds | Saturated seconds | Saturation percentage |
|---|---|---|---|
| A | 3192 | 101 | 3.164160% |
| B | 3192 | 610 | 19.110276% |
| C | 3192 | 66 | 2.067669% |
| D | 3192 | 276 | 8.646617% |
Noise dominated data is calculated using 1-second bins in cleaned event files. If a bin has >2000 counts, and if more than 50% of those come from <1% of pixels, then it is considered to be noise-dominated and hence unusable.
| Quadrant | # 1 sec bins | Bins with >0 counts | Bins with >2000 counts | High rate bins dominated by noise | Noise dominated (total time) | Noise dominated (detector-on time) | Marked lightcurve |
|---|---|---|---|---|---|---|---|
| A | 4468 | 3195 | 0 | 0 | 0.00% | 0.00% | 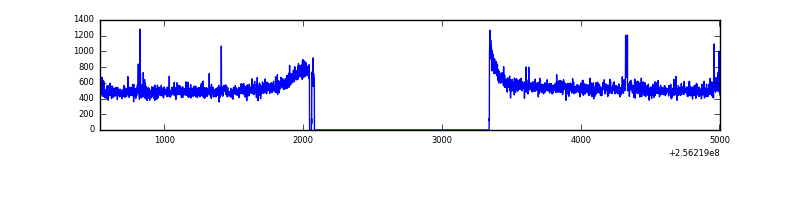 |
| B | 4468 | 3195 | 376 | 376 | 8.42% | 11.77% | 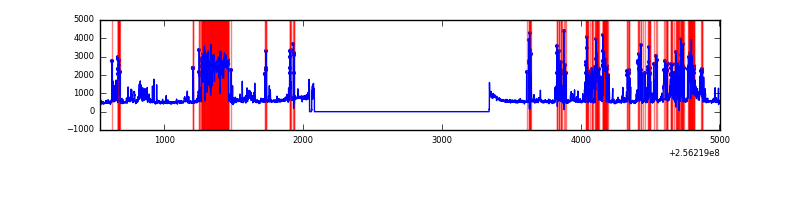 |
| C | 4468 | 3195 | 0 | 0 | 0.00% | 0.00% | 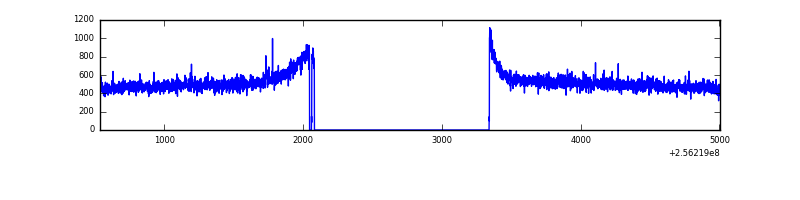 |
| D | 4468 | 3195 | 187 | 187 | 4.19% | 5.85% | 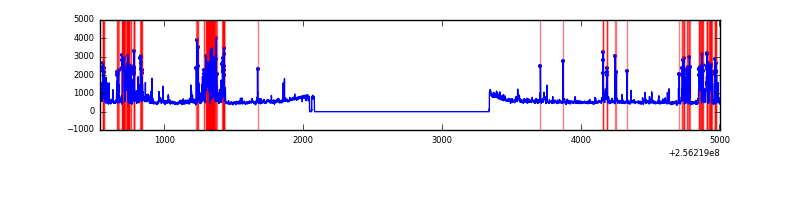 |
Top three noisy pixels from each quadrant. If the there are fewer than three noisy pixels in the level2.evt file, extra rows are filled as -1
| Pixel properties | Quadrant properties | ||||||
|---|---|---|---|---|---|---|---|
| Quadrant | DetID | PixID | Counts | Sigma | Mean | Median | Sigma |
| A | 15 | 174 | 9590 | 102.16 | 438 | 429 | 89.7 |
| A | 11 | 29 | 8907 | 94.54 | 438 | 429 | 89.7 |
| A | 8 | 15 | 5466 | 56.17 | 438 | 429 | 89.7 |
| B | 4 | 239 | 809508 | 10698.61 | 393 | 384 | 75.6 |
| B | 3 | 64 | 492305 | 6504.41 | 393 | 384 | 75.6 |
| B | 0 | 85 | 99096 | 1305.22 | 393 | 384 | 75.6 |
| C | 13 | 61 | 3185 | 28.05 | 423 | 425 | 98.4 |
| C | 14 | 234 | 2721 | 23.33 | 423 | 425 | 98.4 |
| C | 4 | 112 | 1966 | 15.66 | 423 | 425 | 98.4 |
| D | 1 | 52 | 807136 | 8106.44 | 413 | 402 | 99.5 |
| D | 2 | 136 | 13072 | 127.31 | 413 | 402 | 99.5 |
| D | 13 | 172 | 11559 | 112.11 | 413 | 402 | 99.5 |
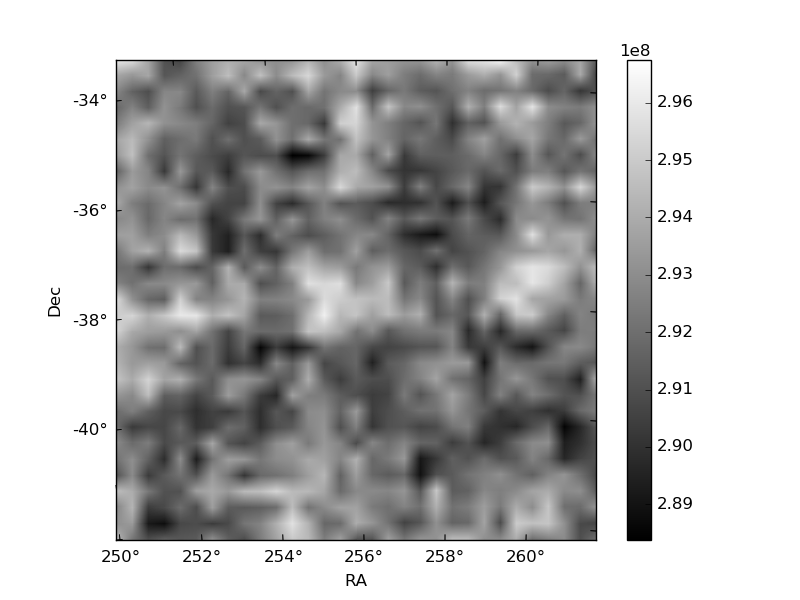
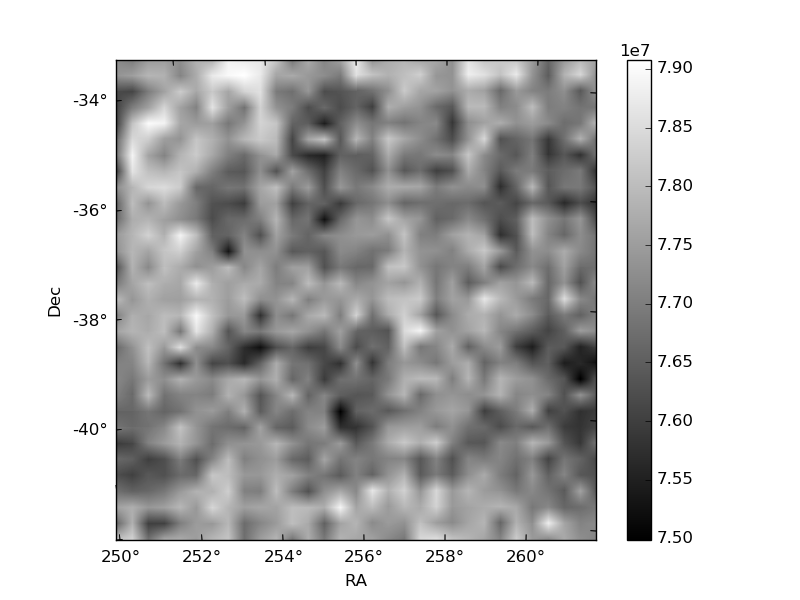
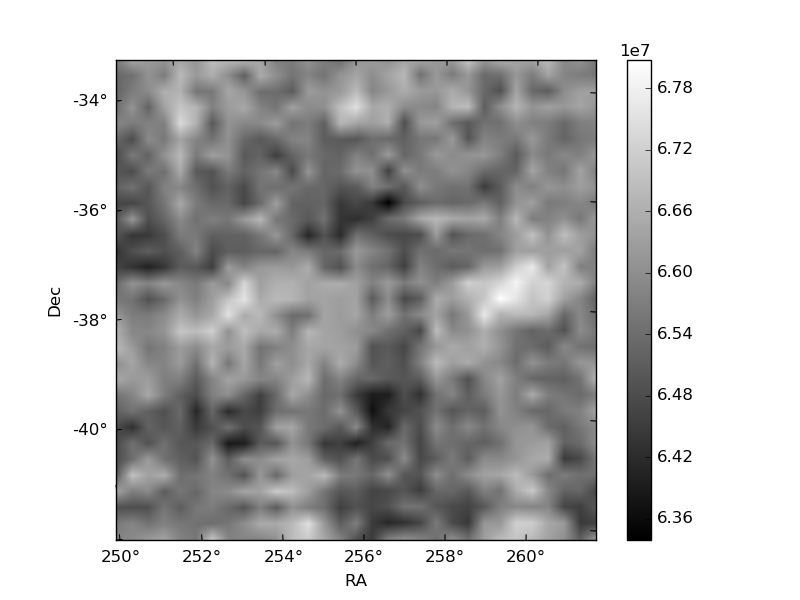
Histogram calculated using DETX and DETY for each event in the final _common_clean file
| Quadrant A | 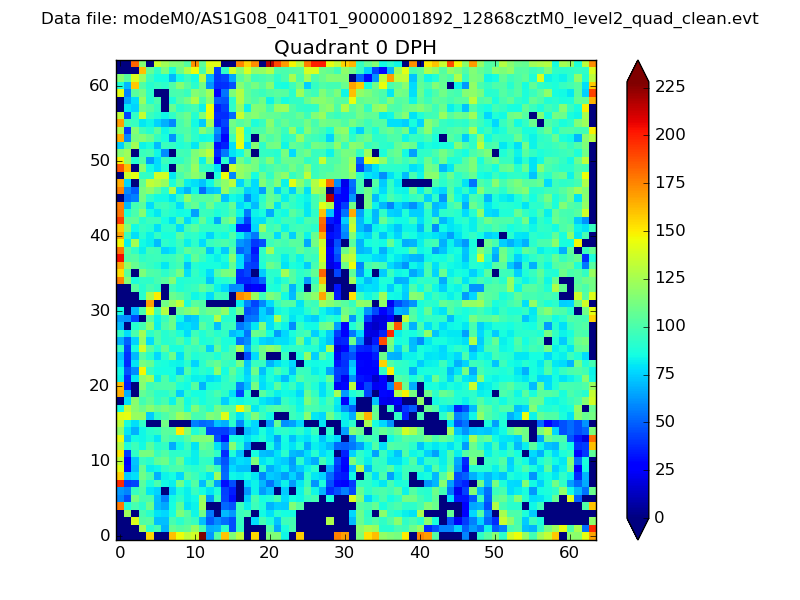 |
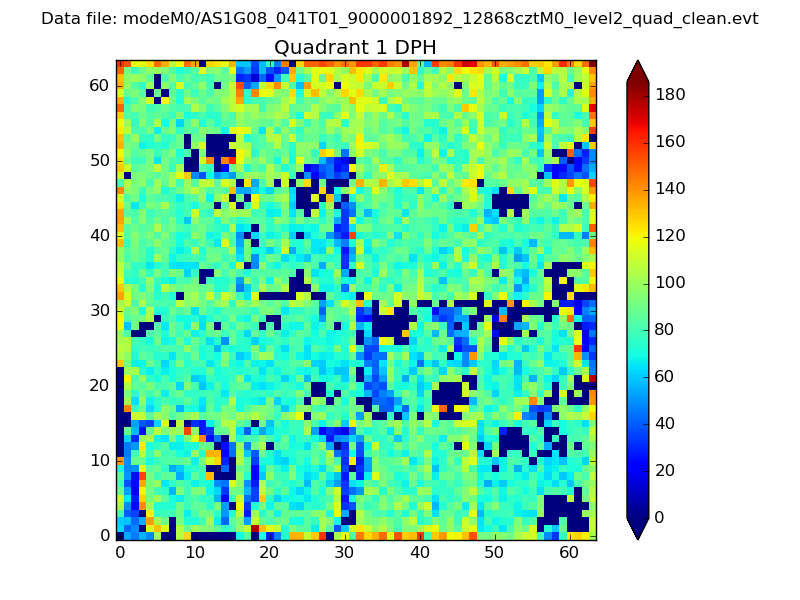 |
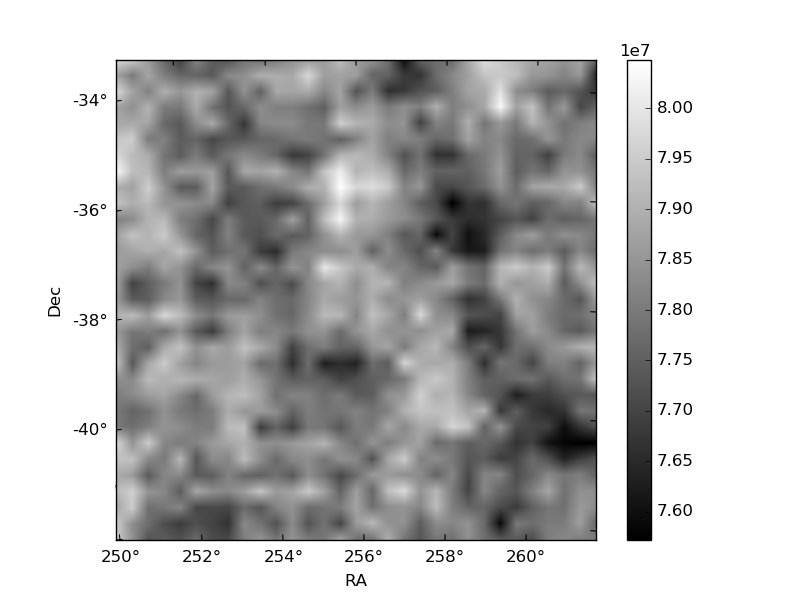
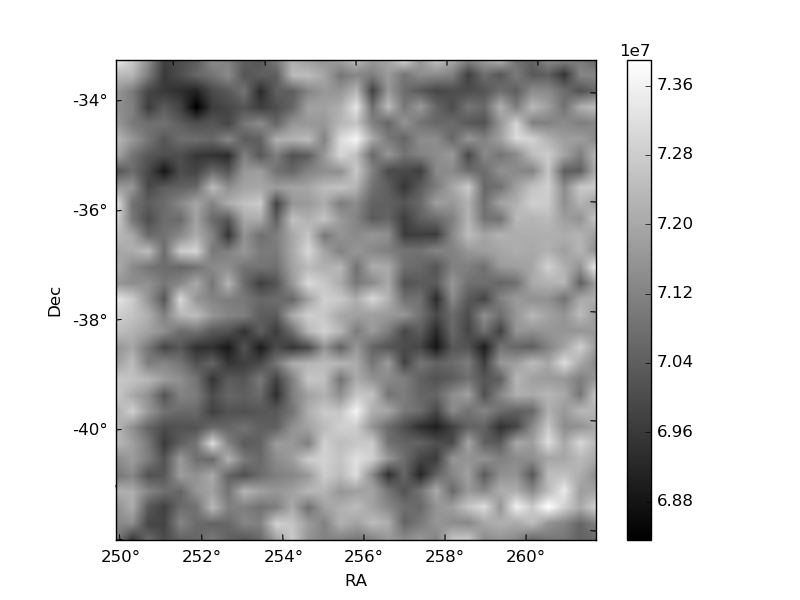
Quadrant B |
|---|---|---|---|
| Quadrant D | 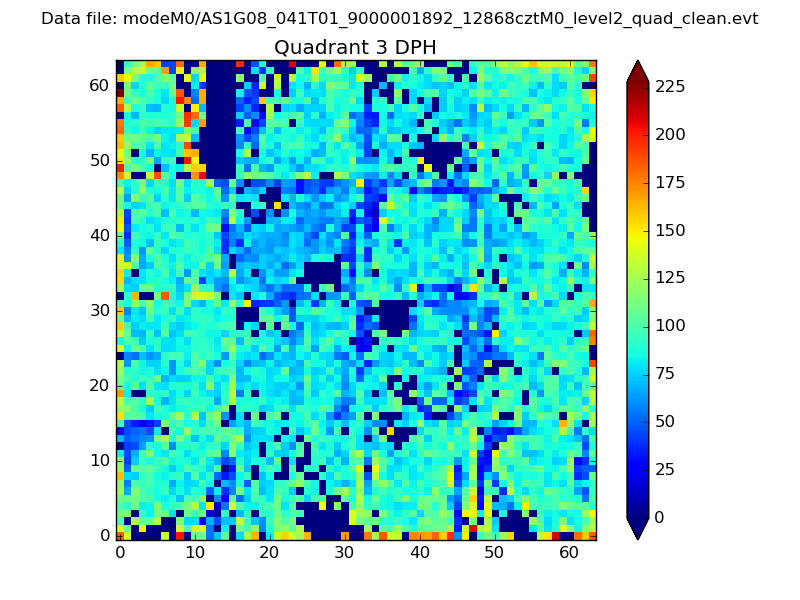 |
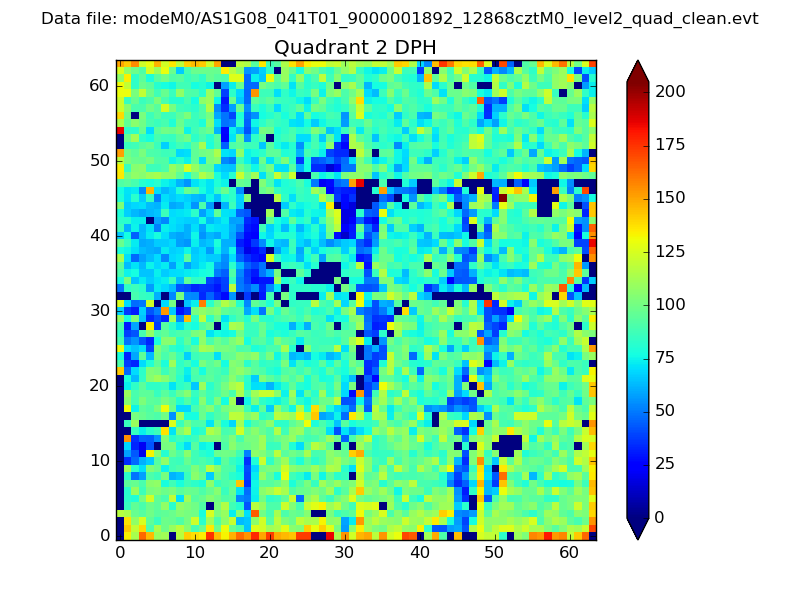 |
Quadrant C |
| Plot type | Count rate plots | Images |
|---|---|---|
| Comparison with Poisson distribution Blue bars denote a histogram of data divided into 1 sec bins. Red curve is a Poisson curve with rate = median count rate of data. |
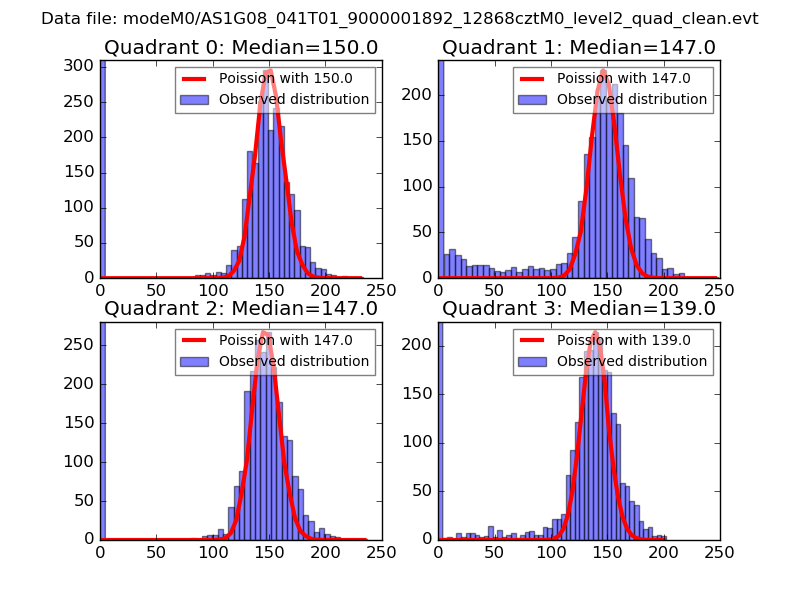 |
 |
| Quadrant-wise count rates Data is divided into 100 sec bins |
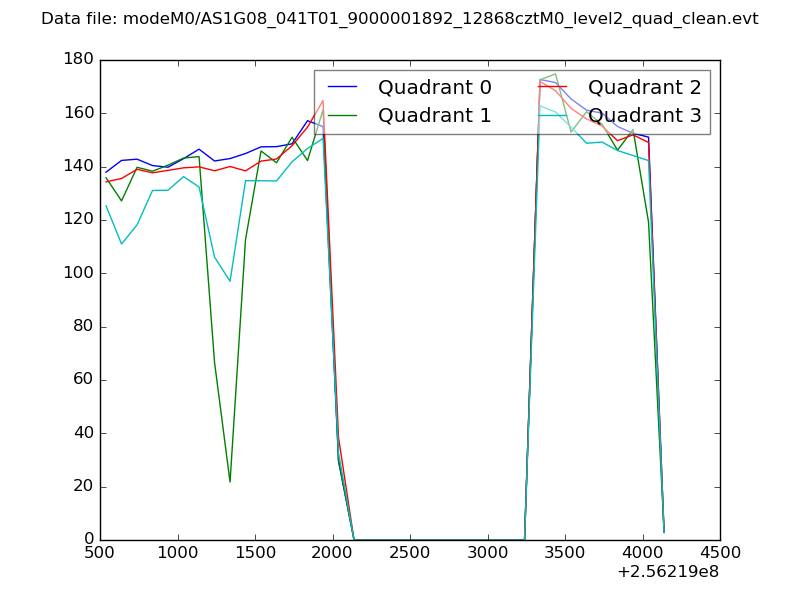 |
|
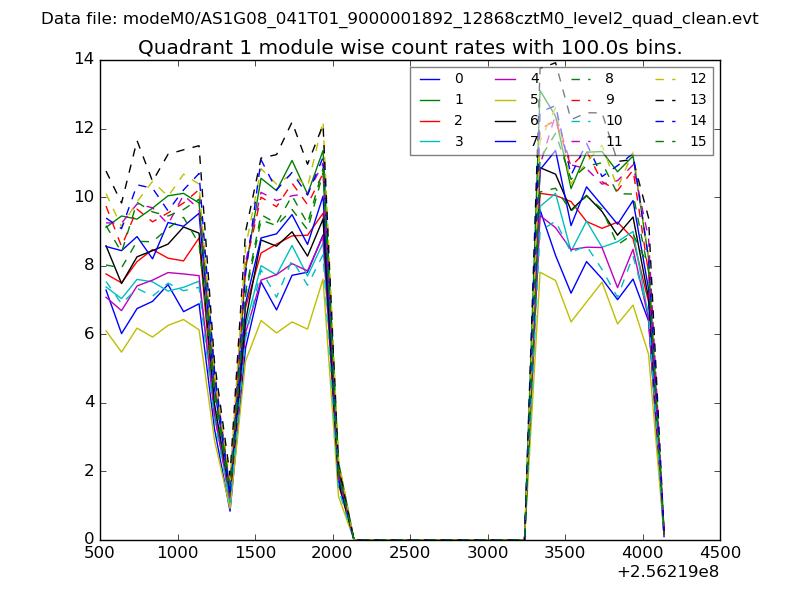
| Module-wise count rates for Quadrant A Data is divided into 100 sec bins |
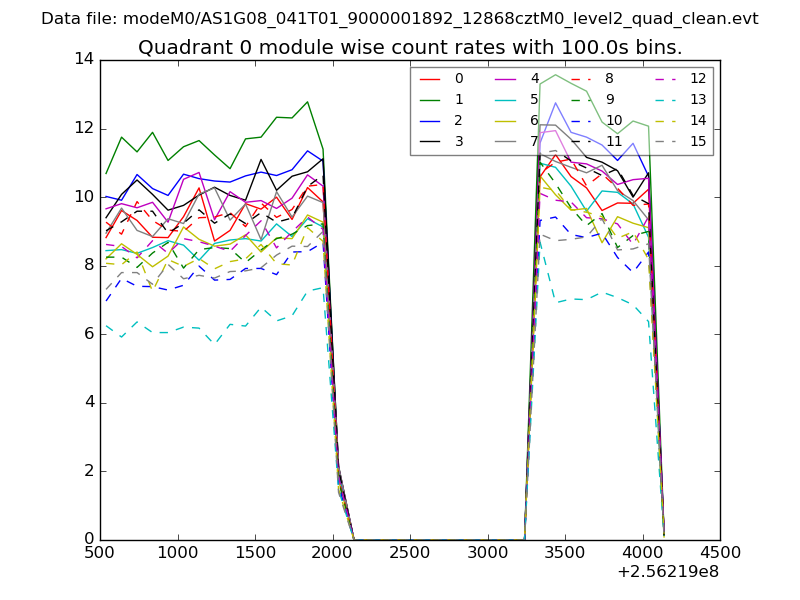 |
 |
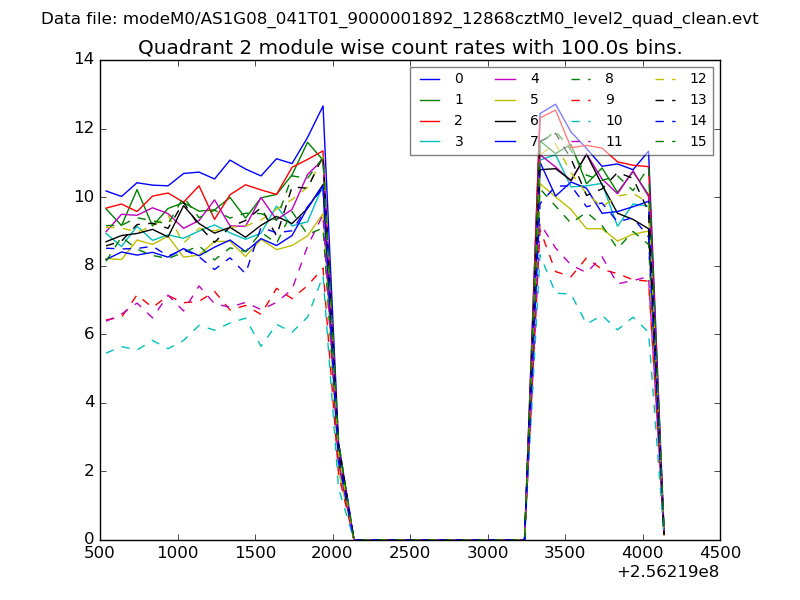
| Module-wise count rates for Quadrant B Data is divided into 100 sec bins |
 |
 |
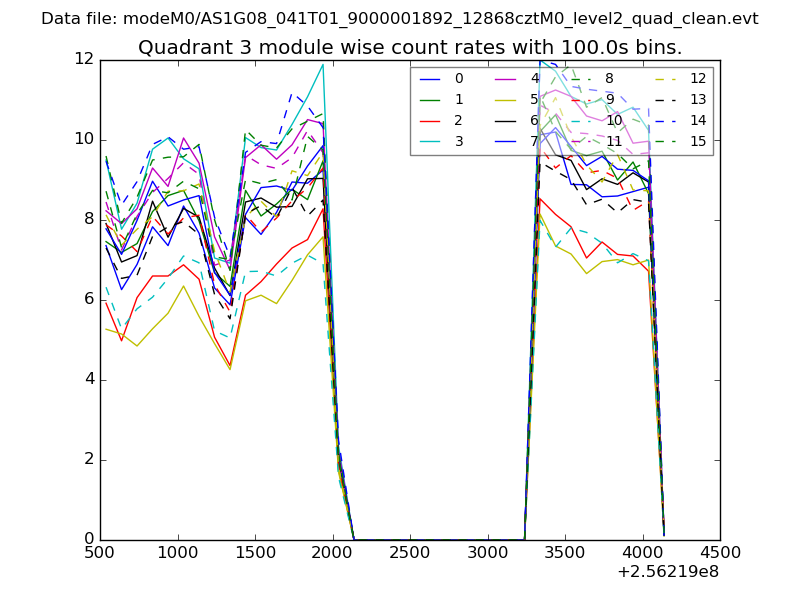
| Module-wise count rates for Quadrant C Data is divided into 100 sec bins |
 |
 |
| Module-wise count rates for Quadrant D Data is divided into 100 sec bins |
 |
 |
| Parameter | Plot |
|---|---|
| CZT HV Monitor | 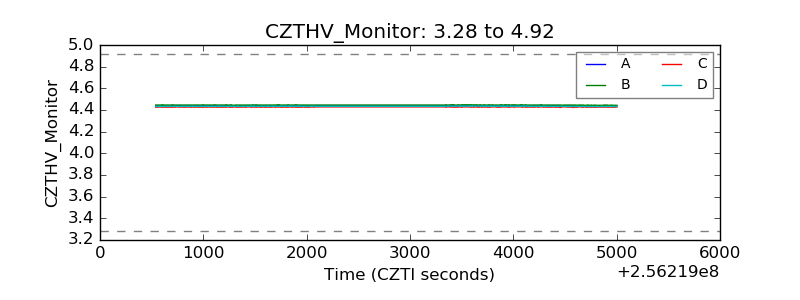 |
| D_VDD | 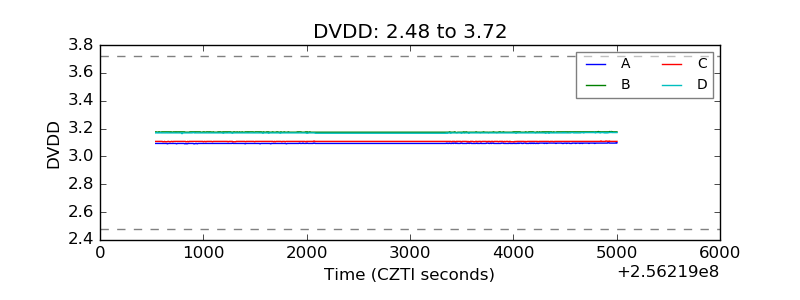 |
| Temperature 1 | 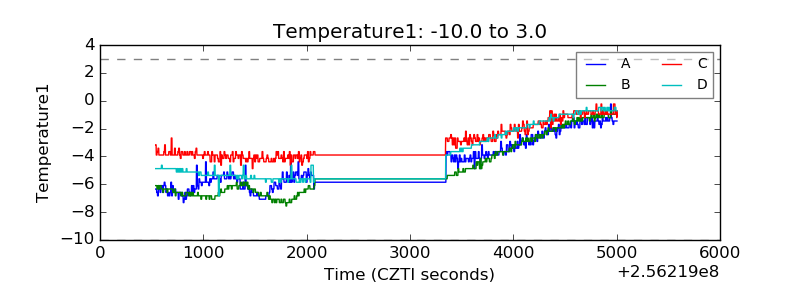 |
| Veto HV Monitor | 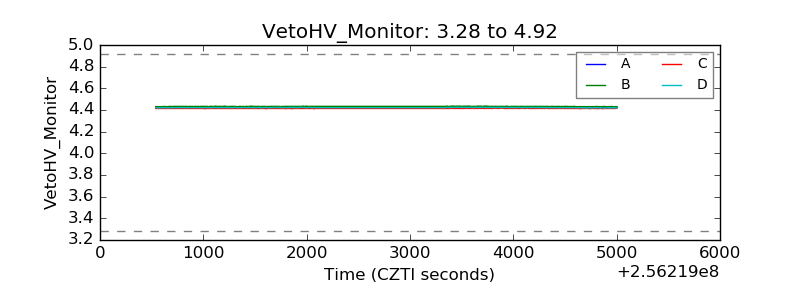 |
| Veto LLD | 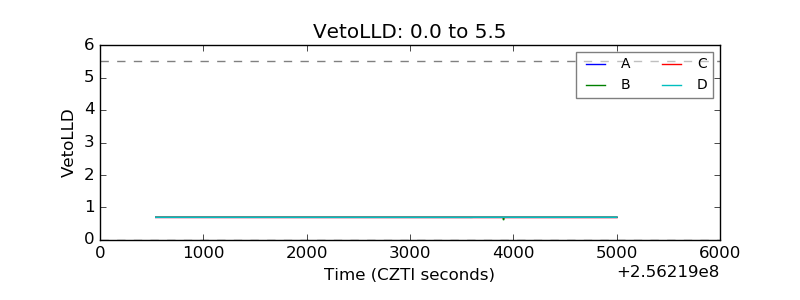 |
| Alpha Counter | 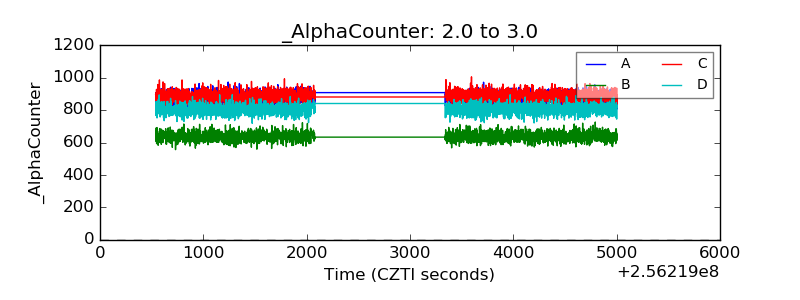 |
| _CPM_Rate | 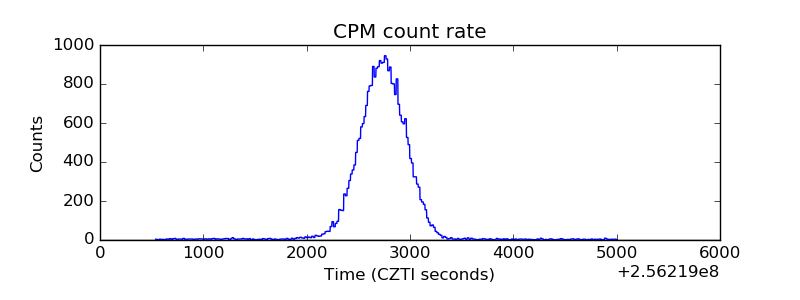 |
| CZT Counter | 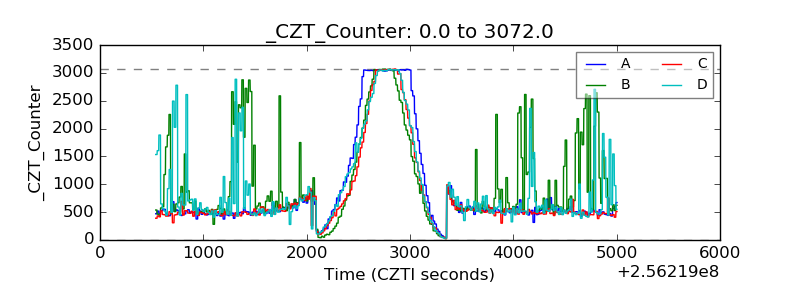 |
| +2.5 Volts monitor |  |
| +5 Volts monitor |  |
| _ROLL_ROT | 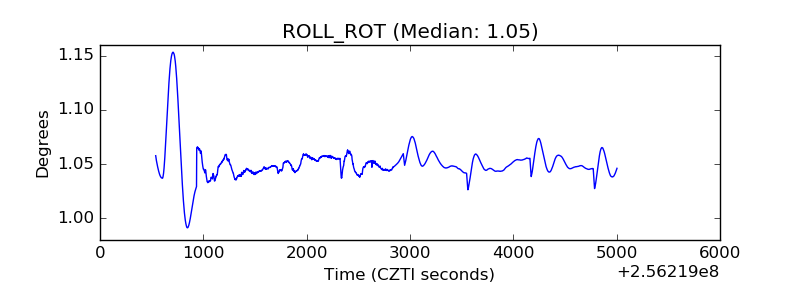 |
| _Roll_DEC | 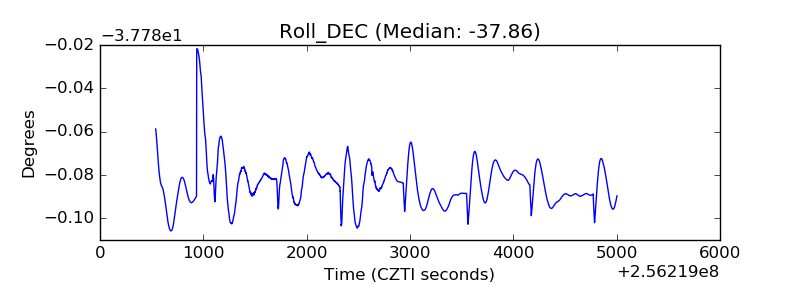 |
| _Roll_RA | 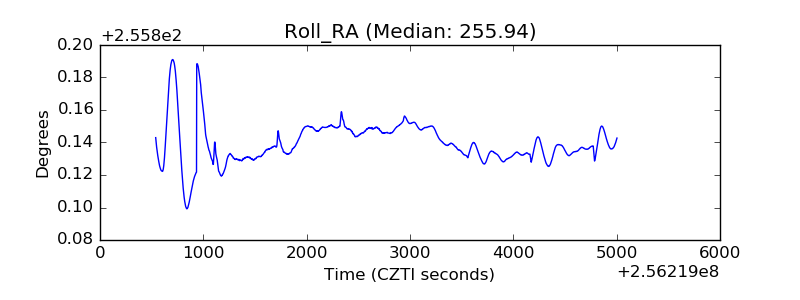 |
| Veto Counter | 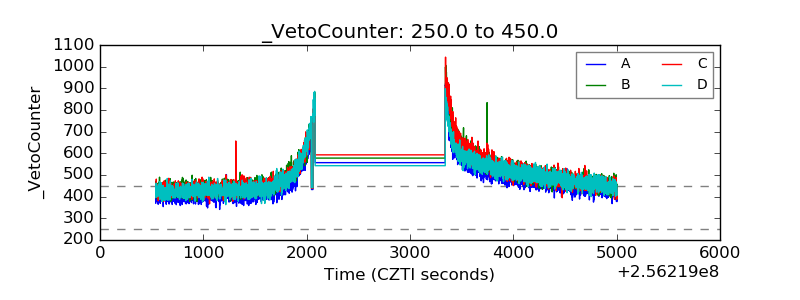 |