| Param | Original file | Final file |
|---|---|---|
| Filename | modeM0/AS1G08_041T01_9000001892_12871cztM0_level2.evt | modeM0/AS1G08_041T01_9000001892_12871cztM0_level2_quad_clean.evt |
| Size (bytes) | 554,811,840 | 75,456,000 |
| Size | 529.1 MB | 72.0 MB |
| Events in quadrant A | 3,656,771 | 466,820 |
| Events in quadrant B | 5,652,202 | 422,483 |
| Events in quadrant C | 3,214,136 | 468,107 |
| Events in quadrant D | 3,810,443 | 445,550 |
| Mode M9 | |||
|---|---|---|---|
| Quadrant | BADHDUFLAG | Total packets | Discarded packets |
| A | 0 | 4 | 0 |
| B | 0 | 4 | 0 |
| C | 0 | 4 | 0 |
| D | 0 | 4 | 0 |
| Mode SS | |||
|---|---|---|---|
| Quadrant | BADHDUFLAG | Total packets | Discarded packets |
| A | 0 | 140 | 0 |
| B | 0 | 140 | 0 |
| C | 0 | 140 | 0 |
| D | 0 | 140 | 0 |
| Mode M0 | |||
|---|---|---|---|
| Quadrant | BADHDUFLAG | Total packets | Discarded packets |
| A | 0 | 15120 | 2 |
| B | 0 | 21300 | 1 |
| C | 0 | 14220 | 1 |
| D | 0 | 16060 | 1 |
| Quadrant | Total seconds | Saturated seconds | Saturation percentage |
|---|---|---|---|
| A | 6913 | 147 | 2.126428% |
| B | 6913 | 817 | 11.818313% |
| C | 6913 | 57 | 0.824533% |
| D | 6913 | 142 | 2.054101% |
Noise dominated data is calculated using 1-second bins in cleaned event files. If a bin has >2000 counts, and if more than 50% of those come from <1% of pixels, then it is considered to be noise-dominated and hence unusable.
| Quadrant | # 1 sec bins | Bins with >0 counts | Bins with >2000 counts | High rate bins dominated by noise | Noise dominated (total time) | Noise dominated (detector-on time) | Marked lightcurve |
|---|---|---|---|---|---|---|---|
| A | 7264 | 6915 | 23 | 23 | 0.32% | 0.33% | 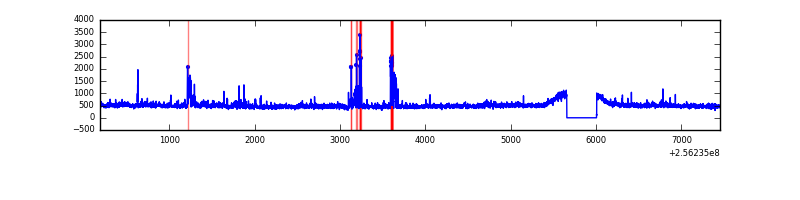 |
| B | 7264 | 6915 | 460 | 460 | 6.33% | 6.65% | 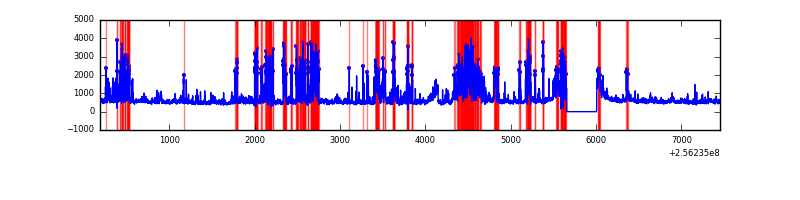 |
| C | 7264 | 6915 | 0 | 0 | 0.00% | 0.00% | 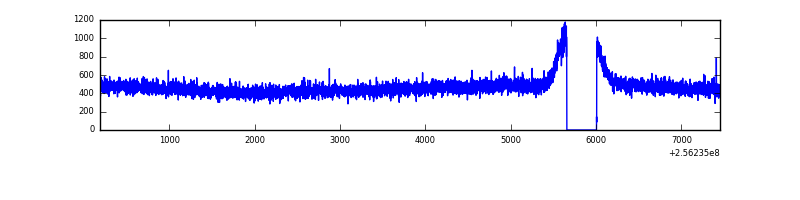 |
| D | 7264 | 6915 | 63 | 63 | 0.87% | 0.91% | 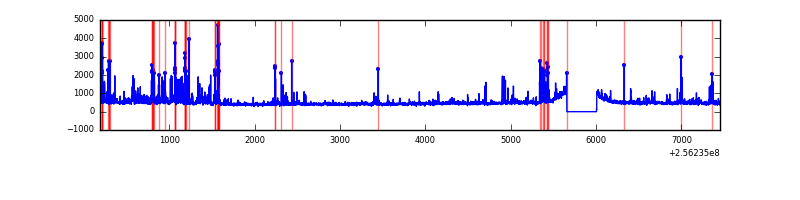 |
Top three noisy pixels from each quadrant. If the there are fewer than three noisy pixels in the level2.evt file, extra rows are filled as -1
| Pixel properties | Quadrant properties | ||||||
|---|---|---|---|---|---|---|---|
| Quadrant | DetID | PixID | Counts | Sigma | Mean | Median | Sigma |
| A | 11 | 29 | 174350 | 1007.42 | 847 | 827 | 172.2 |
| A | 12 | 189 | 76299 | 438.17 | 847 | 827 | 172.2 |
| A | 1 | 162 | 38335 | 217.76 | 847 | 827 | 172.2 |
| B | 4 | 239 | 1255669 | 8309.49 | 793 | 773 | 151.0 |
| B | 0 | 85 | 657512 | 4348.7 | 793 | 773 | 151.0 |
| B | 0 | 219 | 214135 | 1412.81 | 793 | 773 | 151.0 |
| C | 13 | 61 | 6147 | 27.78 | 822 | 827 | 191.5 |
| C | 8 | 128 | 3466 | 13.78 | 822 | 827 | 191.5 |
| C | 0 | 207 | 2480 | 8.63 | 822 | 827 | 191.5 |
| D | 1 | 52 | 631607 | 3175.6 | 818 | 796 | 198.6 |
| D | 2 | 234 | 31857 | 156.37 | 818 | 796 | 198.6 |
| D | 2 | 14 | 16485 | 78.98 | 818 | 796 | 198.6 |
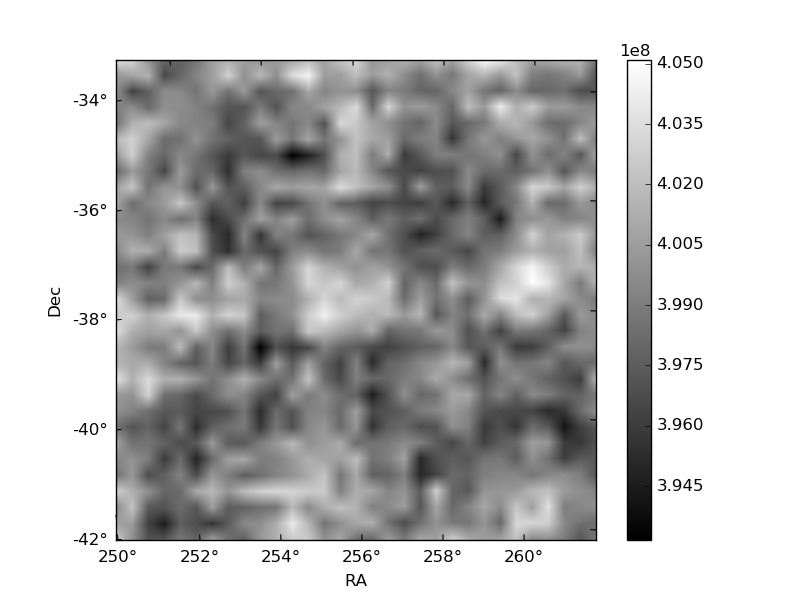
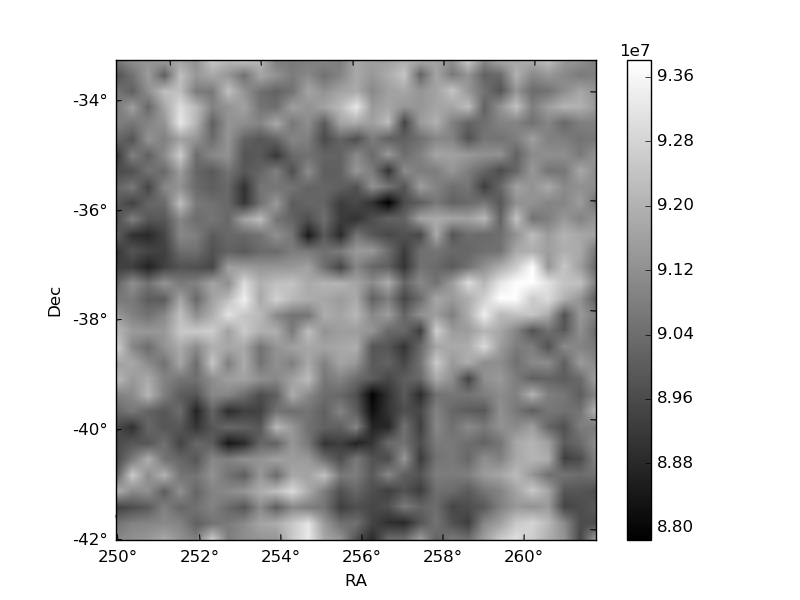
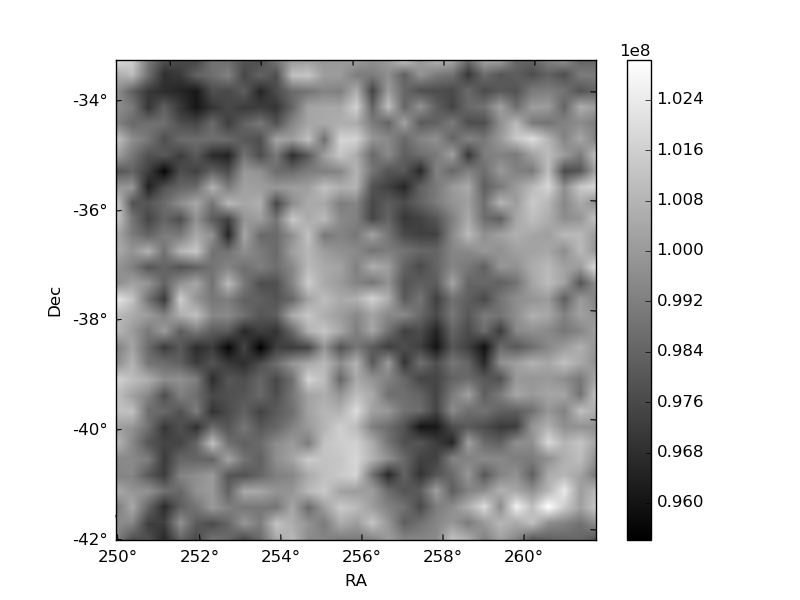
Histogram calculated using DETX and DETY for each event in the final _common_clean file
| Quadrant A | 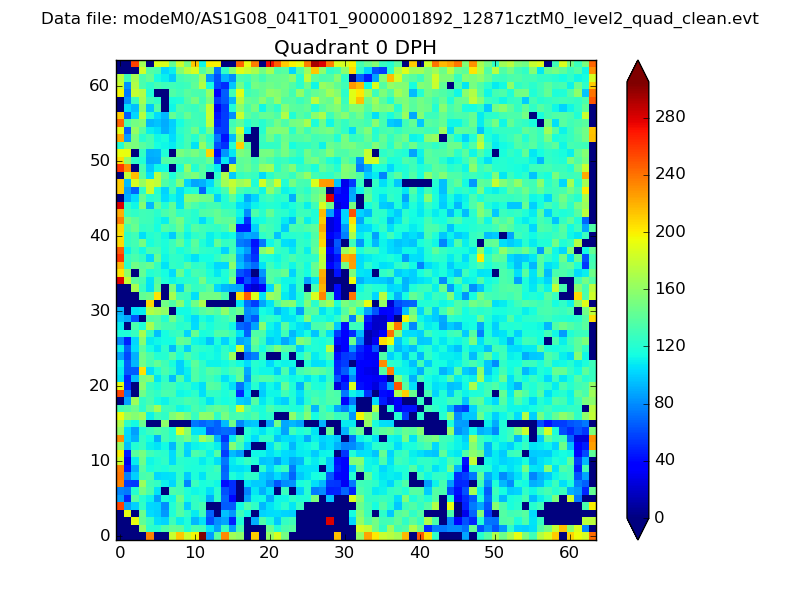 |
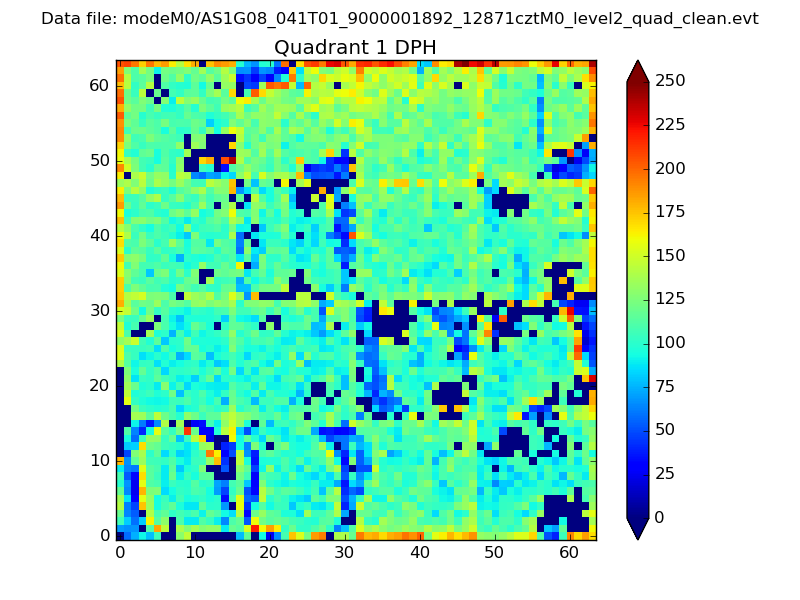 |
Quadrant B |
|---|---|---|---|
| Quadrant D | 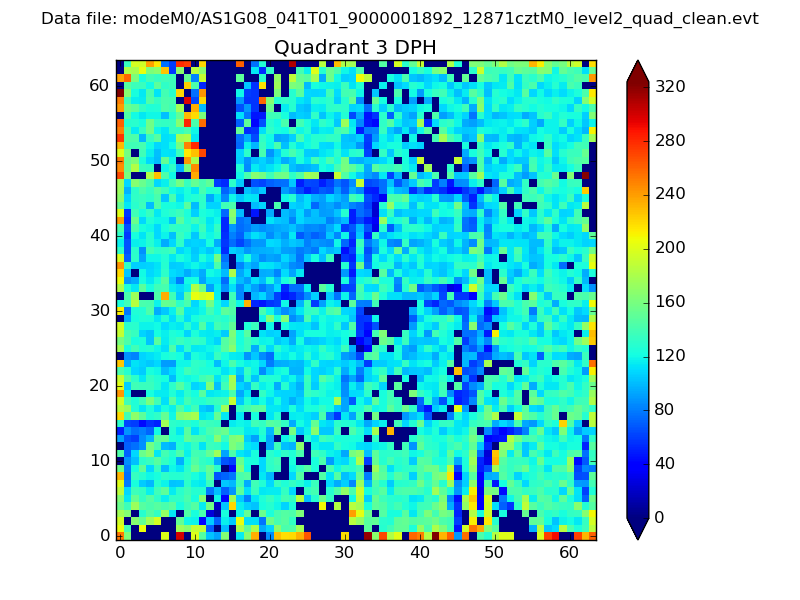 |
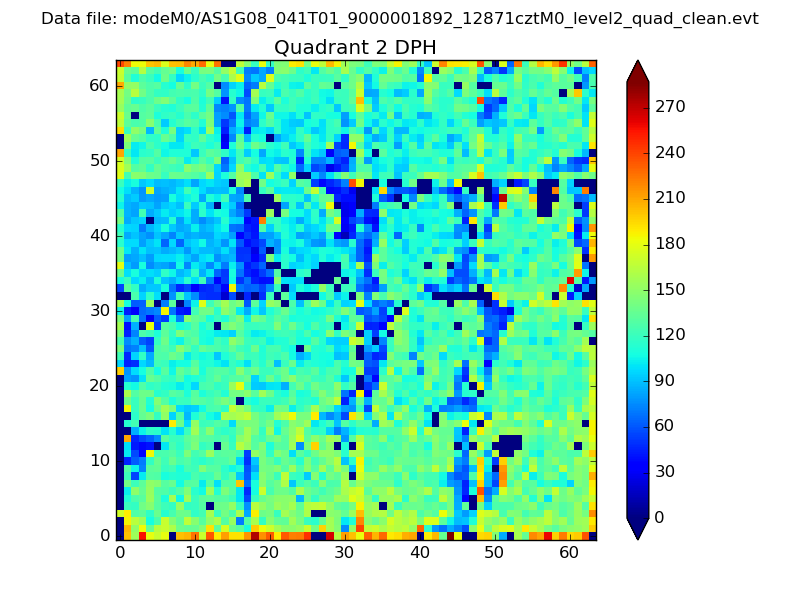 |
Quadrant C |
| Plot type | Count rate plots | Images |
|---|---|---|
| Comparison with Poisson distribution Blue bars denote a histogram of data divided into 1 sec bins. Red curve is a Poisson curve with rate = median count rate of data. |
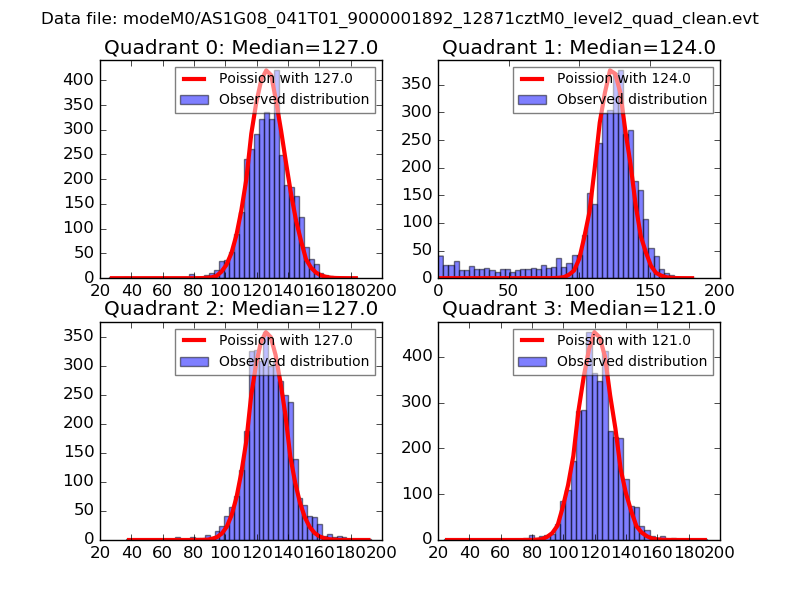 |
 |
| Quadrant-wise count rates Data is divided into 100 sec bins |
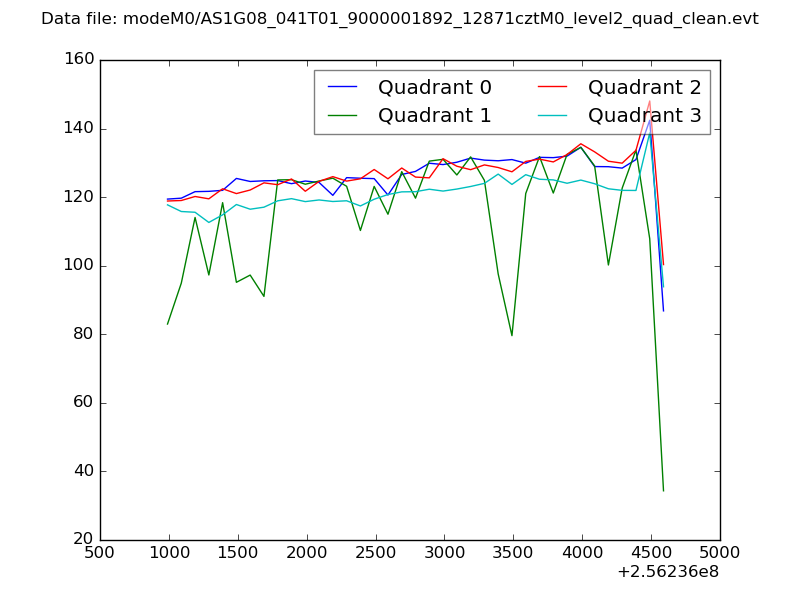 |
|
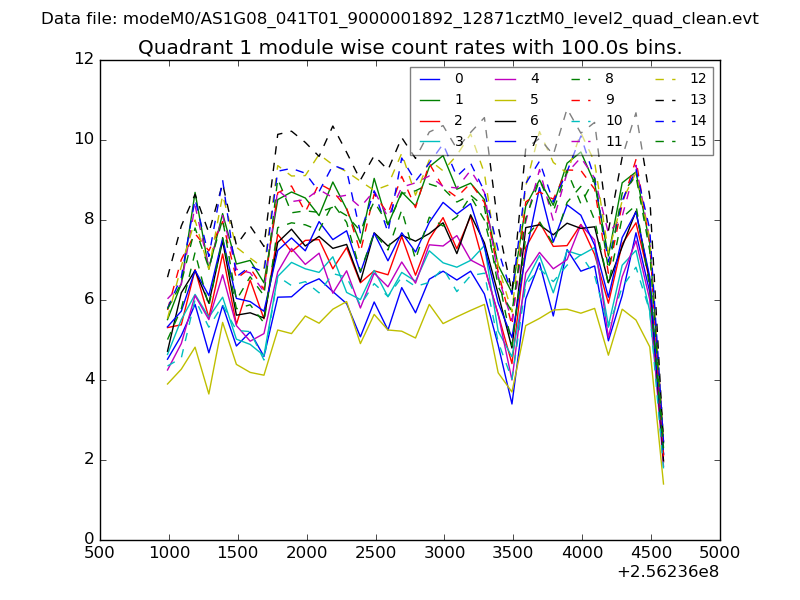
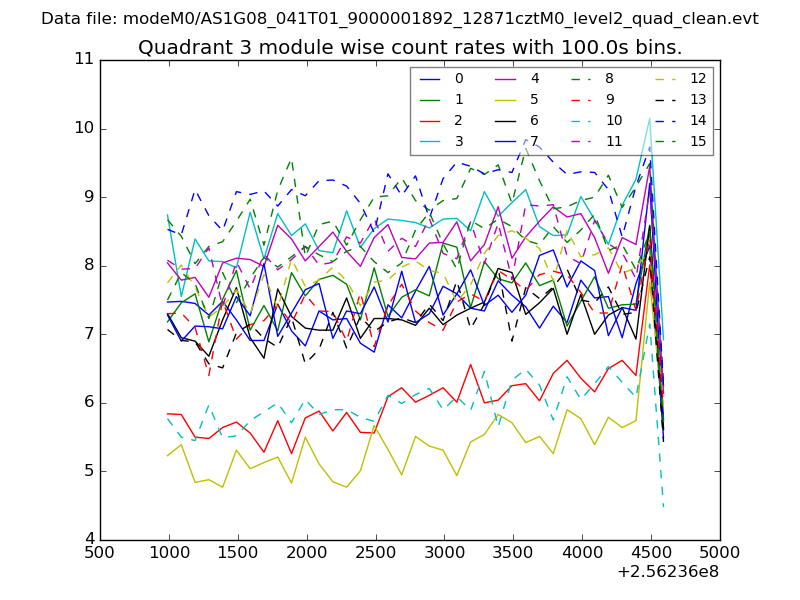
| Module-wise count rates for Quadrant A Data is divided into 100 sec bins |
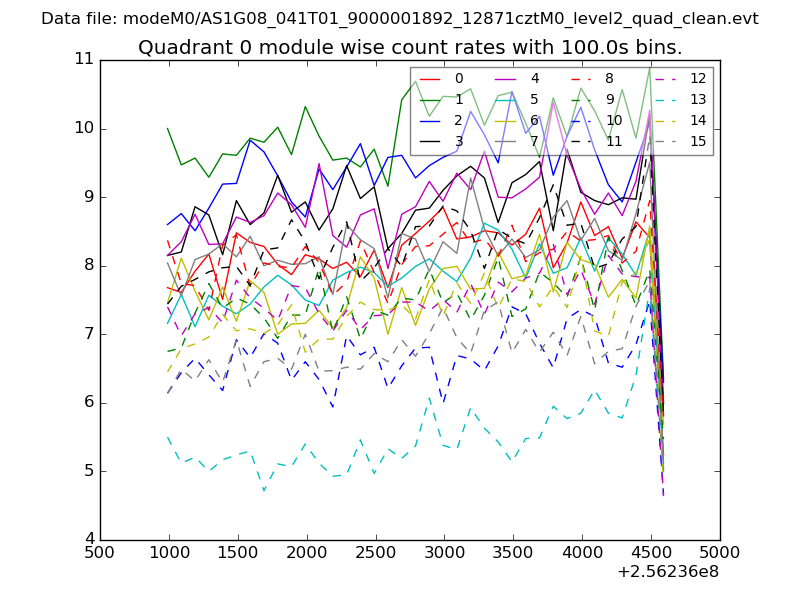 |
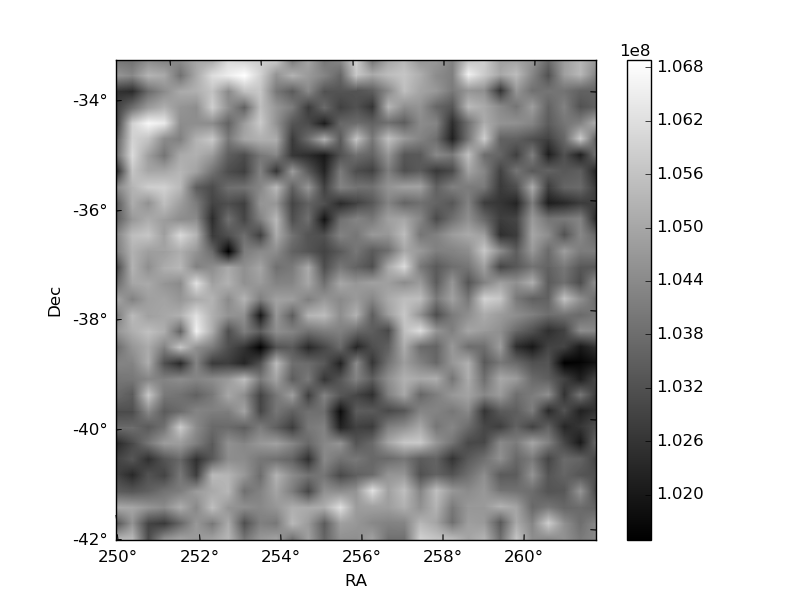 |
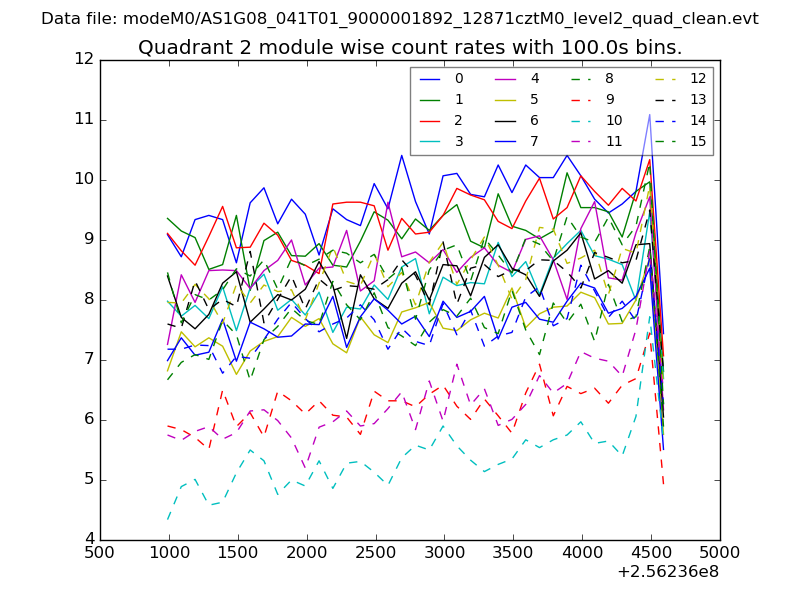
| Module-wise count rates for Quadrant B Data is divided into 100 sec bins |
 |
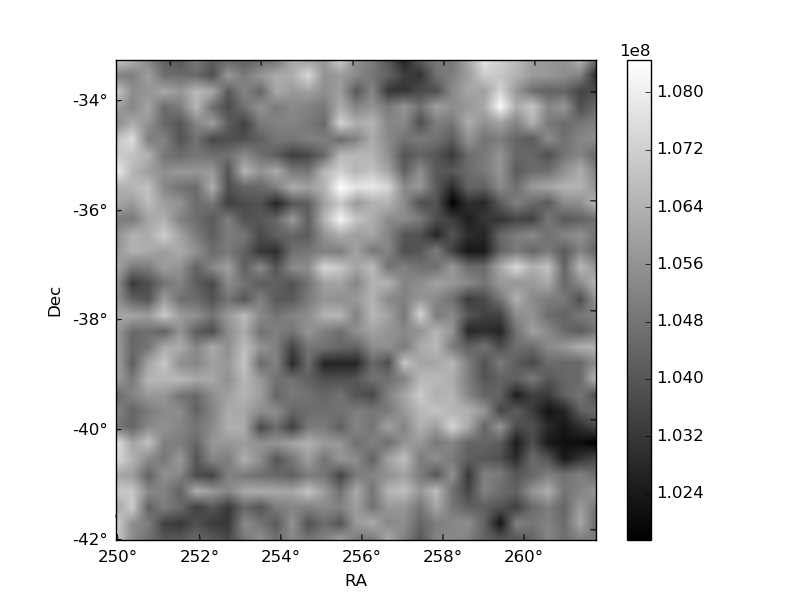 |
| Module-wise count rates for Quadrant C Data is divided into 100 sec bins |
 |
 |
| Module-wise count rates for Quadrant D Data is divided into 100 sec bins |
 |
 |
| Parameter | Plot |
|---|---|
| CZT HV Monitor | 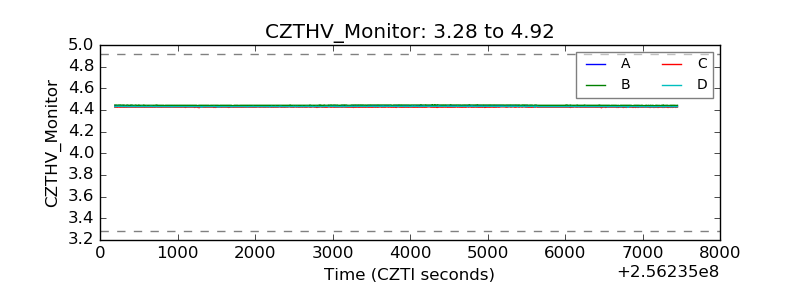 |
| D_VDD | 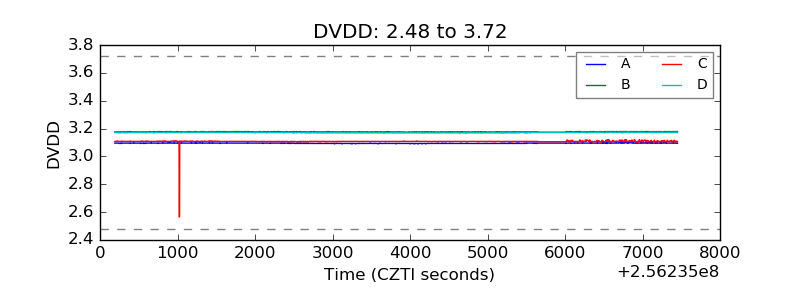 |
| Temperature 1 | 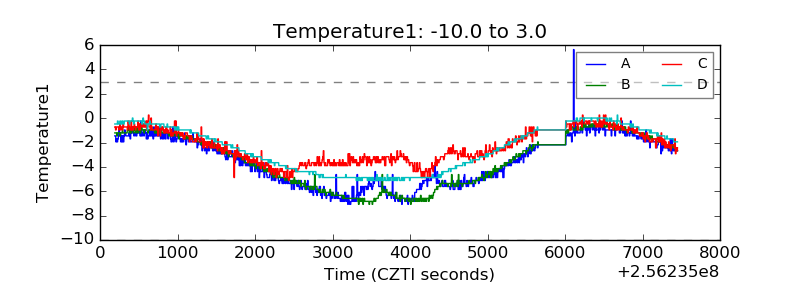 |
| Veto HV Monitor | 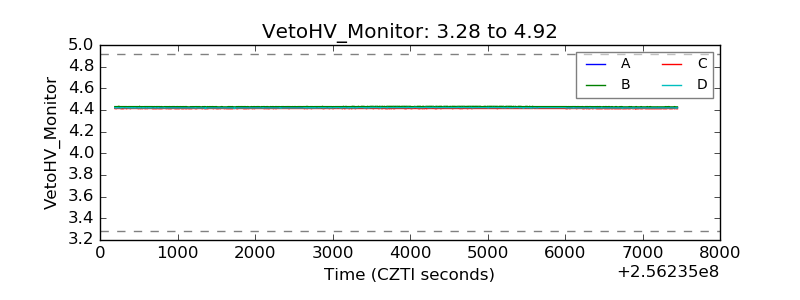 |
| Veto LLD | 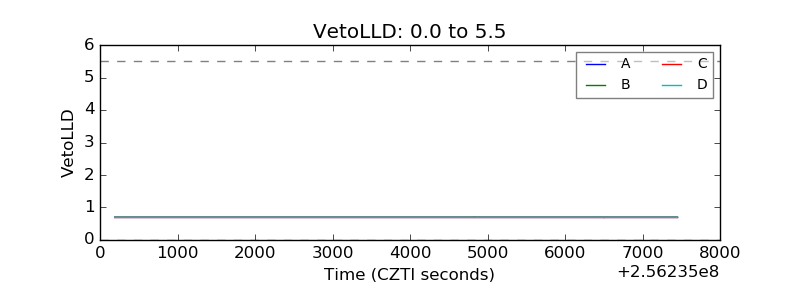 |
| Alpha Counter | 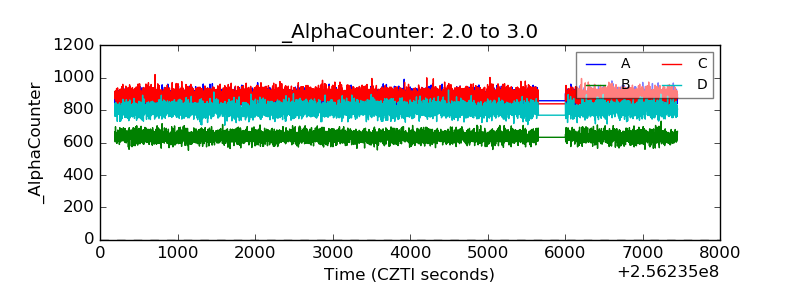 |
| _CPM_Rate | 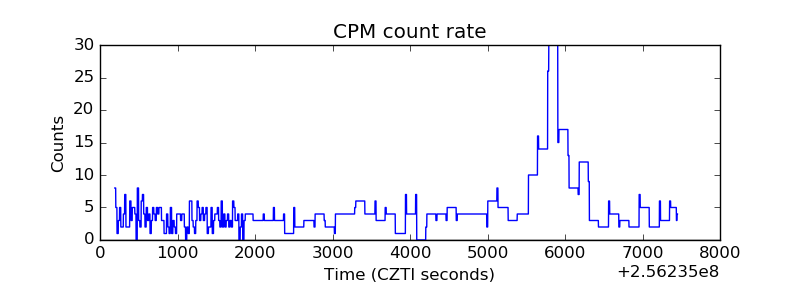 |
| CZT Counter | 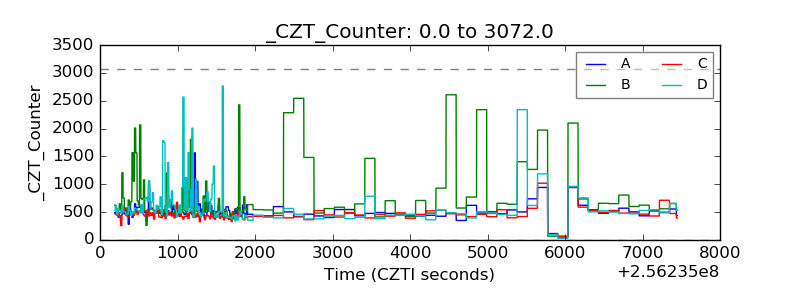 |
| +2.5 Volts monitor |  |
| +5 Volts monitor |  |
| _ROLL_ROT | 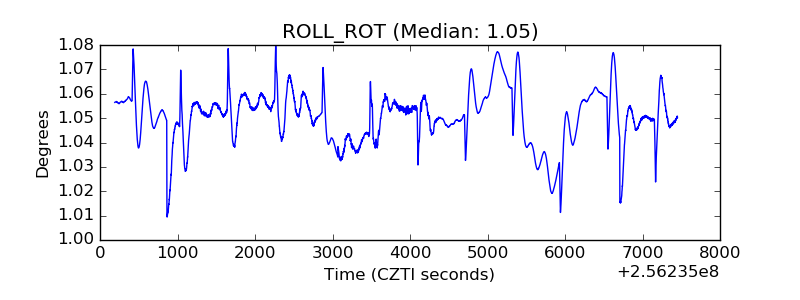 |
| _Roll_DEC | 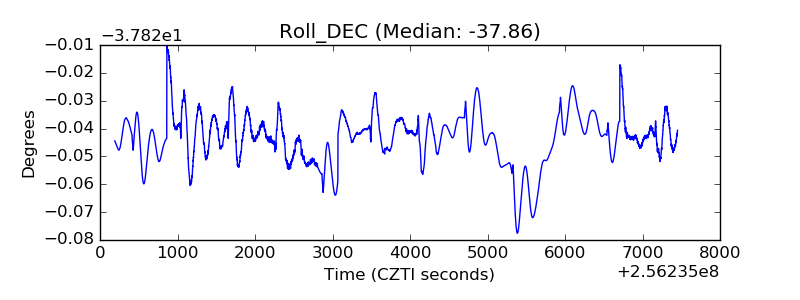 |
| _Roll_RA | 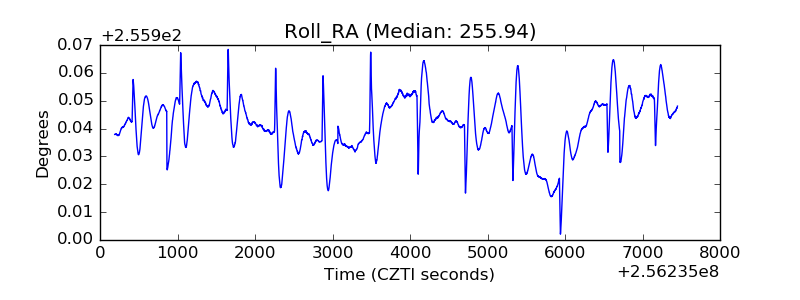 |
| Veto Counter | 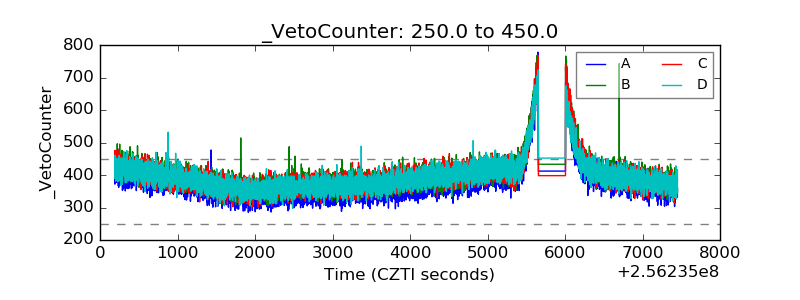 |