| Param | Original file | Final file |
|---|---|---|
| Filename | modeM0/AS1G08_041T01_9000001892_12872cztM0_level2.evt | modeM0/AS1G08_041T01_9000001892_12872cztM0_level2_quad_clean.evt |
| Size (bytes) | 647,470,080 | 84,257,280 |
| Size | 617.5 MB | 80.4 MB |
| Events in quadrant A | 3,948,294 | 513,013 |
| Events in quadrant B | 7,028,371 | 491,142 |
| Events in quadrant C | 3,796,033 | 510,702 |
| Events in quadrant D | 4,298,401 | 485,335 |
| Mode M9 | |||
|---|---|---|---|
| Quadrant | BADHDUFLAG | Total packets | Discarded packets |
| A | 0 | 5 | 0 |
| B | 0 | 5 | 0 |
| C | 0 | 5 | 0 |
| D | 0 | 5 | 0 |
| Mode SS | |||
|---|---|---|---|
| Quadrant | BADHDUFLAG | Total packets | Discarded packets |
| A | 0 | 162 | 0 |
| B | 0 | 162 | 0 |
| C | 0 | 162 | 0 |
| D | 0 | 162 | 0 |
| Mode M0 | |||
|---|---|---|---|
| Quadrant | BADHDUFLAG | Total packets | Discarded packets |
| A | 0 | 16963 | 3 |
| B | 0 | 26080 | 2 |
| C | 0 | 16635 | 2 |
| D | 0 | 18239 | 2 |
| Quadrant | Total seconds | Saturated seconds | Saturation percentage |
|---|---|---|---|
| A | 7928 | 261 | 3.292129% |
| B | 7928 | 1460 | 18.415742% |
| C | 7928 | 124 | 1.564077% |
| D | 7928 | 237 | 2.989405% |
Noise dominated data is calculated using 1-second bins in cleaned event files. If a bin has >2000 counts, and if more than 50% of those come from <1% of pixels, then it is considered to be noise-dominated and hence unusable.
| Quadrant | # 1 sec bins | Bins with >0 counts | Bins with >2000 counts | High rate bins dominated by noise | Noise dominated (total time) | Noise dominated (detector-on time) | Marked lightcurve |
|---|---|---|---|---|---|---|---|
| A | 8428 | 7931 | 1 | 1 | 0.01% | 0.01% | 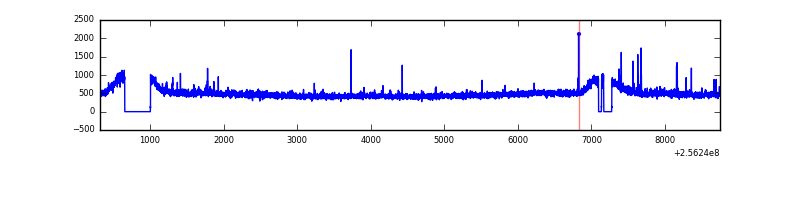 |
| B | 8428 | 7931 | 854 | 854 | 10.13% | 10.77% | 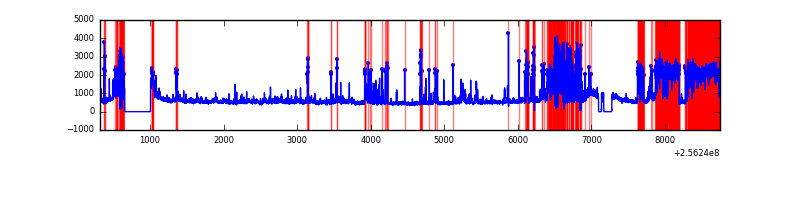 |
| C | 8428 | 7931 | 0 | 0 | 0.00% | 0.00% | 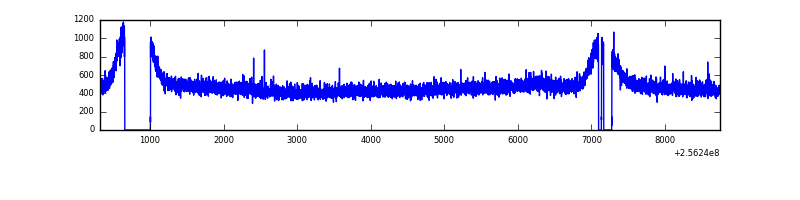 |
| D | 8428 | 7931 | 102 | 102 | 1.21% | 1.29% | 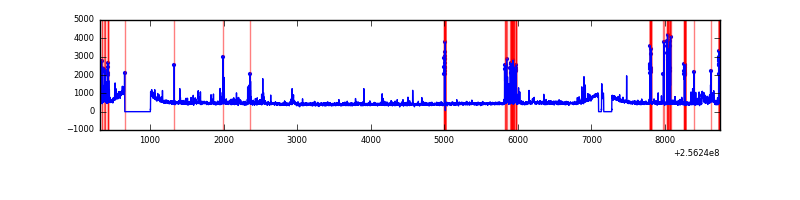 |
Top three noisy pixels from each quadrant. If the there are fewer than three noisy pixels in the level2.evt file, extra rows are filled as -1
| Pixel properties | Quadrant properties | ||||||
|---|---|---|---|---|---|---|---|
| Quadrant | DetID | PixID | Counts | Sigma | Mean | Median | Sigma |
| A | 15 | 174 | 39640 | 190.16 | 998 | 972 | 203.3 |
| A | 8 | 15 | 15754 | 72.7 | 998 | 972 | 203.3 |
| A | 12 | 189 | 13970 | 63.92 | 998 | 972 | 203.3 |
| B | 0 | 85 | 1913986 | 10754.35 | 925 | 902 | 177.9 |
| B | 4 | 239 | 941567 | 5287.92 | 925 | 902 | 177.9 |
| B | 0 | 219 | 288672 | 1617.69 | 925 | 902 | 177.9 |
| C | 8 | 128 | 12526 | 51.1 | 967 | 972 | 226.1 |
| C | 13 | 61 | 7166 | 27.39 | 967 | 972 | 226.1 |
| C | 8 | 112 | 7113 | 27.16 | 967 | 972 | 226.1 |
| D | 1 | 52 | 452805 | 1931.53 | 961 | 933 | 233.9 |
| D | 2 | 14 | 57269 | 240.81 | 961 | 933 | 233.9 |
| D | 2 | 136 | 46862 | 196.32 | 961 | 933 | 233.9 |
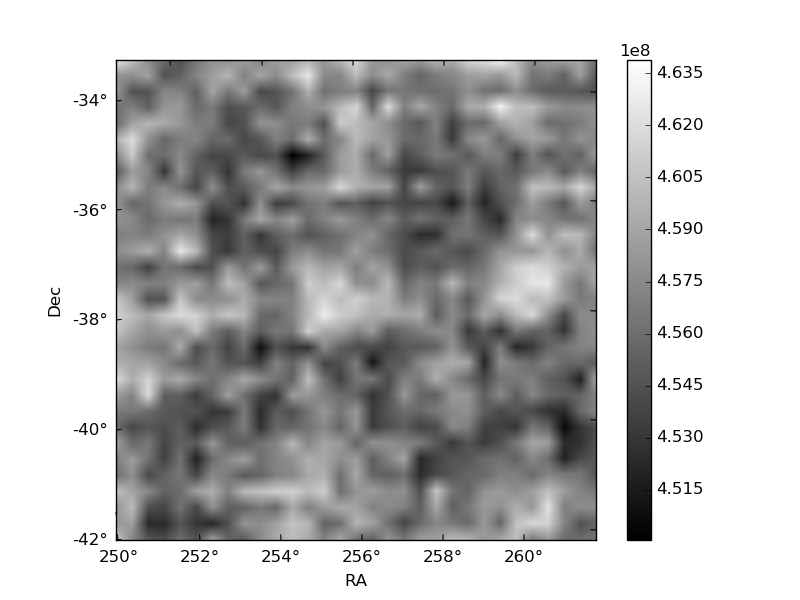
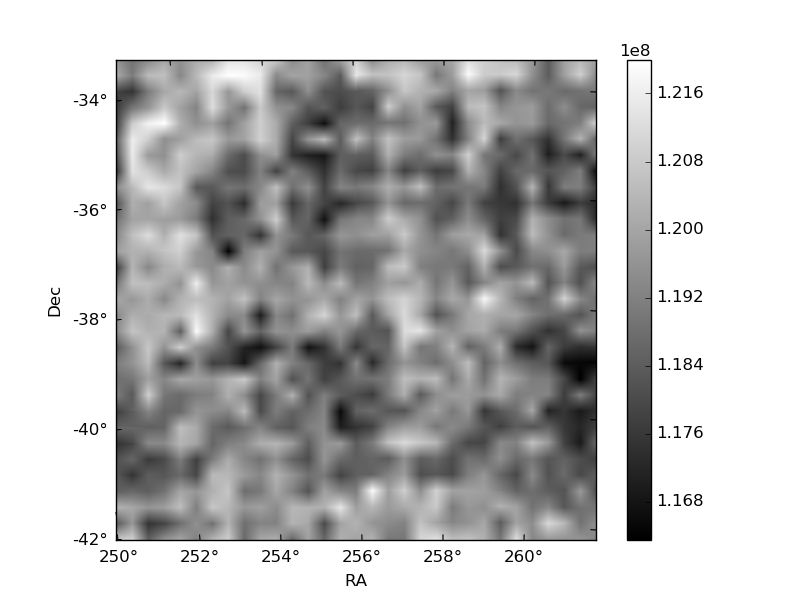
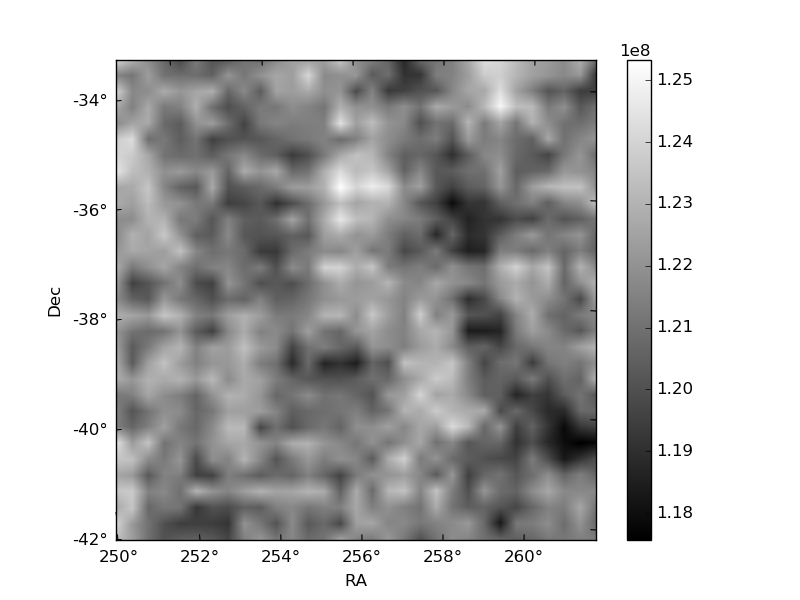
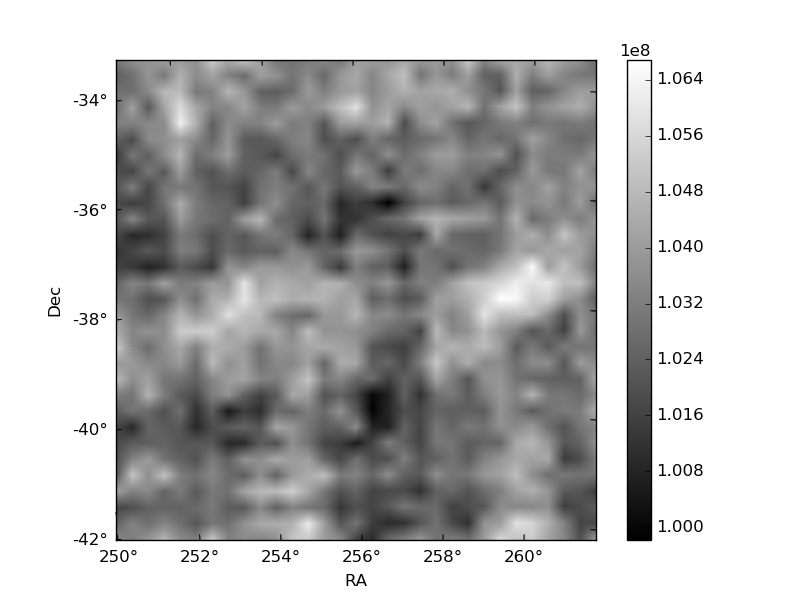
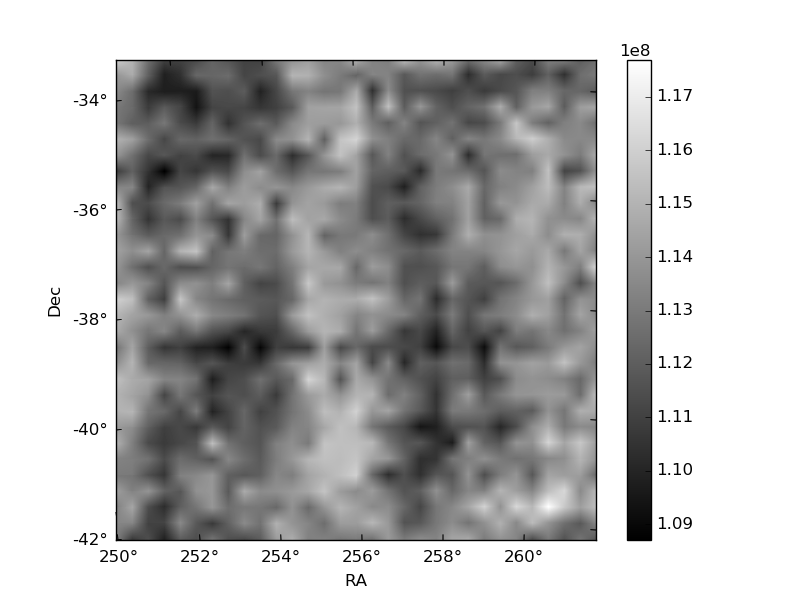
Histogram calculated using DETX and DETY for each event in the final _common_clean file
| Quadrant A | 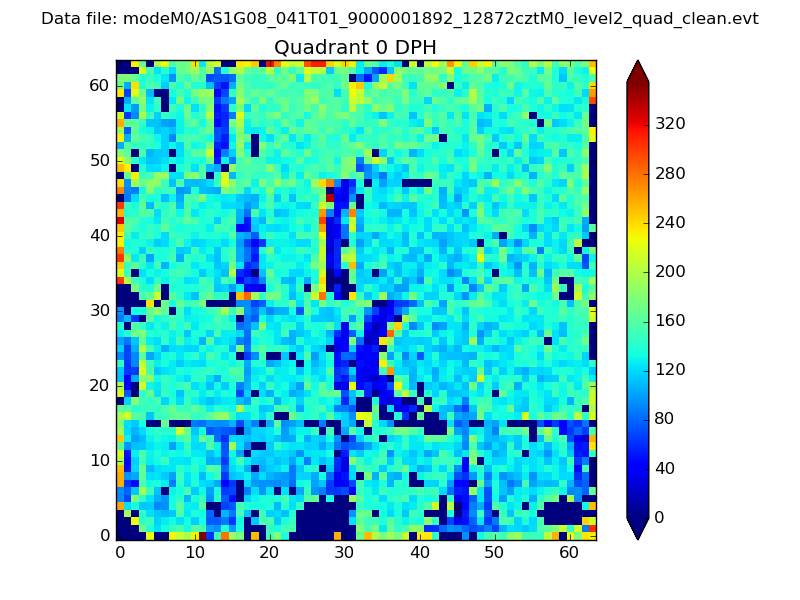 |
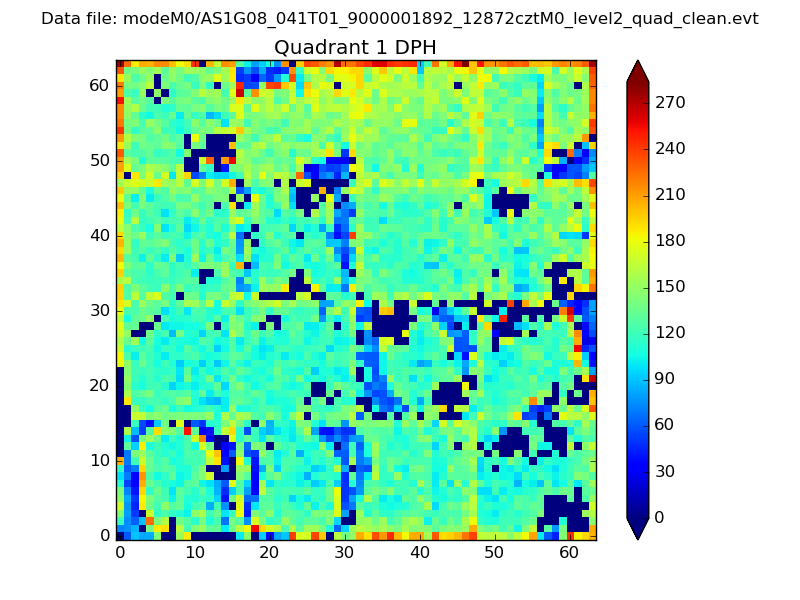 |
Quadrant B |
|---|---|---|---|
| Quadrant D | 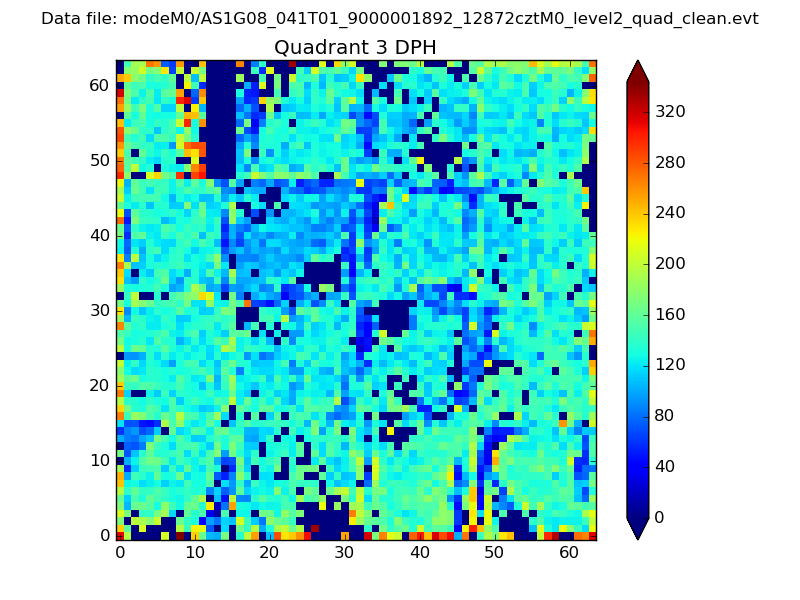 |
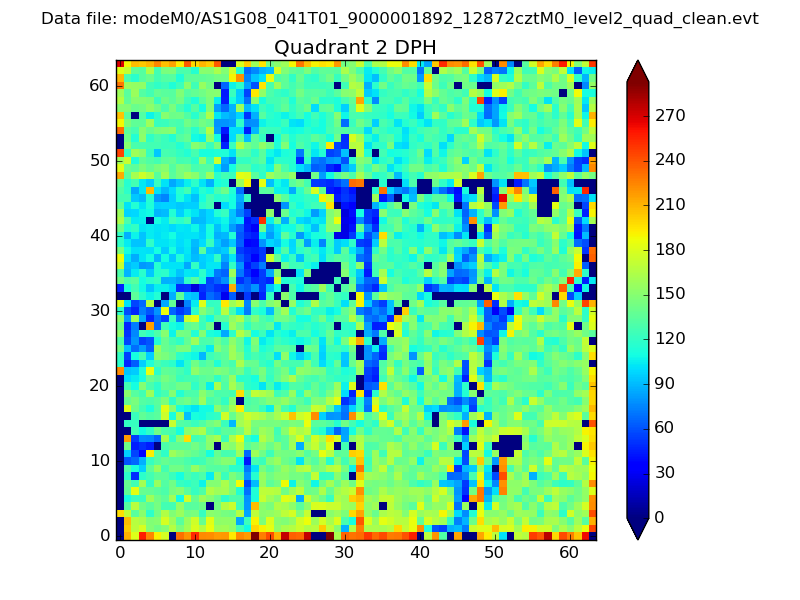 |
Quadrant C |
| Plot type | Count rate plots | Images |
|---|---|---|
| Comparison with Poisson distribution Blue bars denote a histogram of data divided into 1 sec bins. Red curve is a Poisson curve with rate = median count rate of data. |
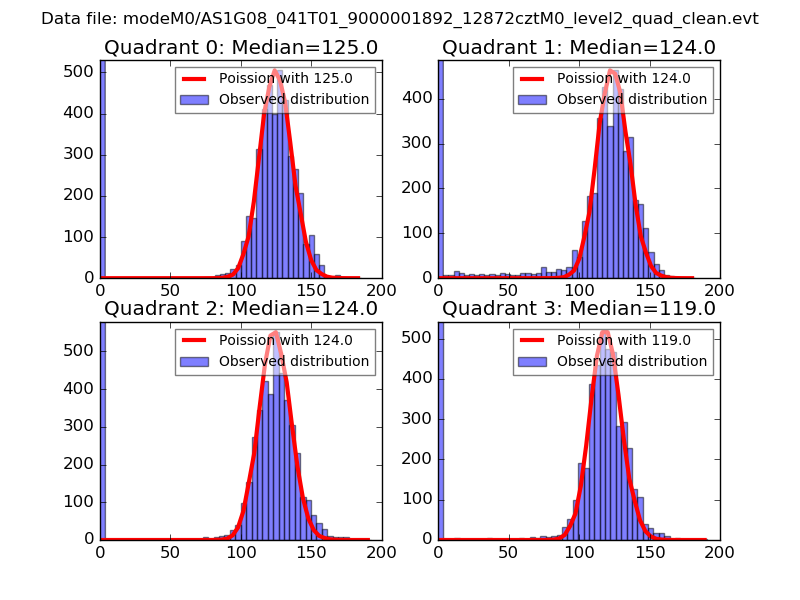 |
 |
| Quadrant-wise count rates Data is divided into 100 sec bins |
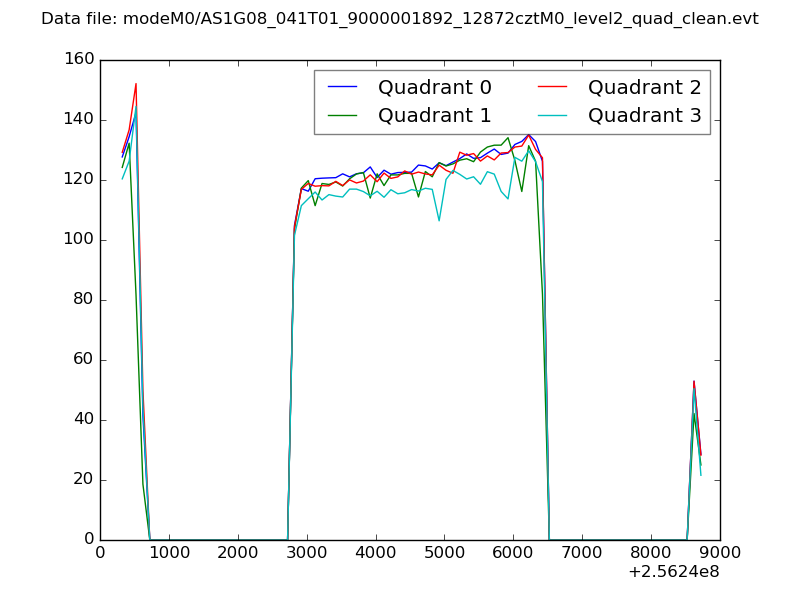 |
|
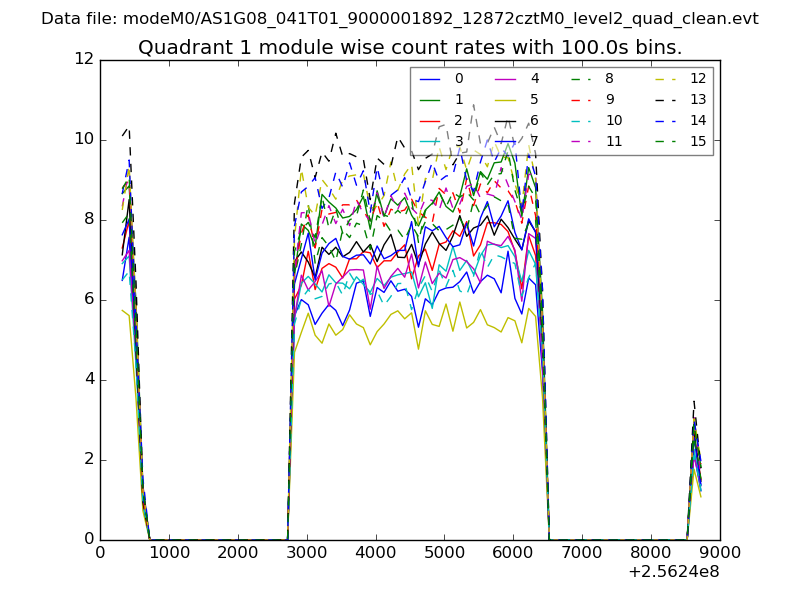
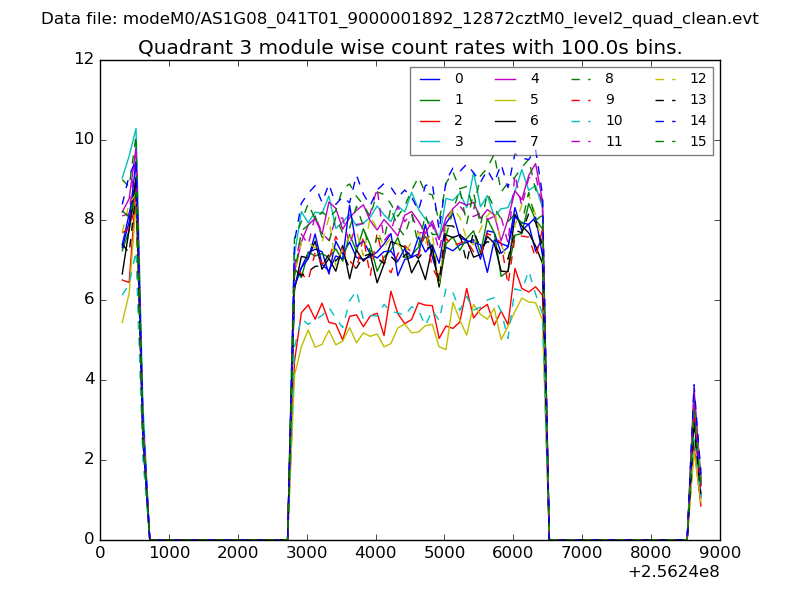
| Module-wise count rates for Quadrant A Data is divided into 100 sec bins |
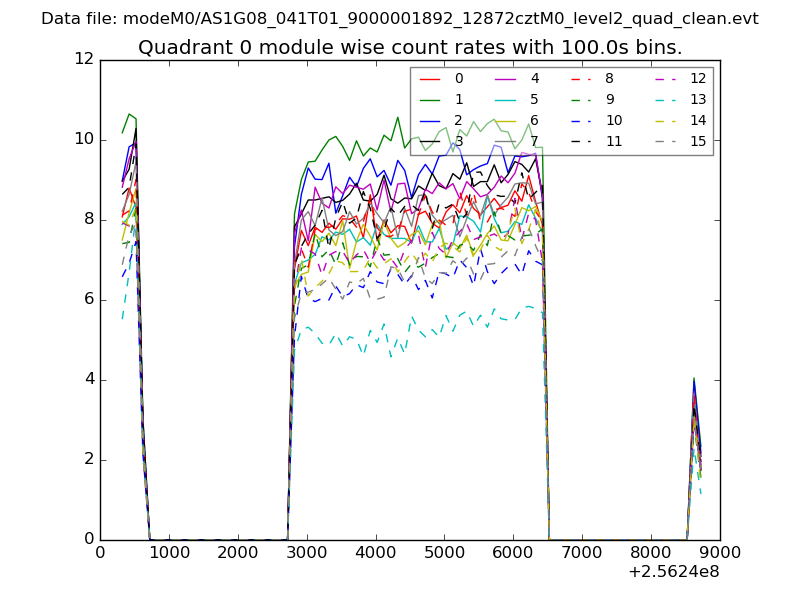 |
 |
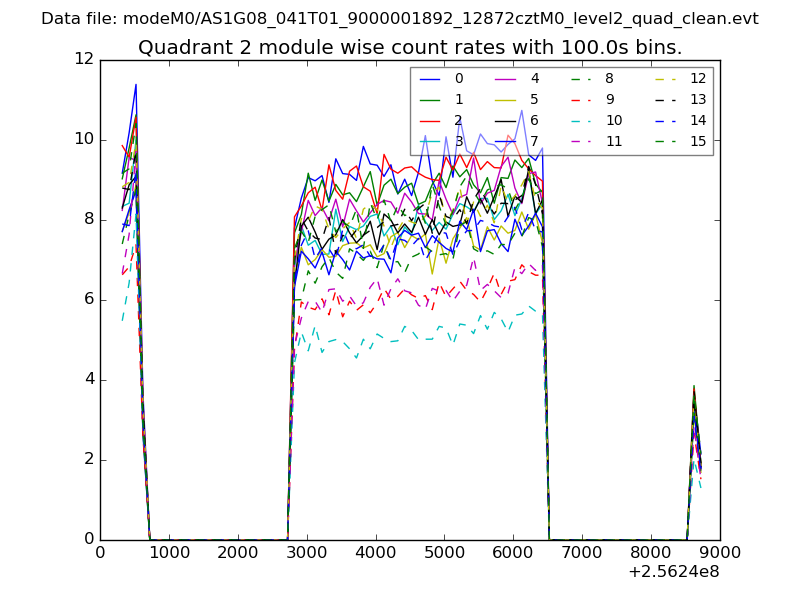
| Module-wise count rates for Quadrant B Data is divided into 100 sec bins |
 |
 |
| Module-wise count rates for Quadrant C Data is divided into 100 sec bins |
 |
 |
| Module-wise count rates for Quadrant D Data is divided into 100 sec bins |
 |
 |
| Parameter | Plot |
|---|---|
| CZT HV Monitor | 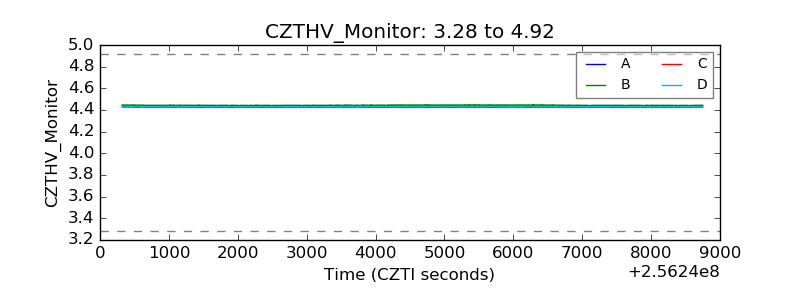 |
| D_VDD |  |
| Temperature 1 | 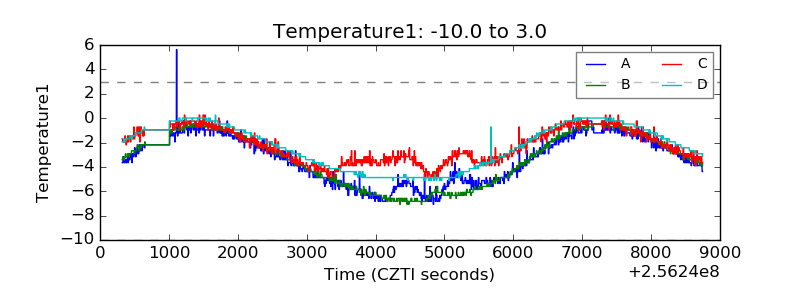 |
| Veto HV Monitor | 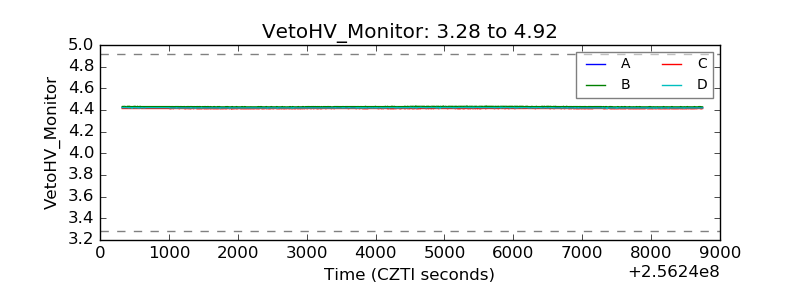 |
| Veto LLD | 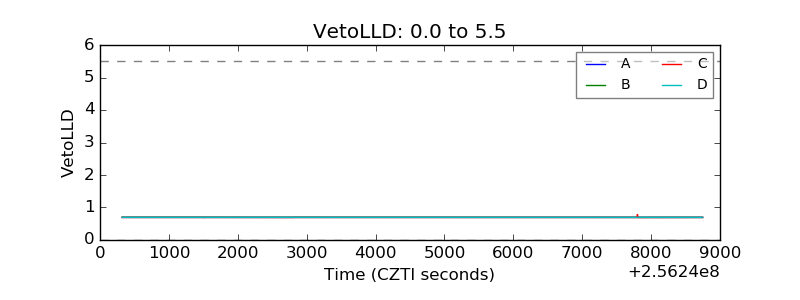 |
| Alpha Counter | 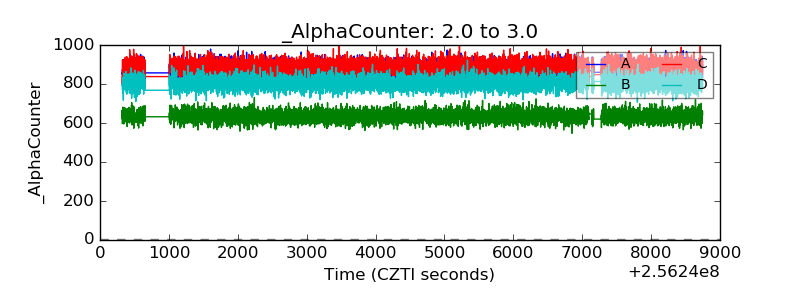 |
| _CPM_Rate | 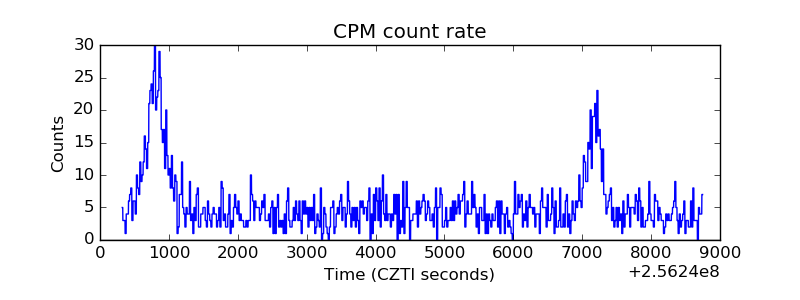 |
| CZT Counter | 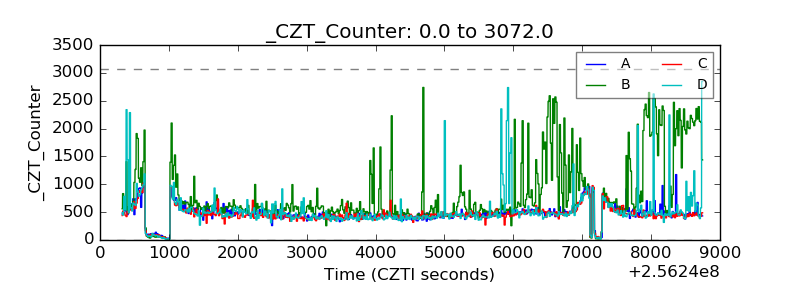 |
| +2.5 Volts monitor |  |
| +5 Volts monitor | 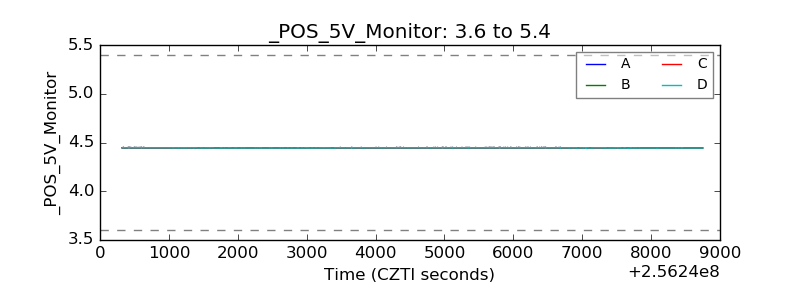 |
| _ROLL_ROT | 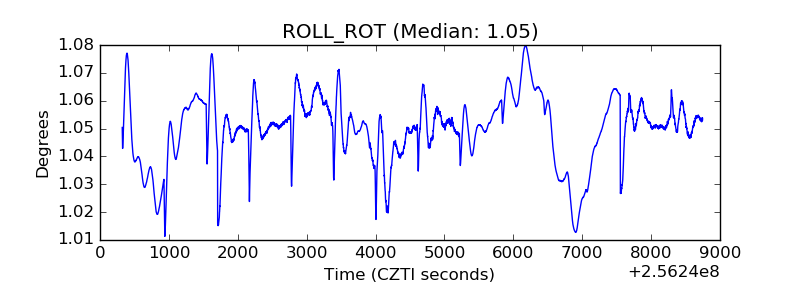 |
| _Roll_DEC | 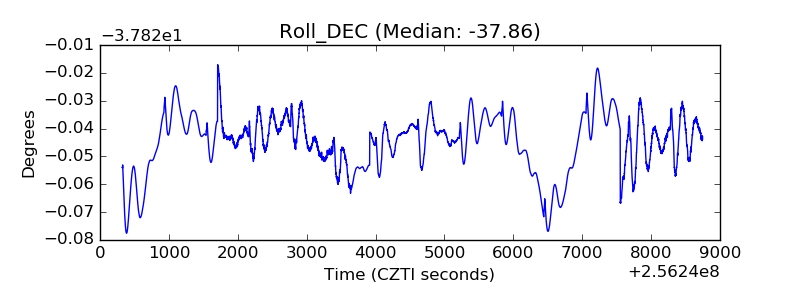 |
| _Roll_RA | 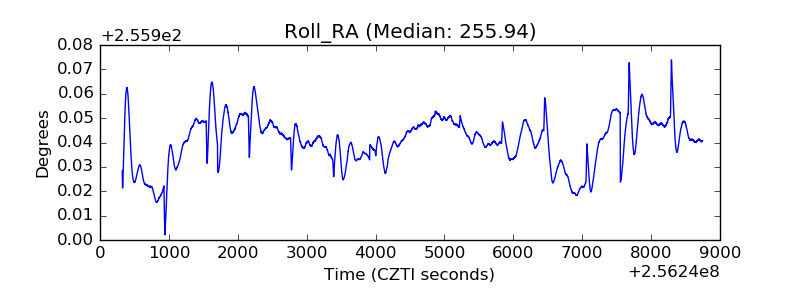 |
| Veto Counter | 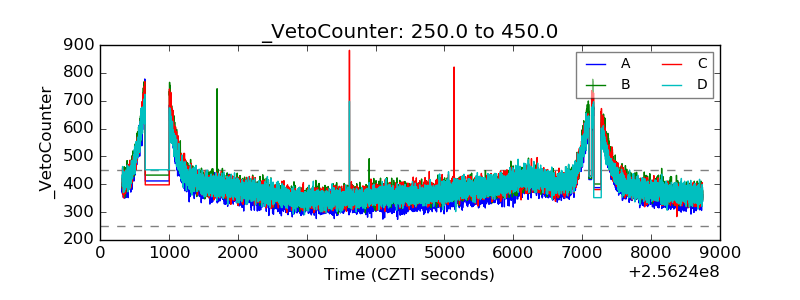 |