| Param | Original file | Final file |
|---|---|---|
| Filename | modeM0/AS1G08_041T01_9000001892_12873cztM0_level2.evt | modeM0/AS1G08_041T01_9000001892_12873cztM0_level2_quad_clean.evt |
| Size (bytes) | 753,935,040 | 86,636,160 |
| Size | 719.0 MB | 82.6 MB |
| Events in quadrant A | 4,429,396 | 531,754 |
| Events in quadrant B | 8,633,892 | 486,406 |
| Events in quadrant C | 3,826,345 | 532,890 |
| Events in quadrant D | 5,388,014 | 502,037 |
| Mode M9 | |||
|---|---|---|---|
| Quadrant | BADHDUFLAG | Total packets | Discarded packets |
| A | 0 | 5 | 0 |
| B | 0 | 5 | 0 |
| C | 0 | 5 | 0 |
| D | 0 | 5 | 0 |
| Mode SS | |||
|---|---|---|---|
| Quadrant | BADHDUFLAG | Total packets | Discarded packets |
| A | 0 | 168 | 0 |
| B | 0 | 168 | 0 |
| C | 0 | 168 | 0 |
| D | 0 | 168 | 0 |
| Mode M0 | |||
|---|---|---|---|
| Quadrant | BADHDUFLAG | Total packets | Discarded packets |
| A | 0 | 18488 | 3 |
| B | 0 | 31167 | 2 |
| C | 0 | 16988 | 2 |
| D | 0 | 21677 | 2 |
| Quadrant | Total seconds | Saturated seconds | Saturation percentage |
|---|---|---|---|
| A | 8200 | 234 | 2.853659% |
| B | 8200 | 2042 | 24.902439% |
| C | 8200 | 82 | 1.000000% |
| D | 8200 | 511 | 6.231707% |
Noise dominated data is calculated using 1-second bins in cleaned event files. If a bin has >2000 counts, and if more than 50% of those come from <1% of pixels, then it is considered to be noise-dominated and hence unusable.
| Quadrant | # 1 sec bins | Bins with >0 counts | Bins with >2000 counts | High rate bins dominated by noise | Noise dominated (total time) | Noise dominated (detector-on time) | Marked lightcurve |
|---|---|---|---|---|---|---|---|
| A | 8701 | 8204 | 45 | 45 | 0.52% | 0.55% | 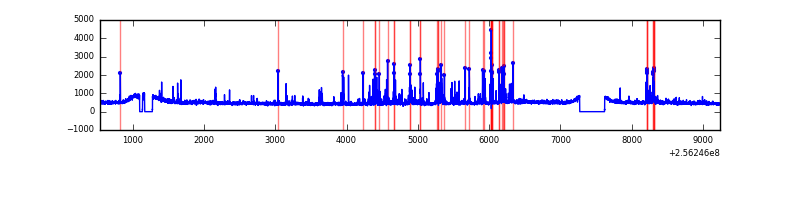 |
| B | 8701 | 8204 | 1289 | 1289 | 14.81% | 15.71% |  |
| C | 8701 | 8204 | 0 | 0 | 0.00% | 0.00% | 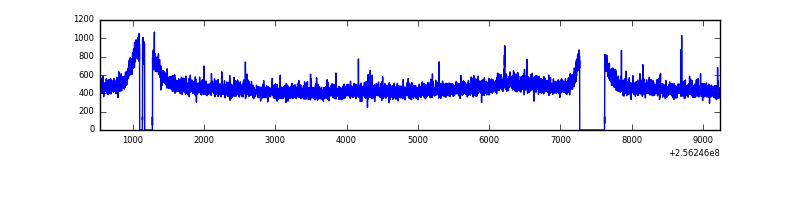 |
| D | 8701 | 8204 | 427 | 427 | 4.91% | 5.20% | 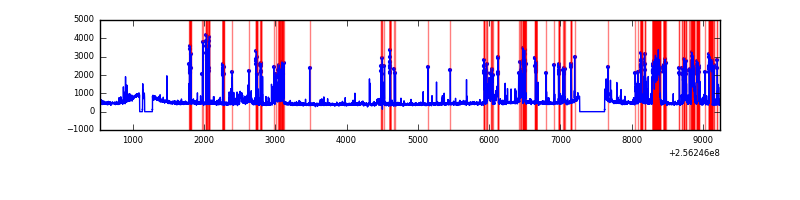 |
Top three noisy pixels from each quadrant. If the there are fewer than three noisy pixels in the level2.evt file, extra rows are filled as -1
| Pixel properties | Quadrant properties | ||||||
|---|---|---|---|---|---|---|---|
| Quadrant | DetID | PixID | Counts | Sigma | Mean | Median | Sigma |
| A | 13 | 248 | 431465 | 2073.22 | 1006 | 981 | 207.6 |
| A | 8 | 15 | 34445 | 161.16 | 1006 | 981 | 207.6 |
| A | 15 | 174 | 33519 | 156.7 | 1006 | 981 | 207.6 |
| B | 0 | 85 | 2933747 | 16848.49 | 908 | 886 | 174.1 |
| B | 4 | 239 | 1724832 | 9903.6 | 908 | 886 | 174.1 |
| B | 0 | 219 | 213073 | 1218.96 | 908 | 886 | 174.1 |
| C | 4 | 112 | 7910 | 30.26 | 976 | 978 | 229.1 |
| C | 13 | 61 | 7052 | 26.52 | 976 | 978 | 229.1 |
| C | 8 | 128 | 5433 | 19.45 | 976 | 978 | 229.1 |
| D | 1 | 52 | 1345089 | 5788.58 | 953 | 924 | 232.2 |
| D | 4 | 95 | 226887 | 973.1 | 953 | 924 | 232.2 |
| D | 2 | 136 | 59215 | 251.03 | 953 | 924 | 232.2 |
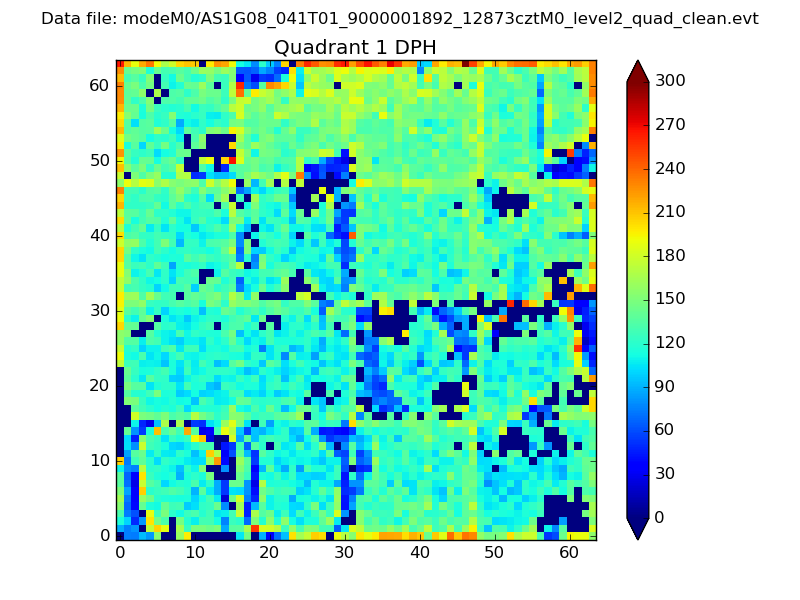
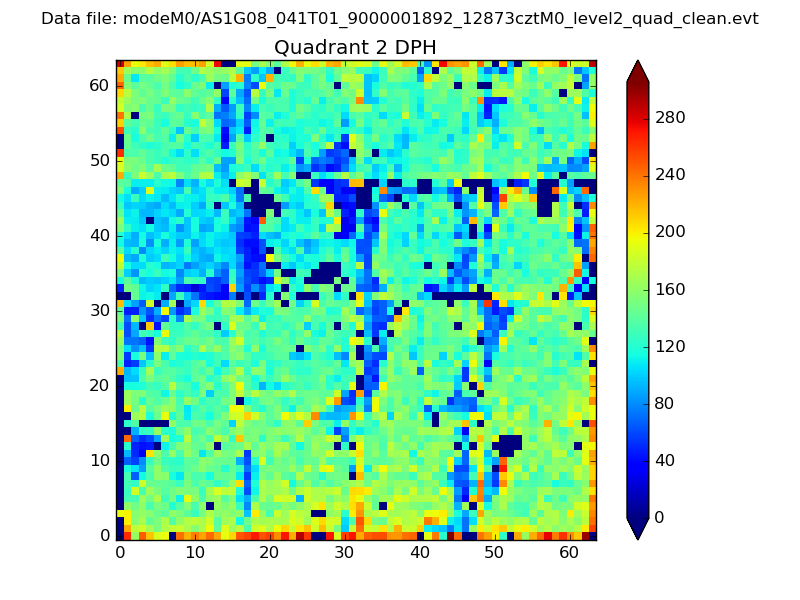
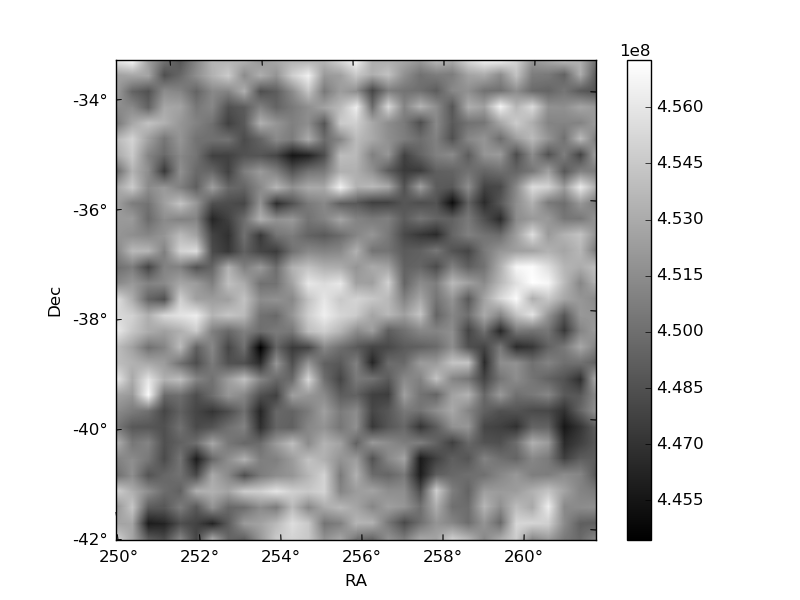
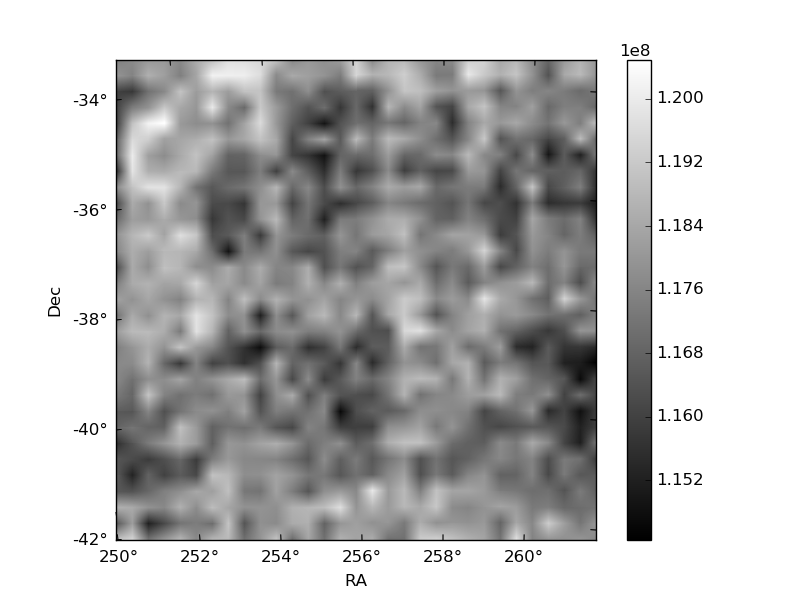
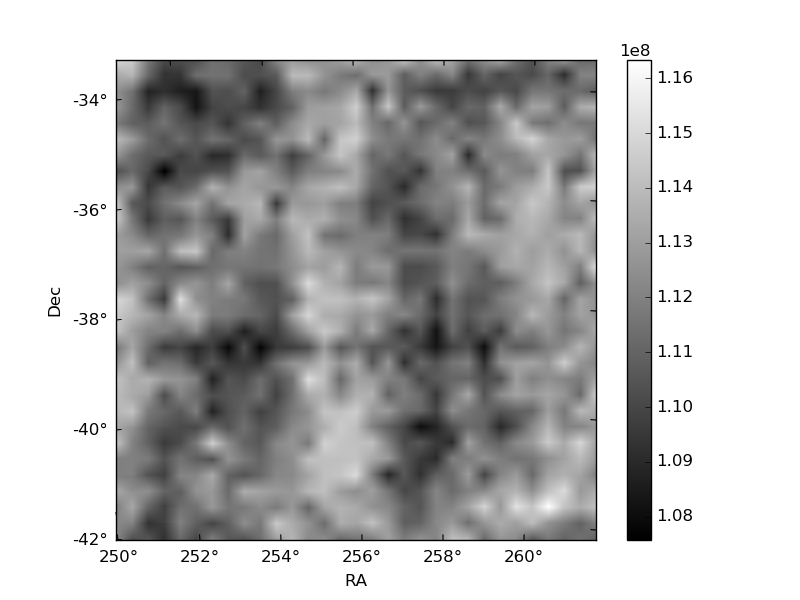
Histogram calculated using DETX and DETY for each event in the final _common_clean file
| Quadrant A | 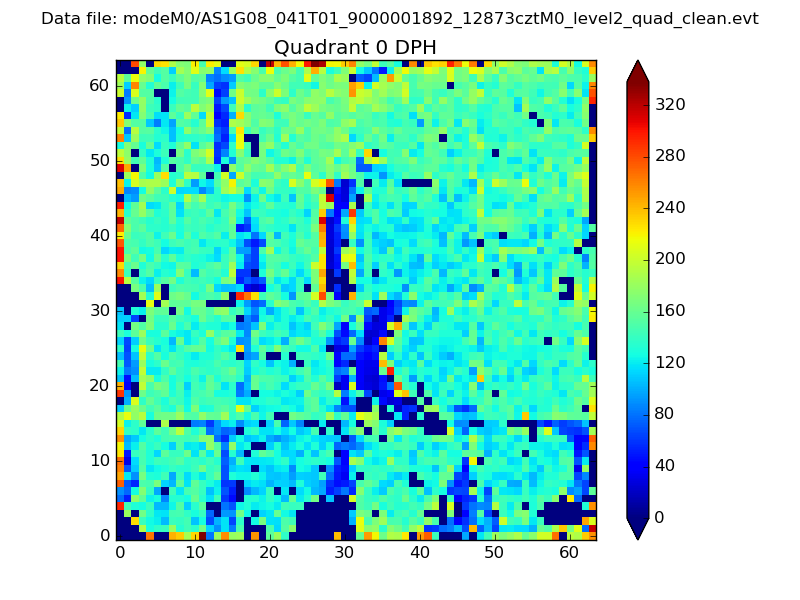 |
 |
Quadrant B |
|---|---|---|---|
| Quadrant D | 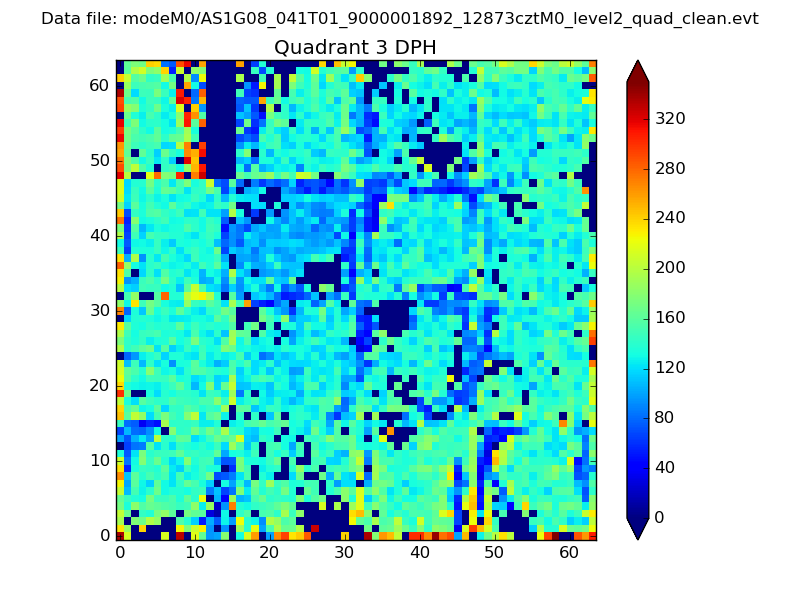 |
 |
Quadrant C |
| Plot type | Count rate plots | Images |
|---|---|---|
| Comparison with Poisson distribution Blue bars denote a histogram of data divided into 1 sec bins. Red curve is a Poisson curve with rate = median count rate of data. |
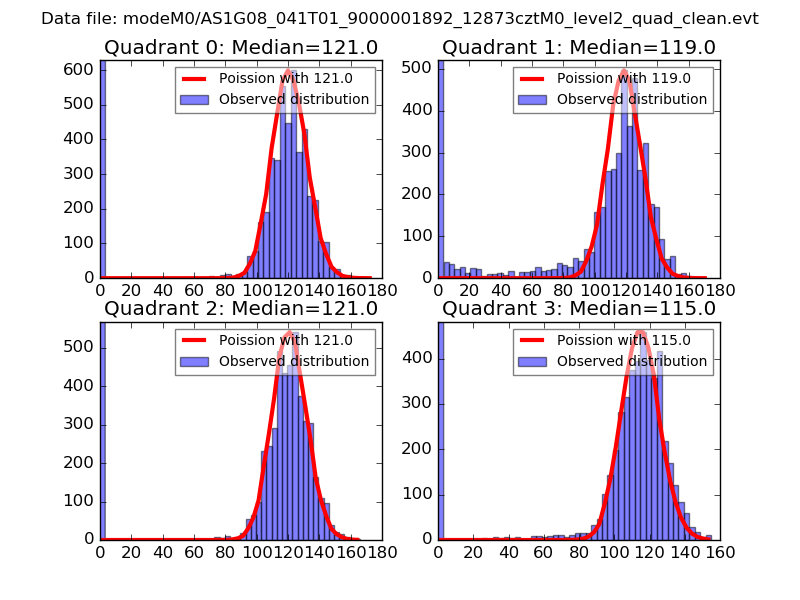 |
 |
| Quadrant-wise count rates Data is divided into 100 sec bins |
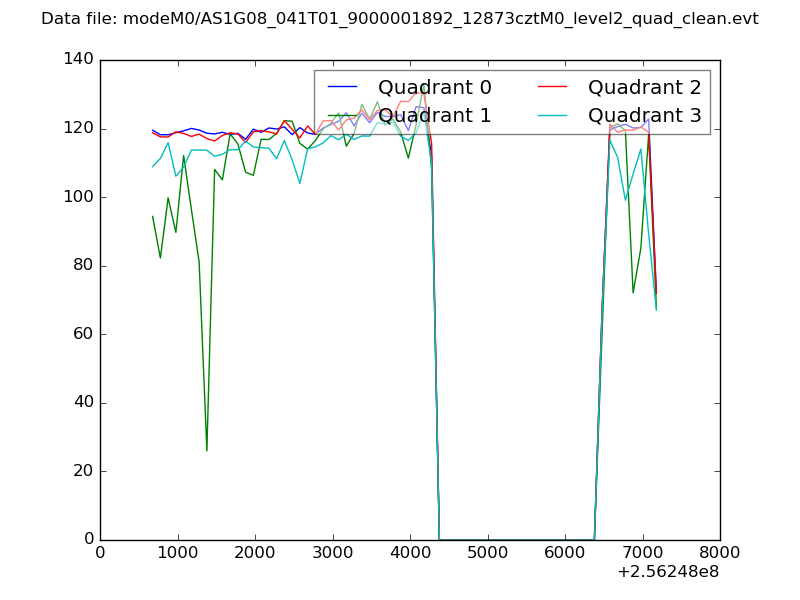 |
|
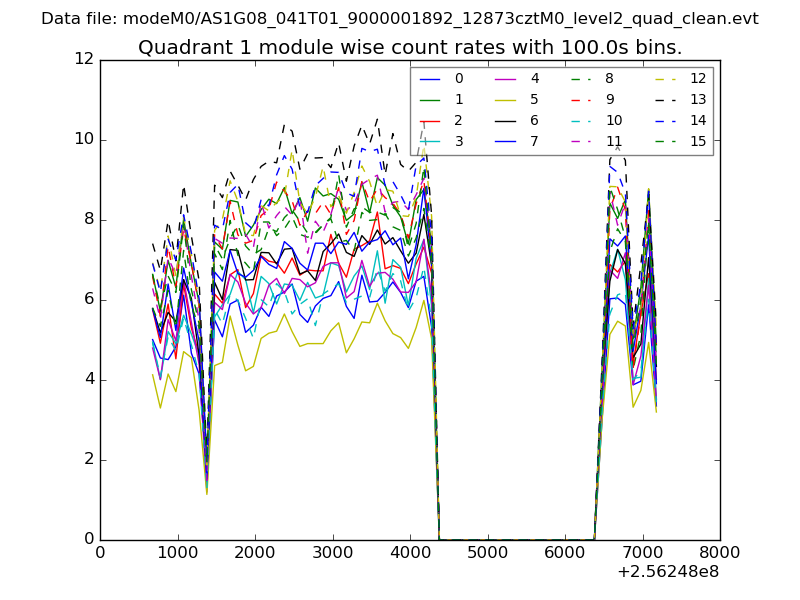
| Module-wise count rates for Quadrant A Data is divided into 100 sec bins |
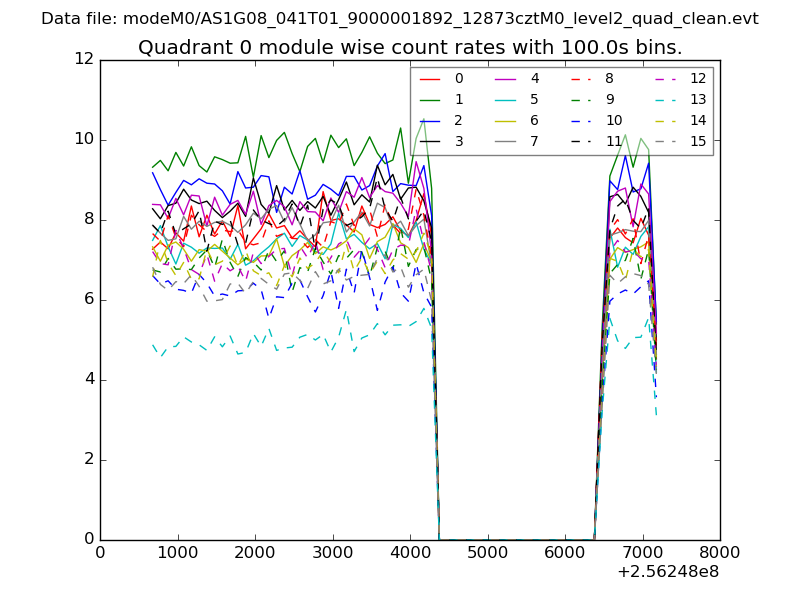 |
 |
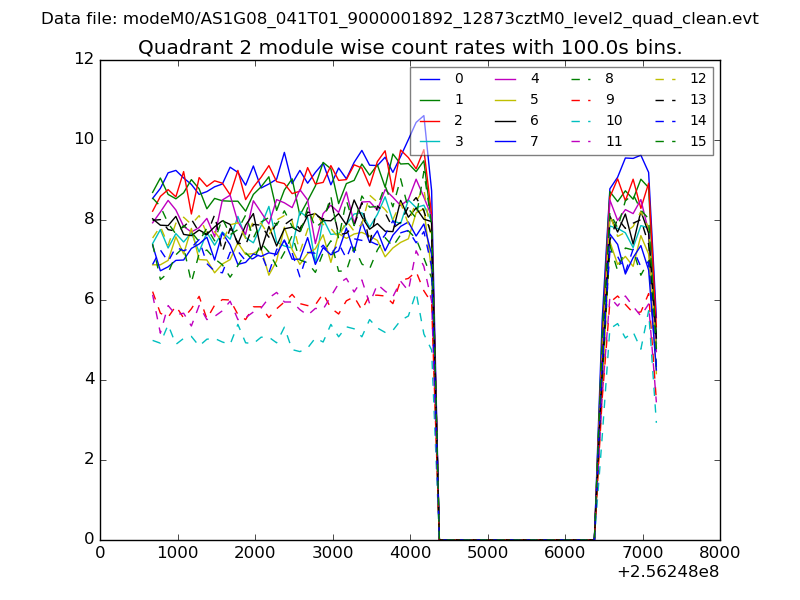
| Module-wise count rates for Quadrant B Data is divided into 100 sec bins |
 |
 |
| Module-wise count rates for Quadrant C Data is divided into 100 sec bins |
 |
 |
| Module-wise count rates for Quadrant D Data is divided into 100 sec bins |
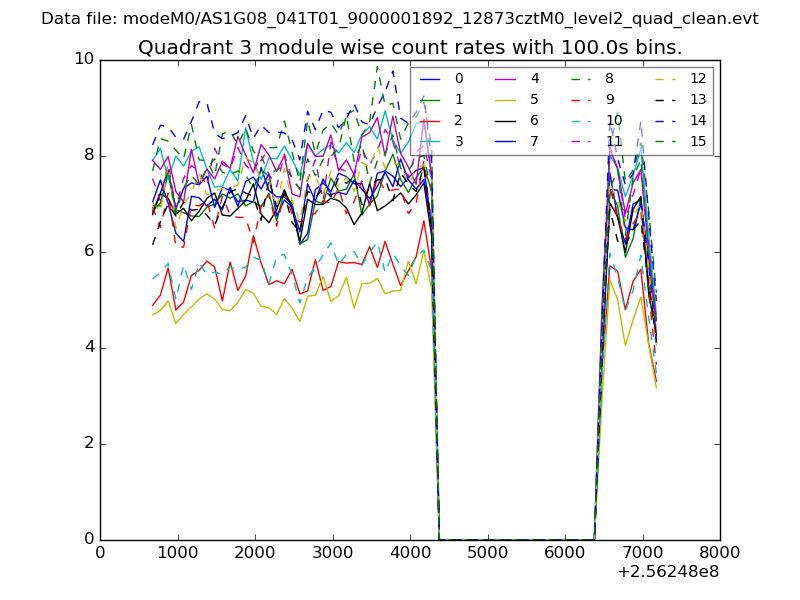 |
 |
| Parameter | Plot |
|---|---|
| CZT HV Monitor | 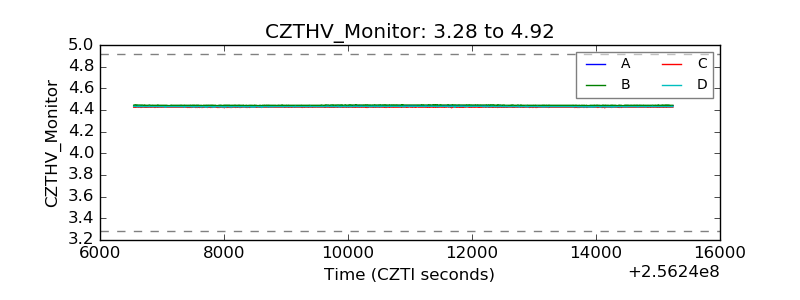 |
| D_VDD | 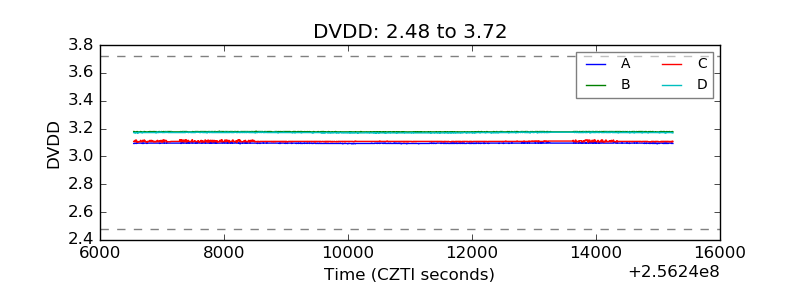 |
| Temperature 1 | 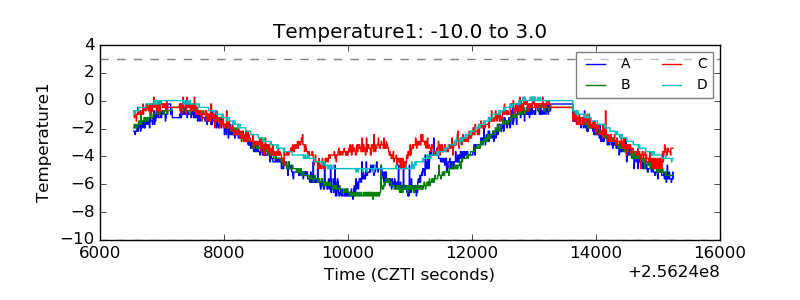 |
| Veto HV Monitor | 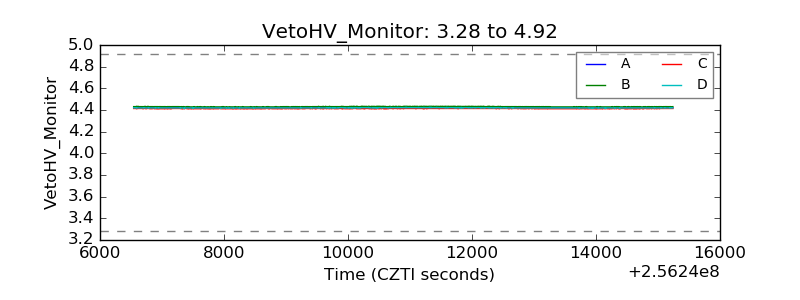 |
| Veto LLD | 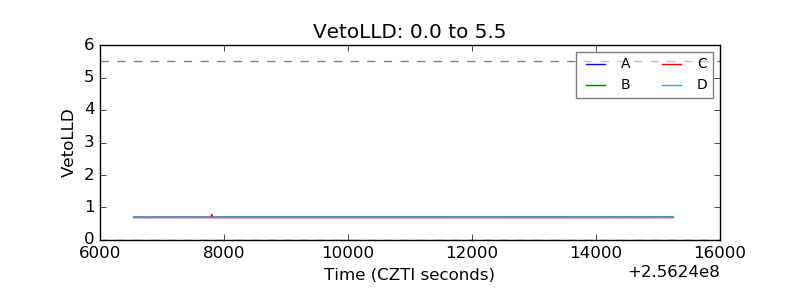 |
| Alpha Counter | 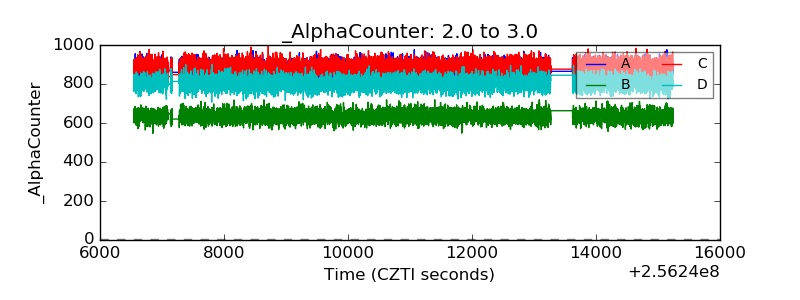 |
| _CPM_Rate | 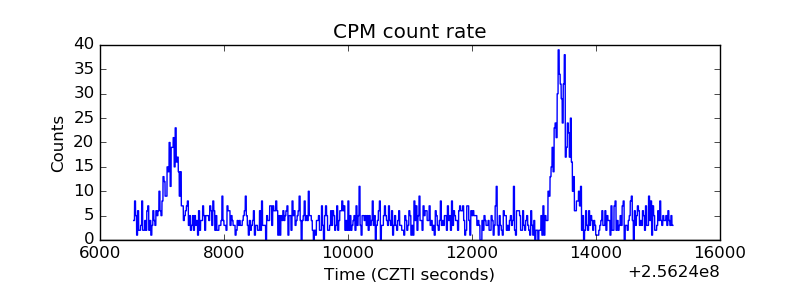 |
| CZT Counter | 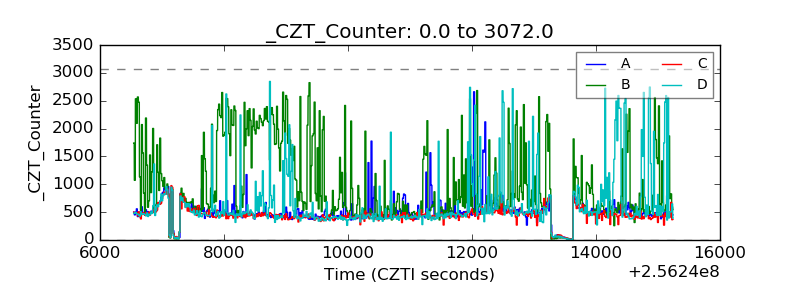 |
| +2.5 Volts monitor |  |
| +5 Volts monitor |  |
| _ROLL_ROT | 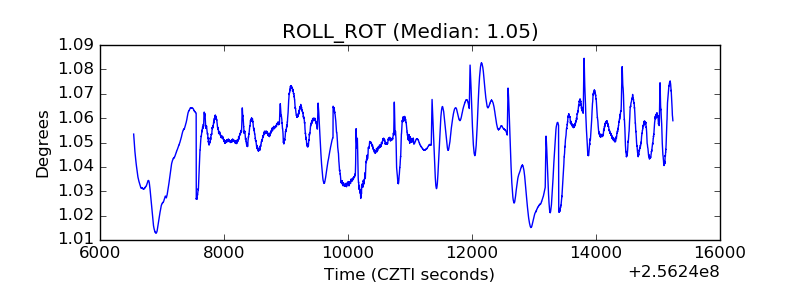 |
| _Roll_DEC | 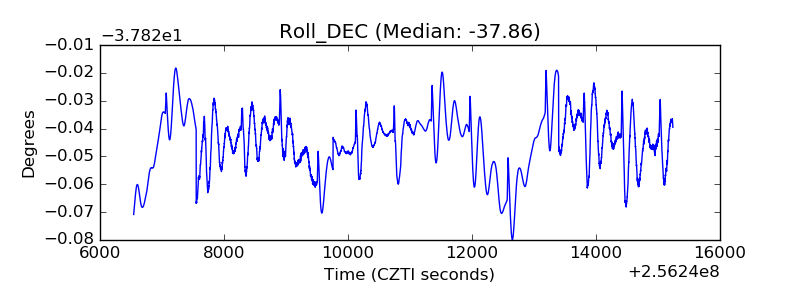 |
| _Roll_RA | 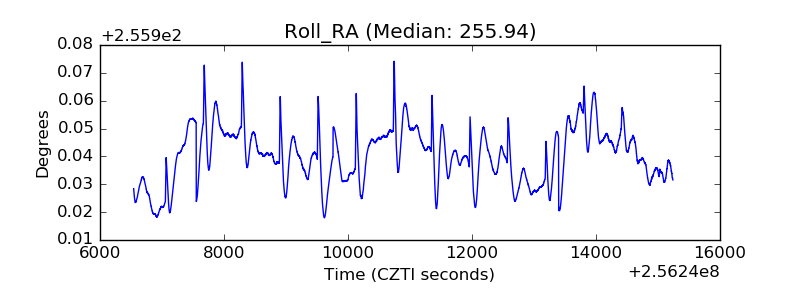 |
| Veto Counter | 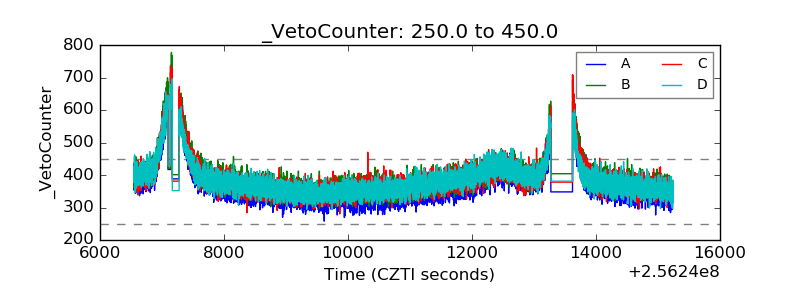 |