| Param | Original file | Final file |
|---|---|---|
| Filename | modeM0/AS1G08_041T01_9000001892_12876cztM0_level2.evt | modeM0/AS1G08_041T01_9000001892_12876cztM0_level2_quad_clean.evt |
| Size (bytes) | 839,931,840 | 98,804,160 |
| Size | 801.0 MB | 94.2 MB |
| Events in quadrant A | 4,149,213 | 640,211 |
| Events in quadrant B | 10,649,346 | 509,218 |
| Events in quadrant C | 3,939,630 | 647,324 |
| Events in quadrant D | 6,122,729 | 602,432 |
| Mode M9 | |||
|---|---|---|---|
| Quadrant | BADHDUFLAG | Total packets | Discarded packets |
| A | 0 | 16 | 0 |
| B | 0 | 16 | 0 |
| C | 0 | 16 | 0 |
| D | 0 | 16 | 0 |
| Mode SS | |||
|---|---|---|---|
| Quadrant | BADHDUFLAG | Total packets | Discarded packets |
| A | 0 | 174 | 0 |
| B | 0 | 174 | 0 |
| C | 0 | 174 | 0 |
| D | 0 | 174 | 0 |
| Mode M0 | |||
|---|---|---|---|
| Quadrant | BADHDUFLAG | Total packets | Discarded packets |
| A | 0 | 17772 | 3 |
| B | 0 | 37404 | 2 |
| C | 0 | 17294 | 2 |
| D | 0 | 23933 | 2 |
| Quadrant | Total seconds | Saturated seconds | Saturation percentage |
|---|---|---|---|
| A | 8526 | 34 | 0.398780% |
| B | 8526 | 2768 | 32.465400% |
| C | 8526 | 29 | 0.340136% |
| D | 8526 | 383 | 4.492142% |
Noise dominated data is calculated using 1-second bins in cleaned event files. If a bin has >2000 counts, and if more than 50% of those come from <1% of pixels, then it is considered to be noise-dominated and hence unusable.
| Quadrant | # 1 sec bins | Bins with >0 counts | Bins with >2000 counts | High rate bins dominated by noise | Noise dominated (total time) | Noise dominated (detector-on time) | Marked lightcurve |
|---|---|---|---|---|---|---|---|
| A | 10137 | 8529 | 4 | 4 | 0.04% | 0.05% | 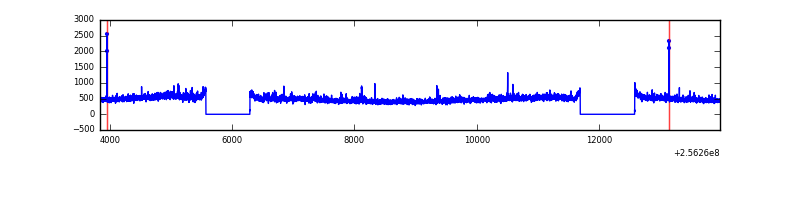 |
| B | 10137 | 8529 | 1939 | 1939 | 19.13% | 22.73% | 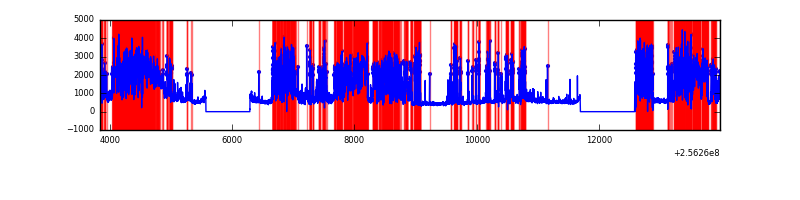 |
| C | 10137 | 8529 | 0 | 0 | 0.00% | 0.00% | 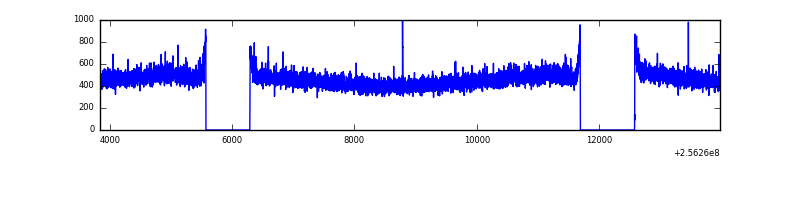 |
| D | 10137 | 8529 | 304 | 304 | 3.00% | 3.56% | 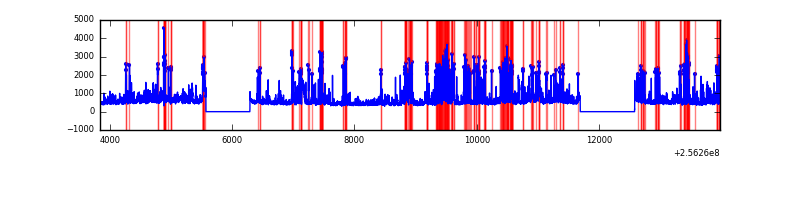 |
Top three noisy pixels from each quadrant. If the there are fewer than three noisy pixels in the level2.evt file, extra rows are filled as -1
| Pixel properties | Quadrant properties | ||||||
|---|---|---|---|---|---|---|---|
| Quadrant | DetID | PixID | Counts | Sigma | Mean | Median | Sigma |
| A | 12 | 189 | 55905 | 259.22 | 1032 | 1008 | 211.8 |
| A | 1 | 162 | 36519 | 167.68 | 1032 | 1008 | 211.8 |
| A | 1 | 178 | 19888 | 89.15 | 1032 | 1008 | 211.8 |
| B | 0 | 85 | 4465124 | 27080.44 | 860 | 838 | 164.9 |
| B | 4 | 239 | 2474008 | 15002.29 | 860 | 838 | 164.9 |
| B | 0 | 219 | 154007 | 929.13 | 860 | 838 | 164.9 |
| C | 13 | 61 | 7384 | 27.1 | 1010 | 1016 | 235.0 |
| C | 14 | 234 | 2794 | 7.57 | 1010 | 1016 | 235.0 |
| C | 3 | 202 | 2441 | 6.06 | 1010 | 1016 | 235.0 |
| D | 1 | 52 | 1724270 | 7172.35 | 990 | 961 | 240.3 |
| D | 8 | 195 | 319382 | 1325.26 | 990 | 961 | 240.3 |
| D | 4 | 95 | 184170 | 762.51 | 990 | 961 | 240.3 |
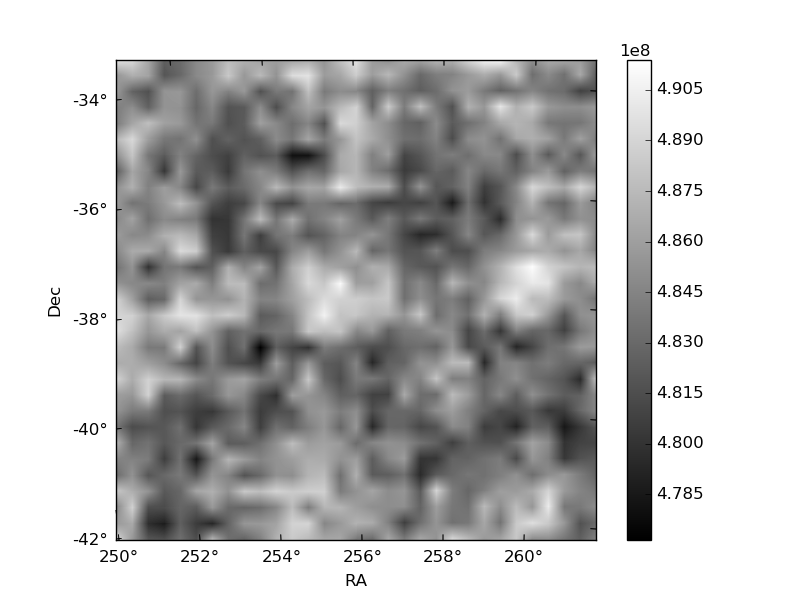
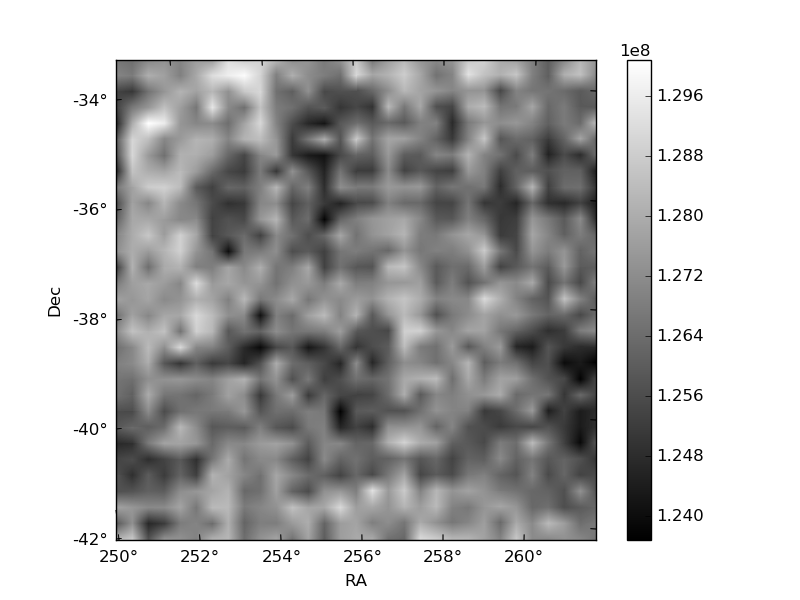
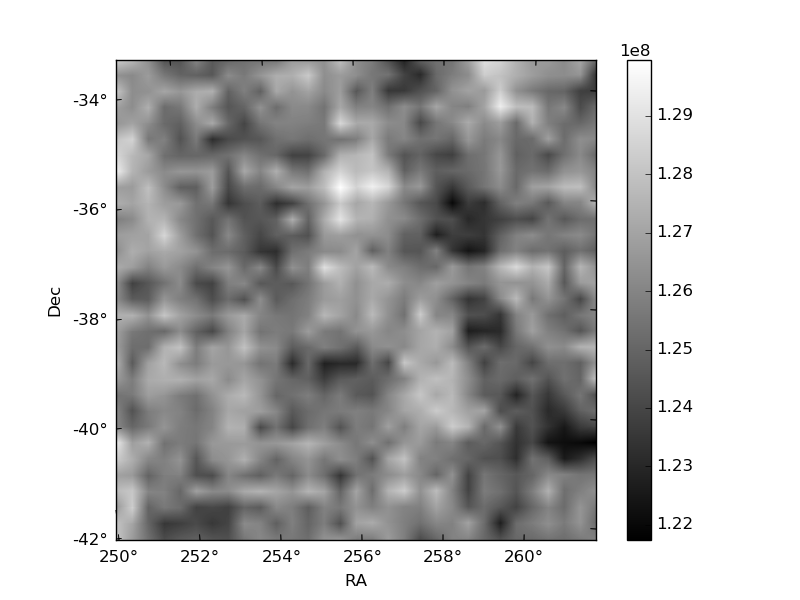
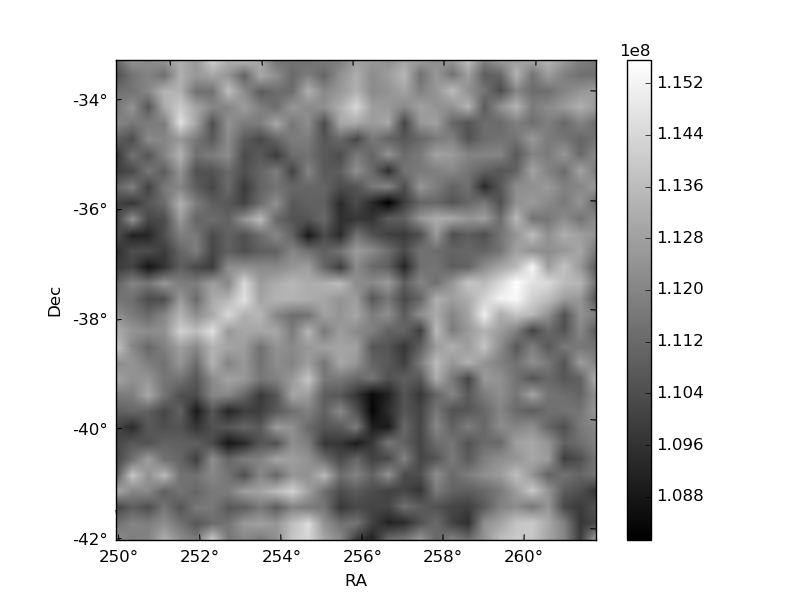
Histogram calculated using DETX and DETY for each event in the final _common_clean file
| Quadrant A | 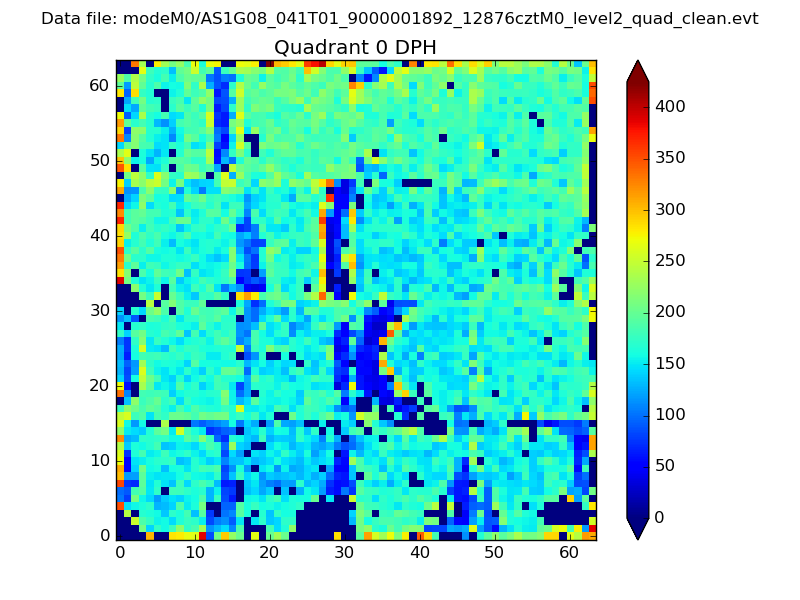 |
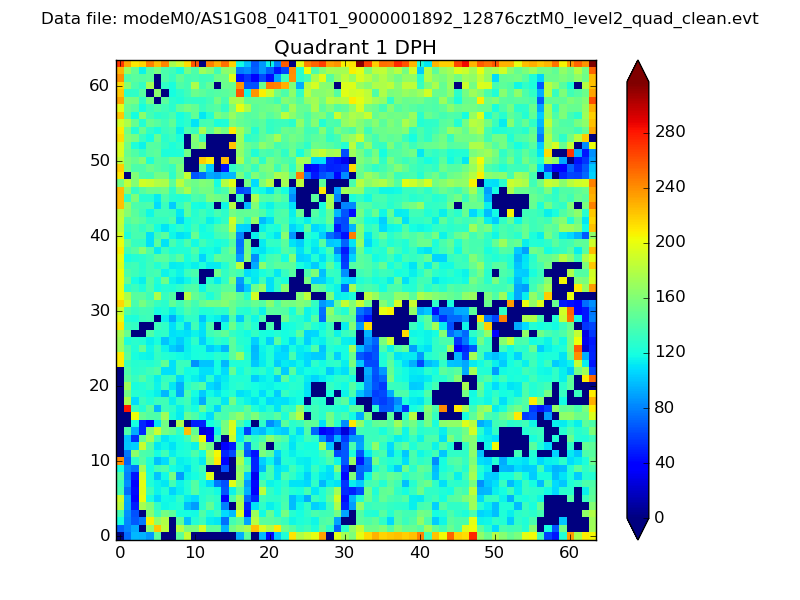 |
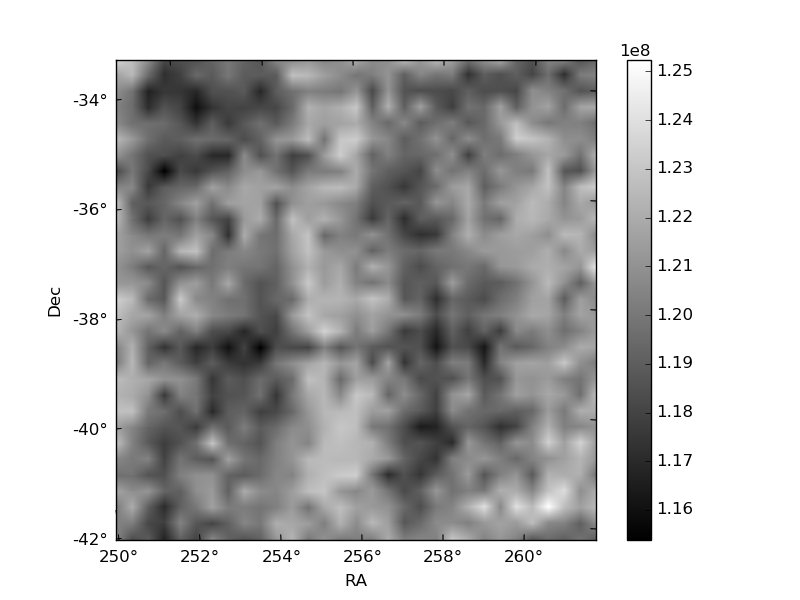
Quadrant B |
|---|---|---|---|
| Quadrant D | 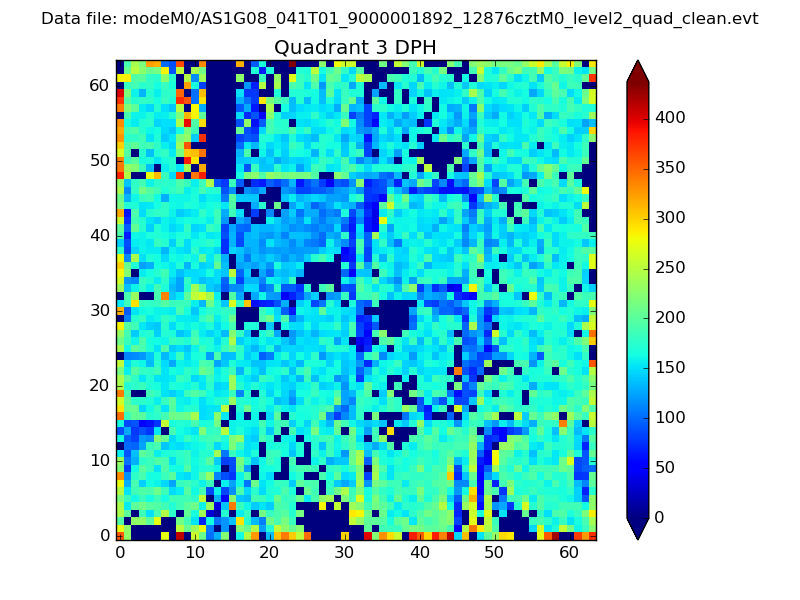 |
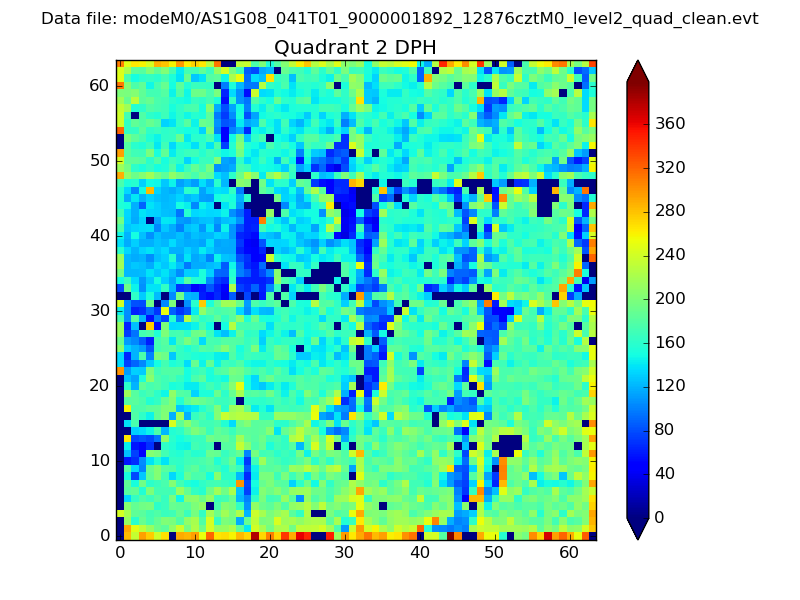 |
Quadrant C |
| Plot type | Count rate plots | Images |
|---|---|---|
| Comparison with Poisson distribution Blue bars denote a histogram of data divided into 1 sec bins. Red curve is a Poisson curve with rate = median count rate of data. |
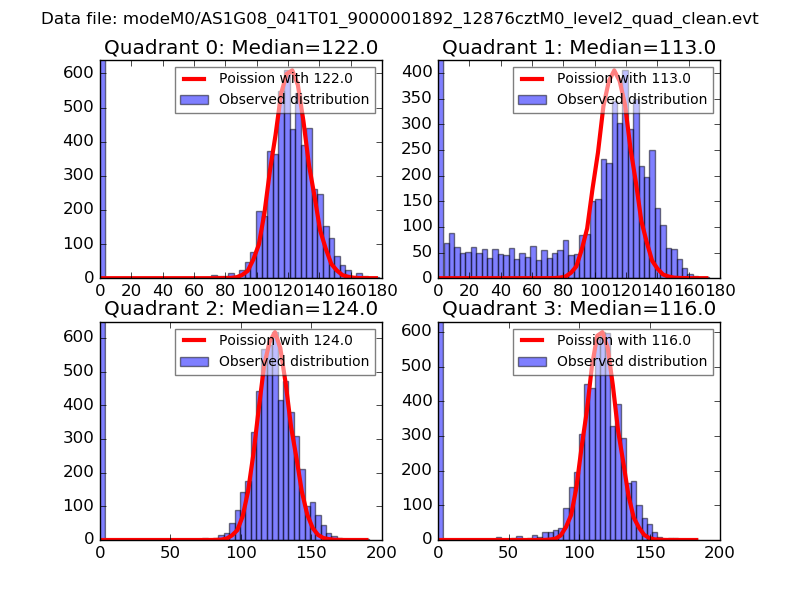 |
 |
| Quadrant-wise count rates Data is divided into 100 sec bins |
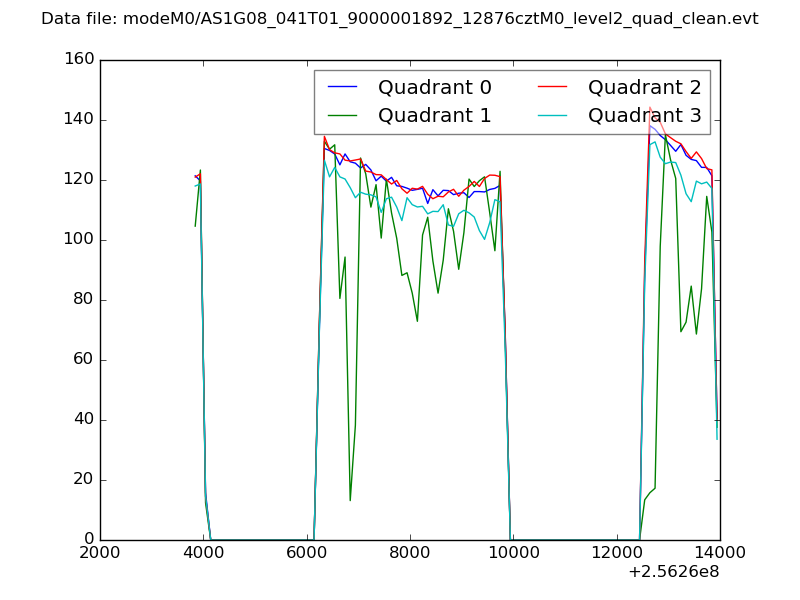 |
|
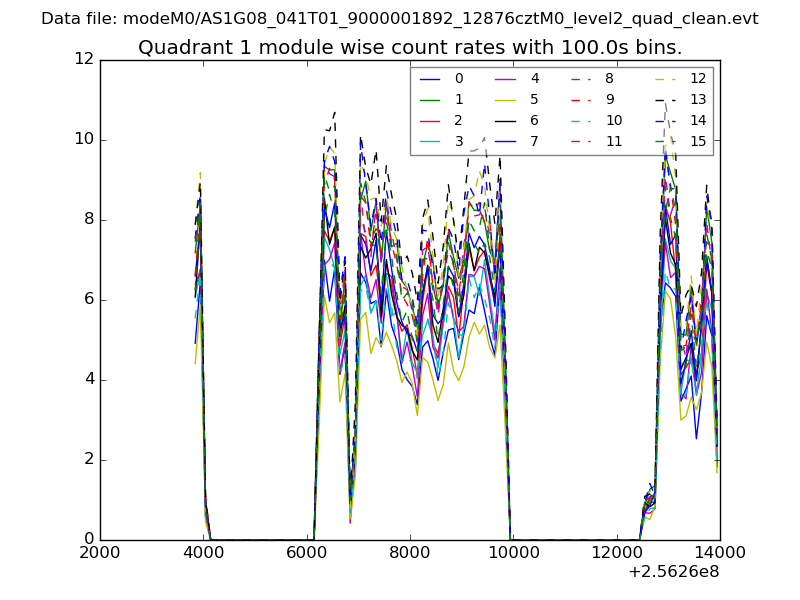
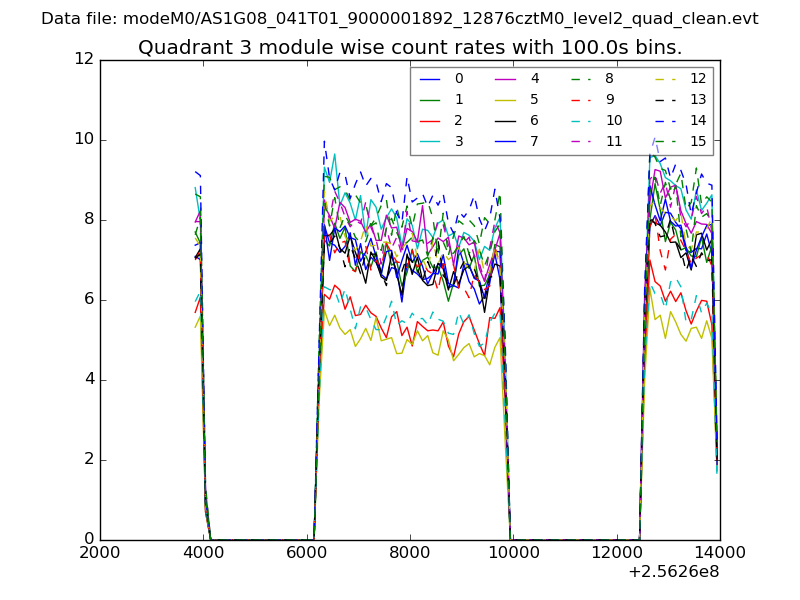
| Module-wise count rates for Quadrant A Data is divided into 100 sec bins |
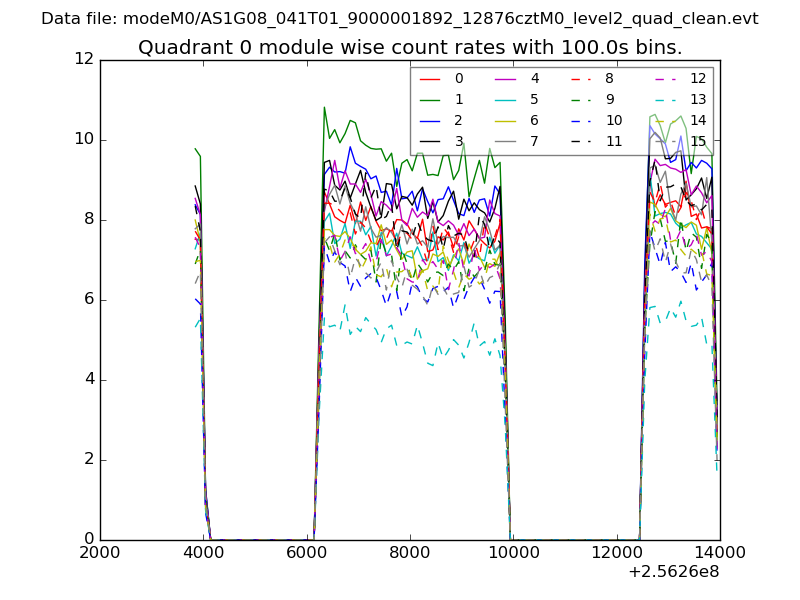 |
 |
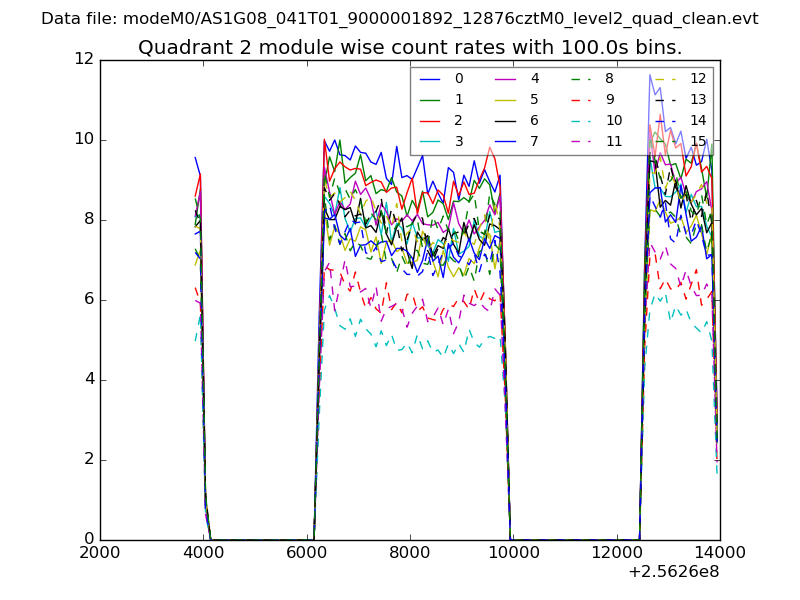
| Module-wise count rates for Quadrant B Data is divided into 100 sec bins |
 |
 |
| Module-wise count rates for Quadrant C Data is divided into 100 sec bins |
 |
 |
| Module-wise count rates for Quadrant D Data is divided into 100 sec bins |
 |
 |
| Parameter | Plot |
|---|---|
| CZT HV Monitor | 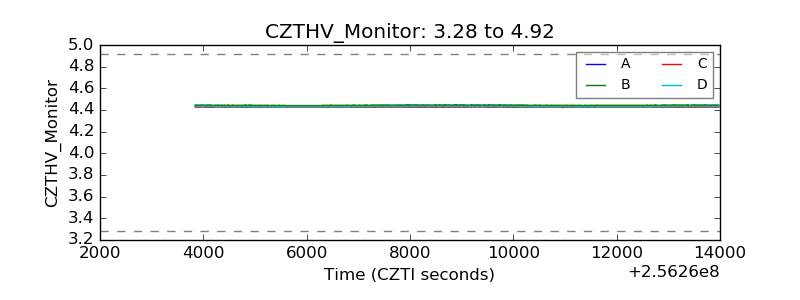 |
| D_VDD | 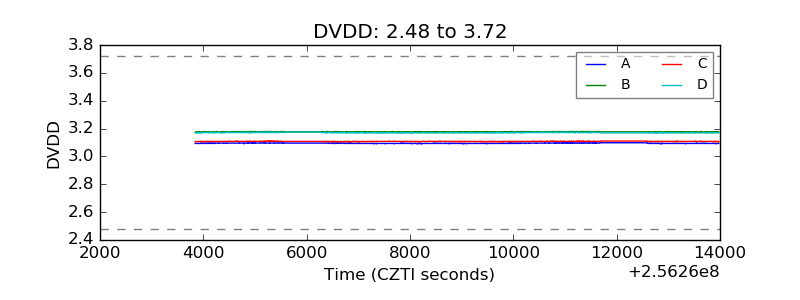 |
| Temperature 1 | 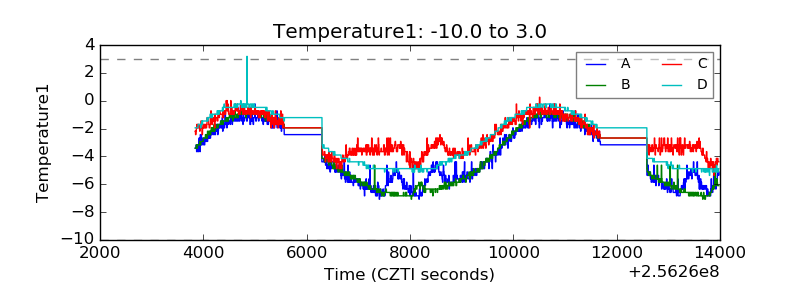 |
| Veto HV Monitor | 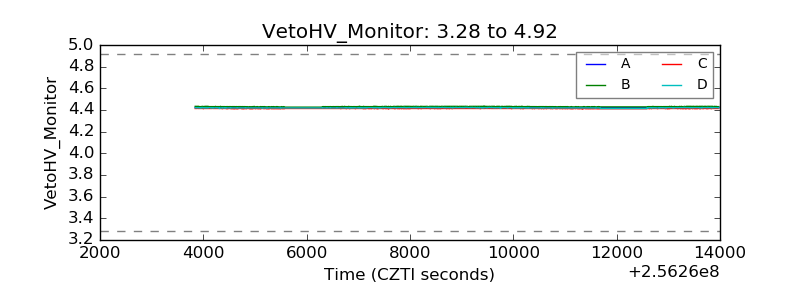 |
| Veto LLD |  |
| Alpha Counter | 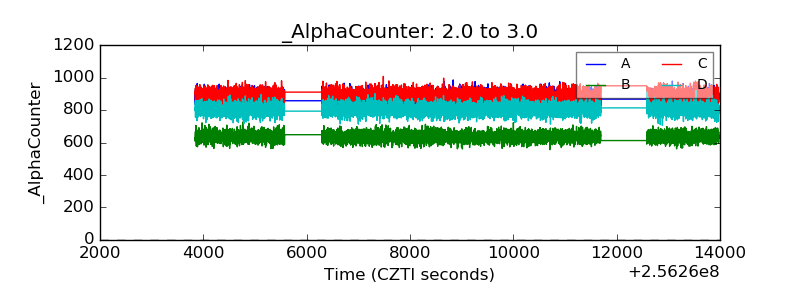 |
| _CPM_Rate | 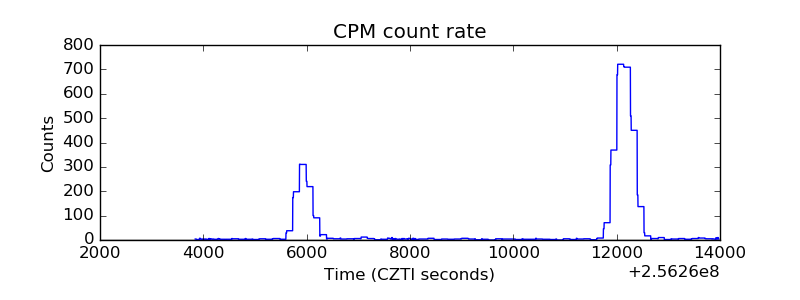 |
| CZT Counter | 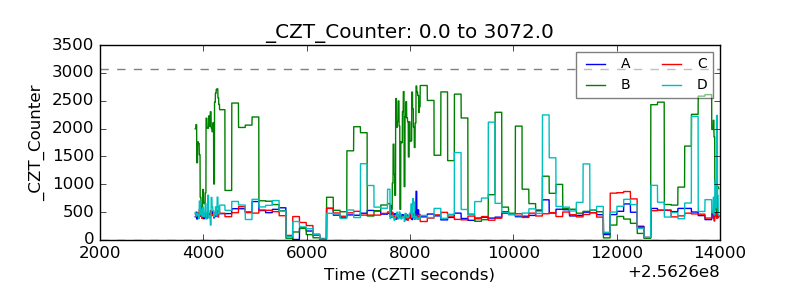 |
| +2.5 Volts monitor |  |
| +5 Volts monitor |  |
| _ROLL_ROT | 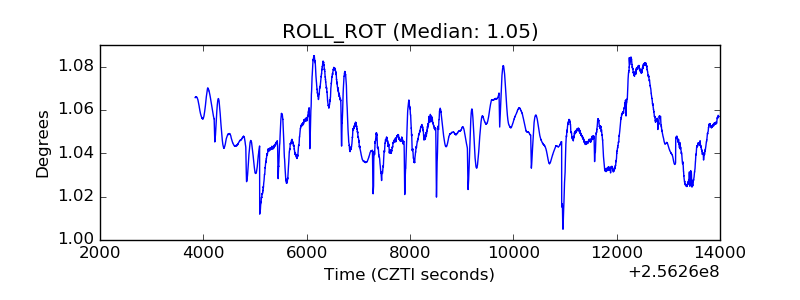 |
| _Roll_DEC | 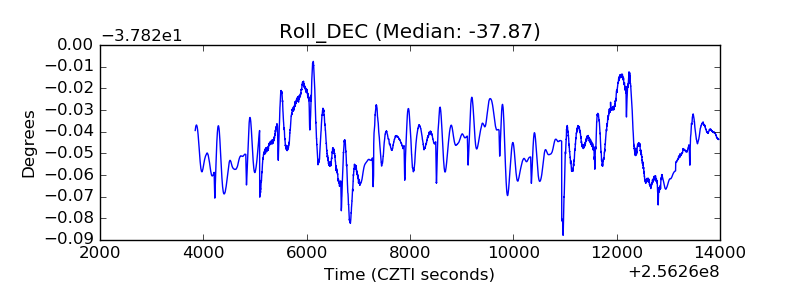 |
| _Roll_RA | 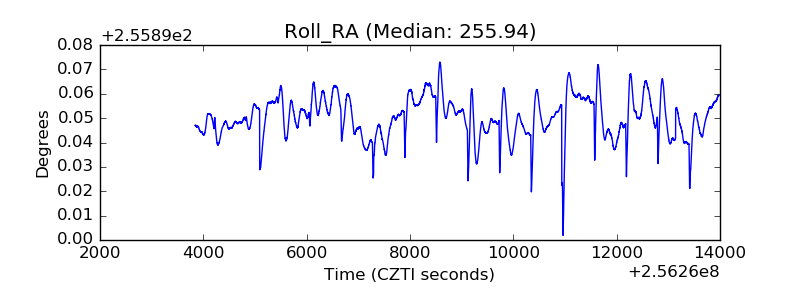 |
| Veto Counter | 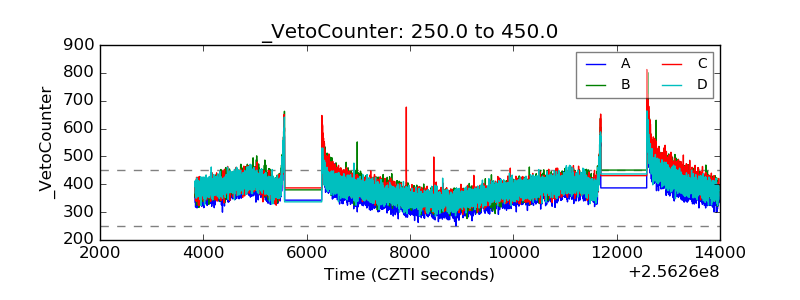 |