| Param | Original file | Final file |
|---|---|---|
| Filename | modeM0/AS1G08_041T01_9000001892_12877cztM0_level2.evt | modeM0/AS1G08_041T01_9000001892_12877cztM0_level2_quad_clean.evt |
| Size (bytes) | 624,919,680 | 87,258,240 |
| Size | 596.0 MB | 83.2 MB |
| Events in quadrant A | 3,222,094 | 572,603 |
| Events in quadrant B | 6,828,628 | 501,053 |
| Events in quadrant C | 3,033,942 | 585,017 |
| Events in quadrant D | 5,396,333 | 525,094 |
| Mode M9 | |||
|---|---|---|---|
| Quadrant | BADHDUFLAG | Total packets | Discarded packets |
| A | 0 | 10 | 0 |
| B | 0 | 10 | 0 |
| C | 0 | 10 | 0 |
| D | 0 | 10 | 0 |
| Mode SS | |||
|---|---|---|---|
| Quadrant | BADHDUFLAG | Total packets | Discarded packets |
| A | 0 | 134 | 0 |
| B | 0 | 134 | 0 |
| C | 0 | 134 | 0 |
| D | 0 | 134 | 0 |
| Mode M0 | |||
|---|---|---|---|
| Quadrant | BADHDUFLAG | Total packets | Discarded packets |
| A | 0 | 13774 | 2 |
| B | 0 | 24771 | 1 |
| C | 0 | 13337 | 1 |
| D | 0 | 20577 | 1 |
| Quadrant | Total seconds | Saturated seconds | Saturation percentage |
|---|---|---|---|
| A | 6565 | 11 | 0.167555% |
| B | 6565 | 1333 | 20.304646% |
| C | 6565 | 7 | 0.106626% |
| D | 6565 | 520 | 7.920792% |
Noise dominated data is calculated using 1-second bins in cleaned event files. If a bin has >2000 counts, and if more than 50% of those come from <1% of pixels, then it is considered to be noise-dominated and hence unusable.
| Quadrant | # 1 sec bins | Bins with >0 counts | Bins with >2000 counts | High rate bins dominated by noise | Noise dominated (total time) | Noise dominated (detector-on time) | Marked lightcurve |
|---|---|---|---|---|---|---|---|
| A | 7626 | 6567 | 4 | 4 | 0.05% | 0.06% | 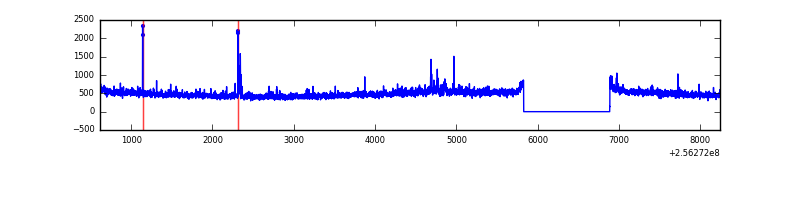 |
| B | 7626 | 6567 | 961 | 961 | 12.60% | 14.63% | 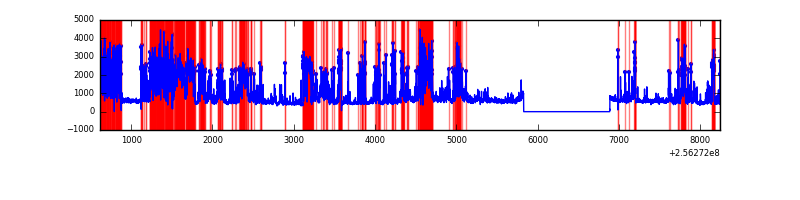 |
| C | 7626 | 6567 | 0 | 0 | 0.00% | 0.00% | 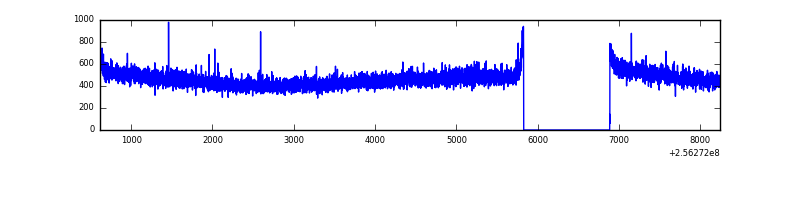 |
| D | 7626 | 6567 | 451 | 451 | 5.91% | 6.87% | 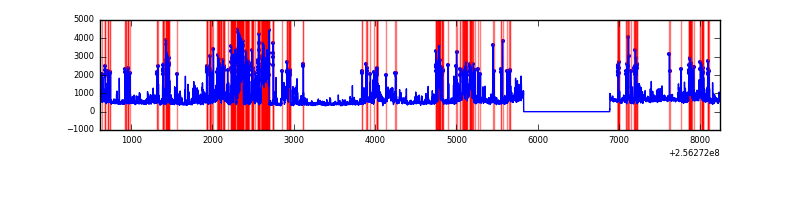 |
Top three noisy pixels from each quadrant. If the there are fewer than three noisy pixels in the level2.evt file, extra rows are filled as -1
| Pixel properties | Quadrant properties | ||||||
|---|---|---|---|---|---|---|---|
| Quadrant | DetID | PixID | Counts | Sigma | Mean | Median | Sigma |
| A | 12 | 189 | 46011 | 277.64 | 788 | 771 | 162.9 |
| A | 1 | 162 | 42835 | 258.15 | 788 | 771 | 162.9 |
| A | 15 | 174 | 35741 | 214.61 | 788 | 771 | 162.9 |
| B | 0 | 85 | 2093661 | 15616.9 | 703 | 685 | 134.0 |
| B | 4 | 239 | 1655868 | 12350.28 | 703 | 685 | 134.0 |
| B | 0 | 219 | 202778 | 1507.93 | 703 | 685 | 134.0 |
| C | 13 | 61 | 5680 | 26.94 | 778 | 782 | 181.8 |
| C | 3 | 202 | 1868 | 5.97 | 778 | 782 | 181.8 |
| C | -1 | -1 | -1 | -1.0 | 778 | 782 | 181.8 |
| D | 1 | 52 | 2123233 | 11650.33 | 746 | 724 | 182.2 |
| D | 4 | 95 | 171351 | 936.56 | 746 | 724 | 182.2 |
| D | 8 | 195 | 142120 | 776.11 | 746 | 724 | 182.2 |
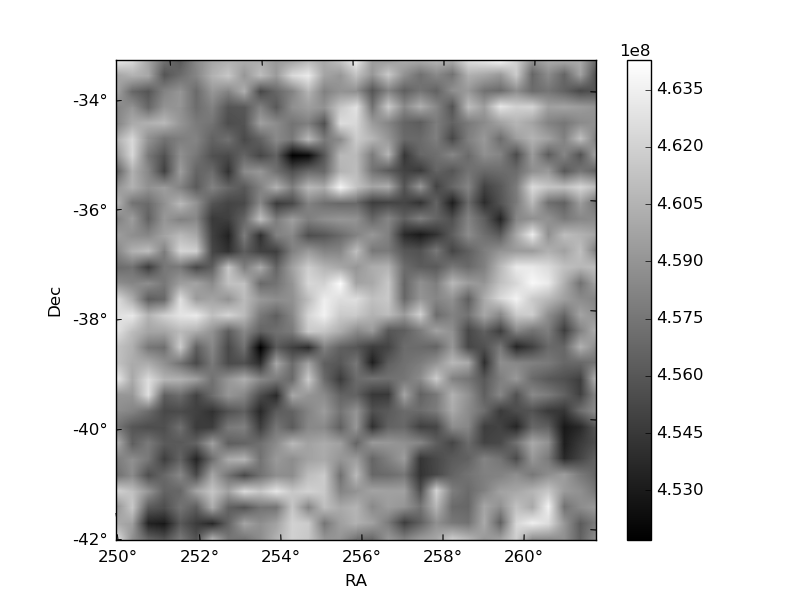
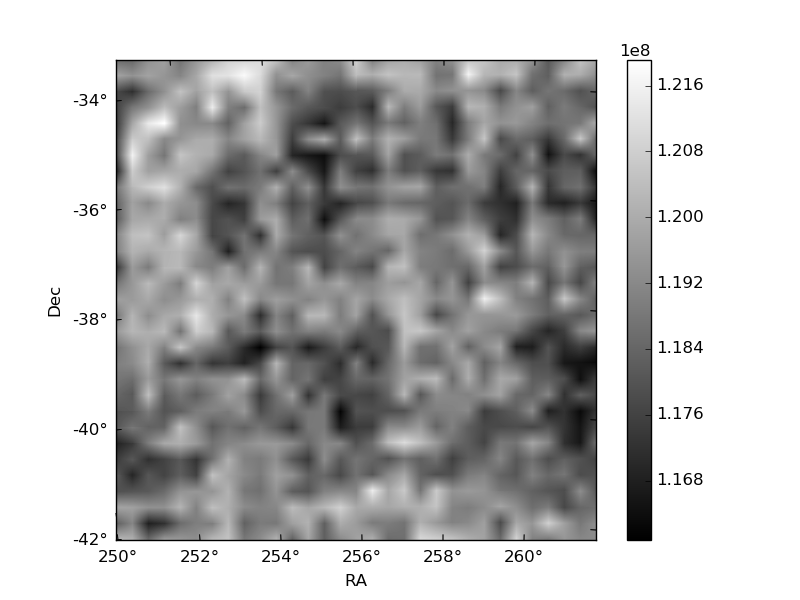
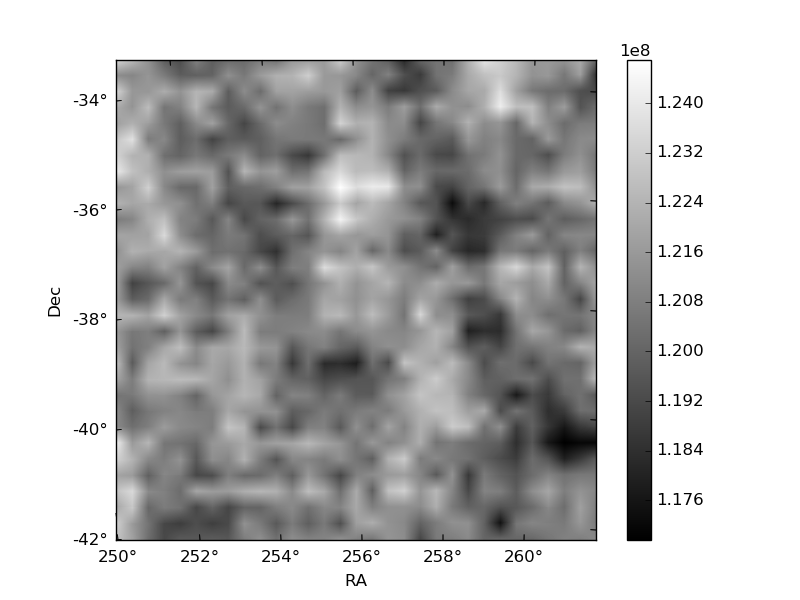
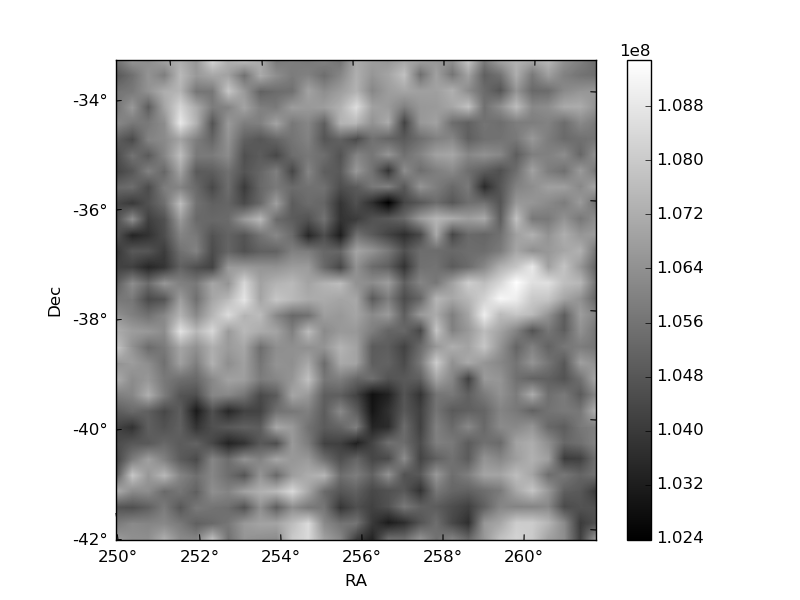
Histogram calculated using DETX and DETY for each event in the final _common_clean file
| Quadrant A | 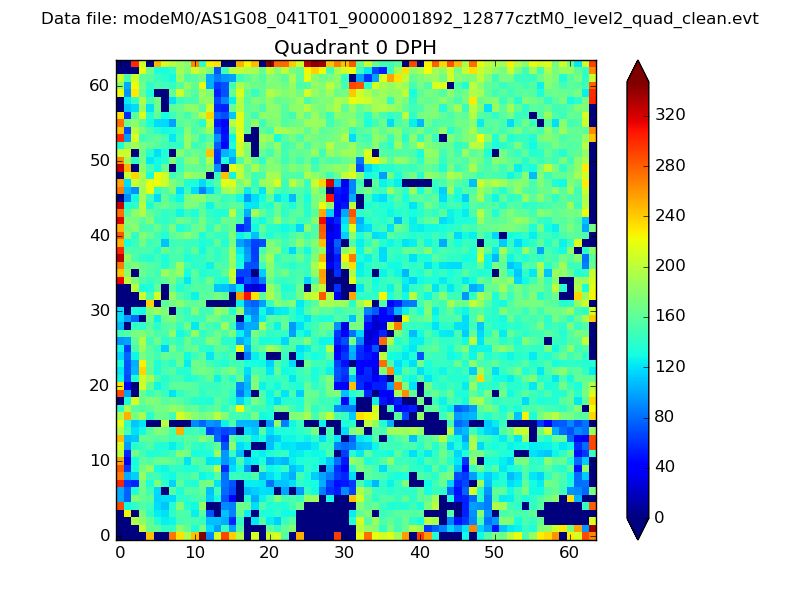 |
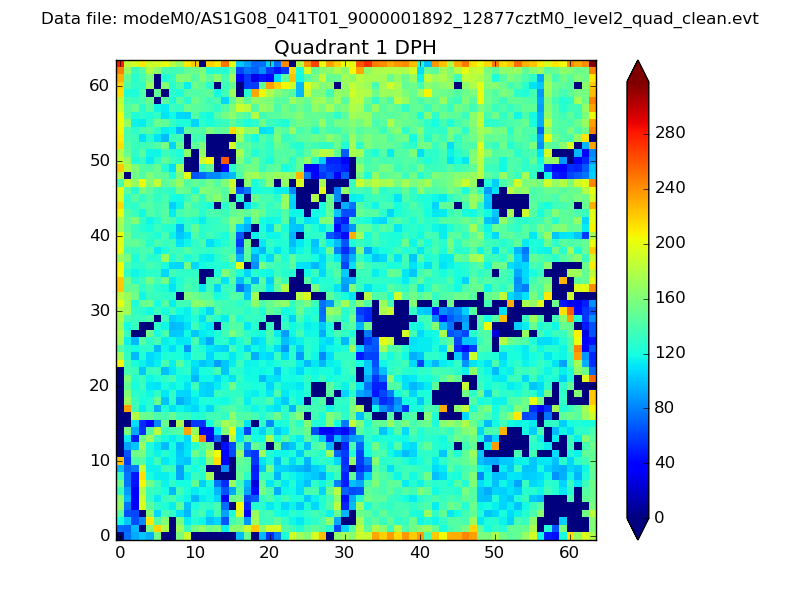 |
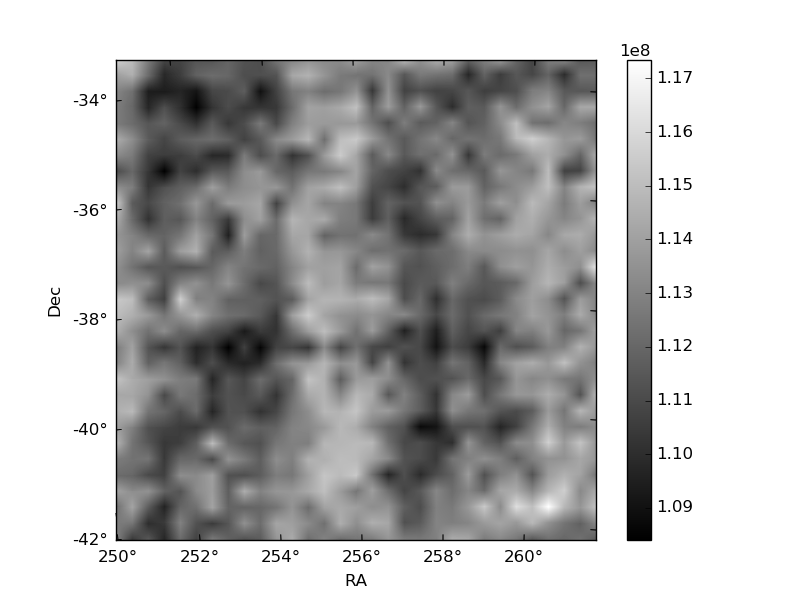
Quadrant B |
|---|---|---|---|
| Quadrant D | 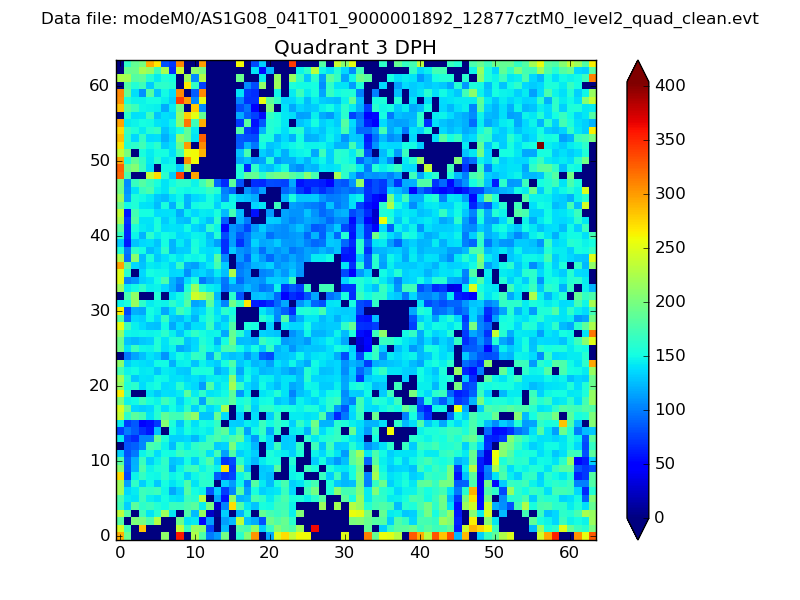 |
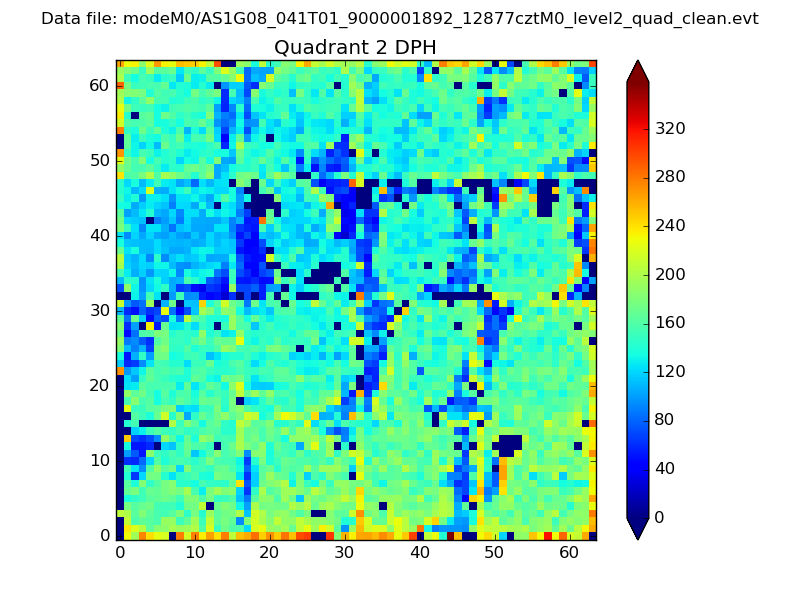 |
Quadrant C |
| Plot type | Count rate plots | Images |
|---|---|---|
| Comparison with Poisson distribution Blue bars denote a histogram of data divided into 1 sec bins. Red curve is a Poisson curve with rate = median count rate of data. |
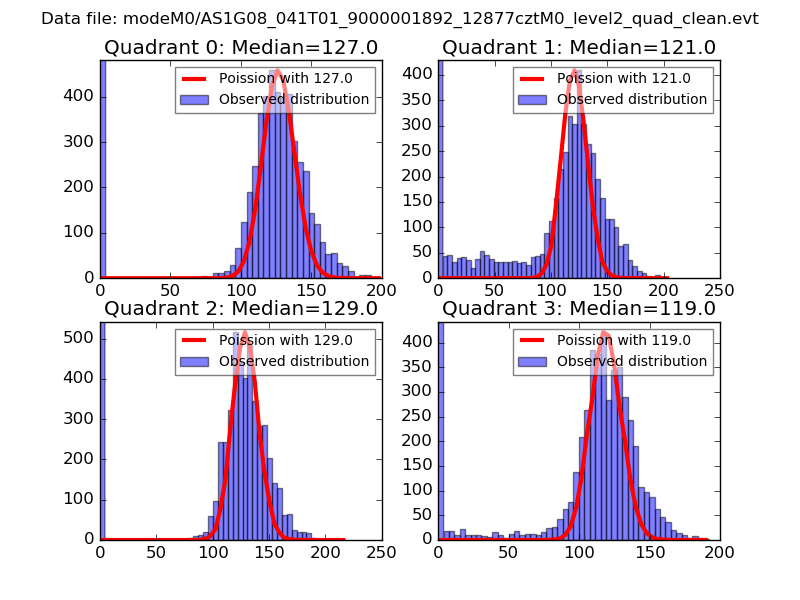 |
 |
| Quadrant-wise count rates Data is divided into 100 sec bins |
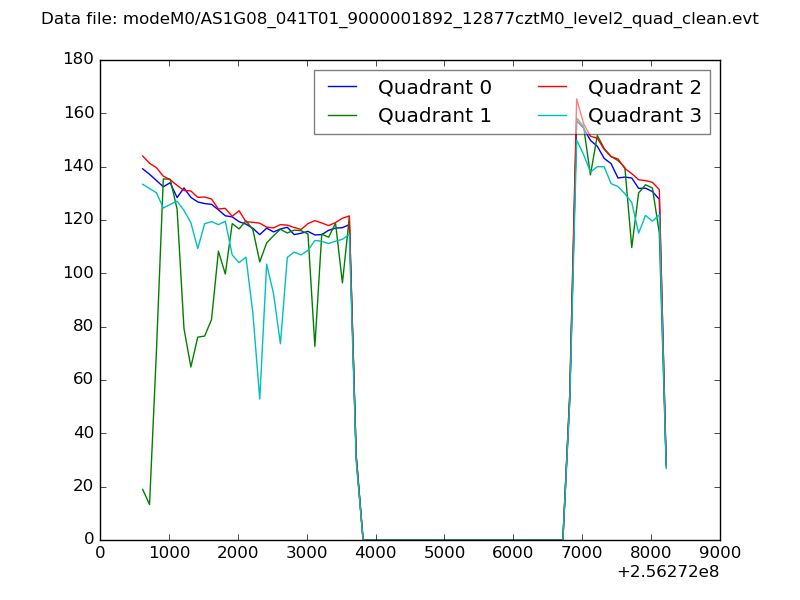 |
|
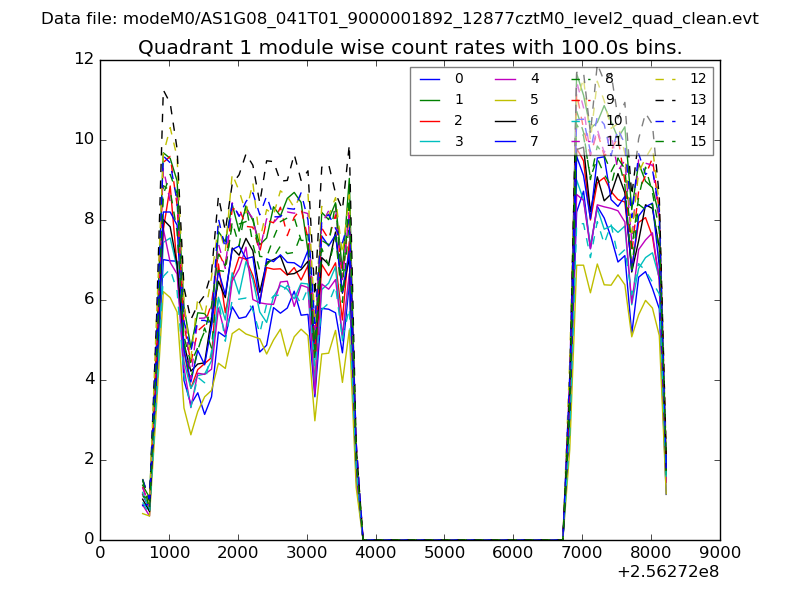
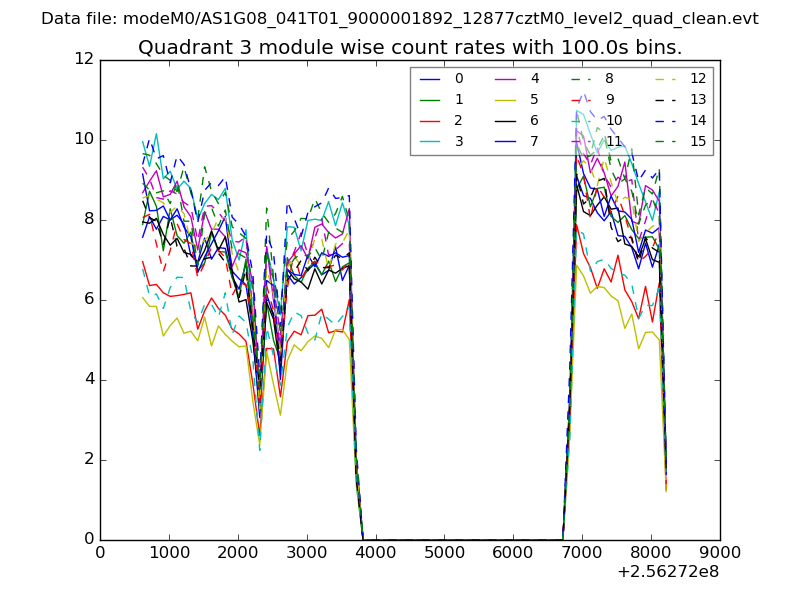
| Module-wise count rates for Quadrant A Data is divided into 100 sec bins |
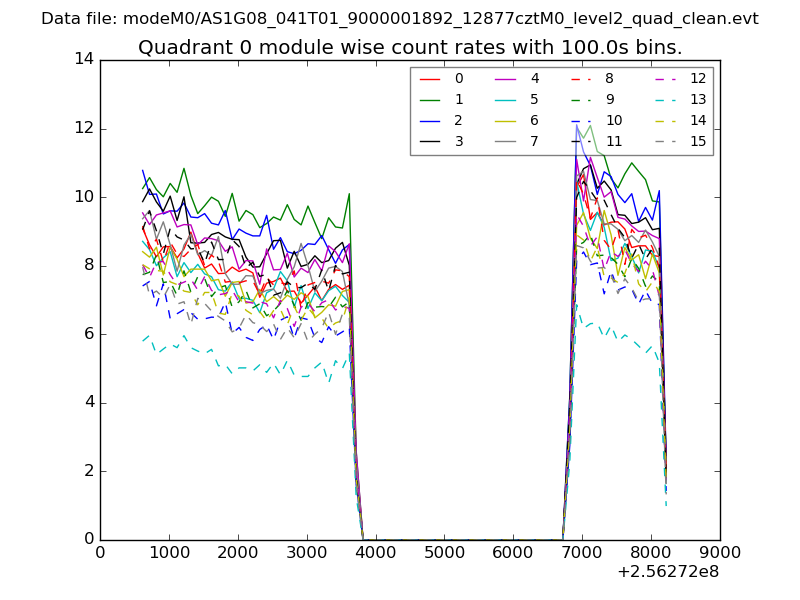 |
 |
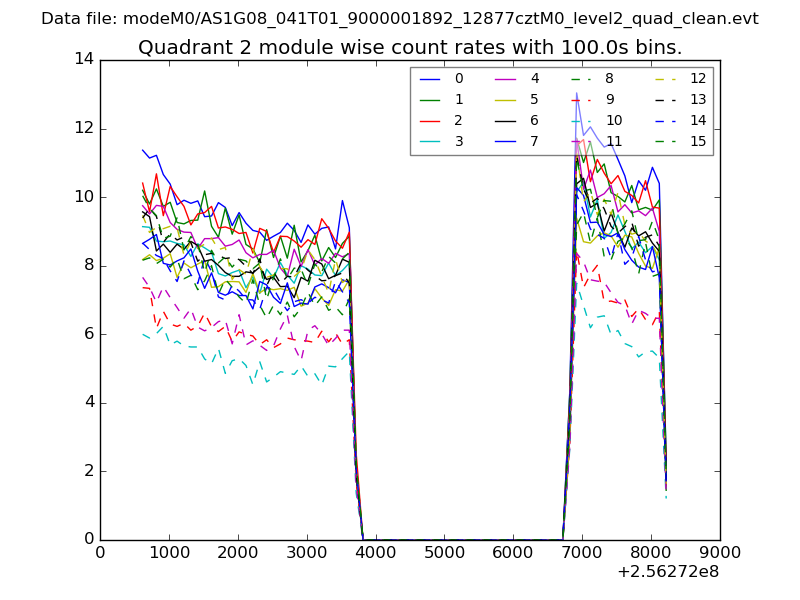
| Module-wise count rates for Quadrant B Data is divided into 100 sec bins |
 |
 |
| Module-wise count rates for Quadrant C Data is divided into 100 sec bins |
 |
 |
| Module-wise count rates for Quadrant D Data is divided into 100 sec bins |
 |
 |
| Parameter | Plot |
|---|---|
| CZT HV Monitor | 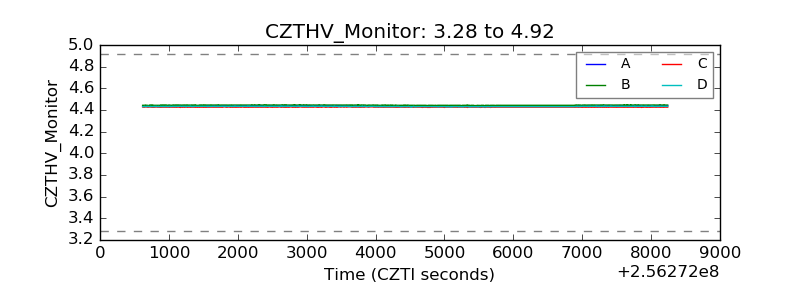 |
| D_VDD | 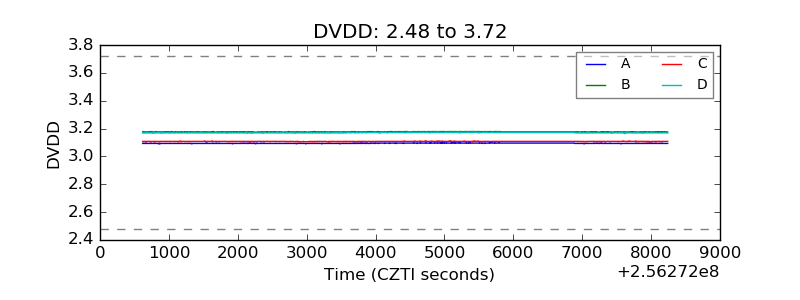 |
| Temperature 1 | 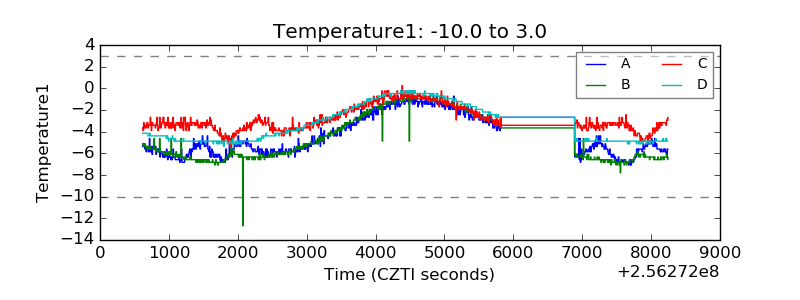 |
| Veto HV Monitor | 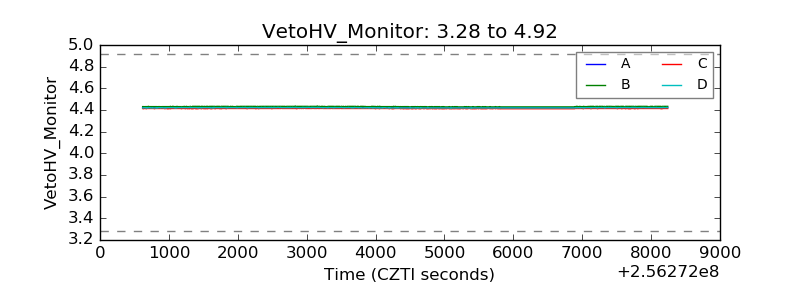 |
| Veto LLD | 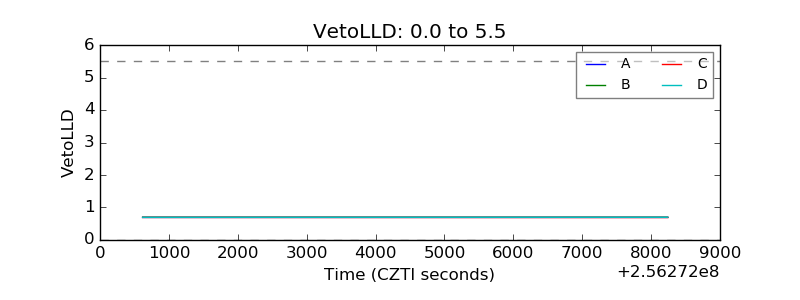 |
| Alpha Counter | 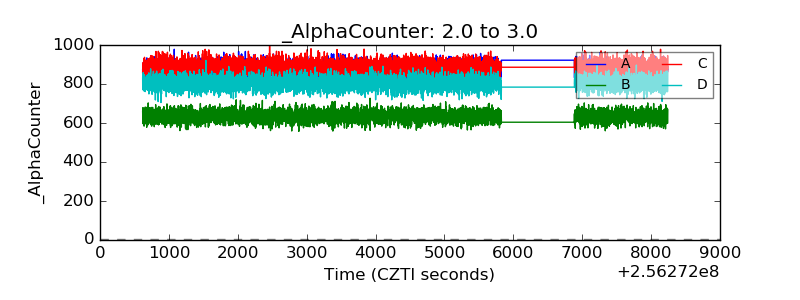 |
| _CPM_Rate | 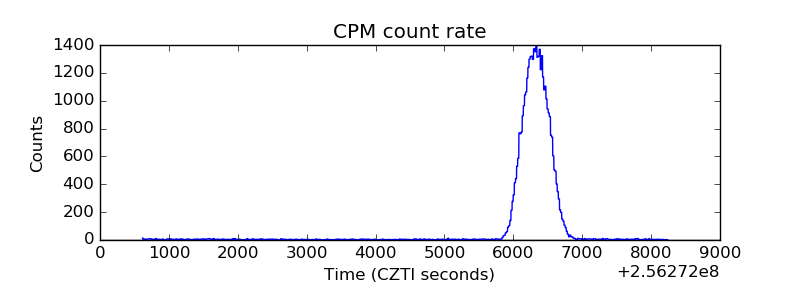 |
| CZT Counter | 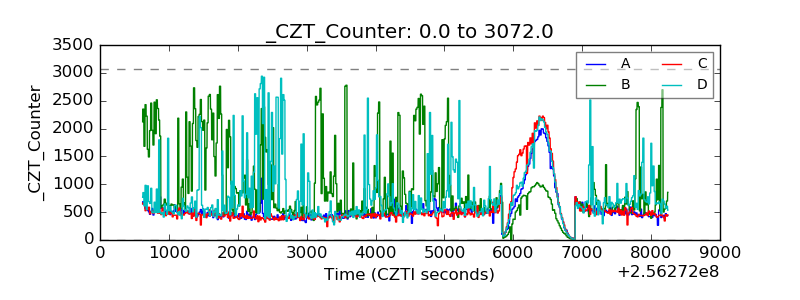 |
| +2.5 Volts monitor |  |
| +5 Volts monitor |  |
| _ROLL_ROT | 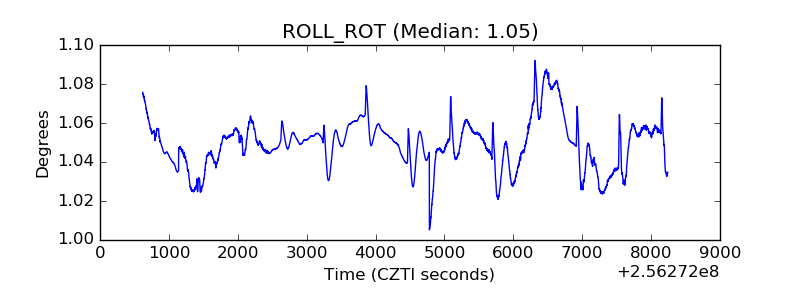 |
| _Roll_DEC | 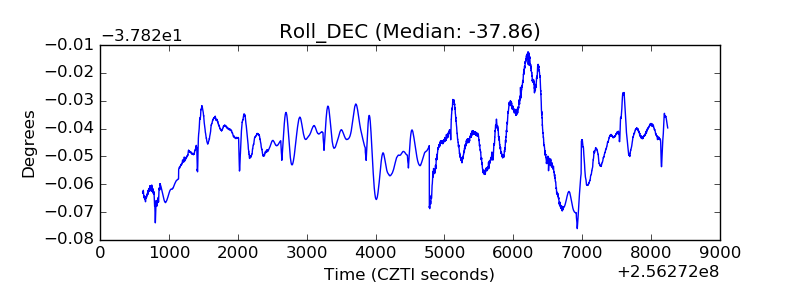 |
| _Roll_RA | 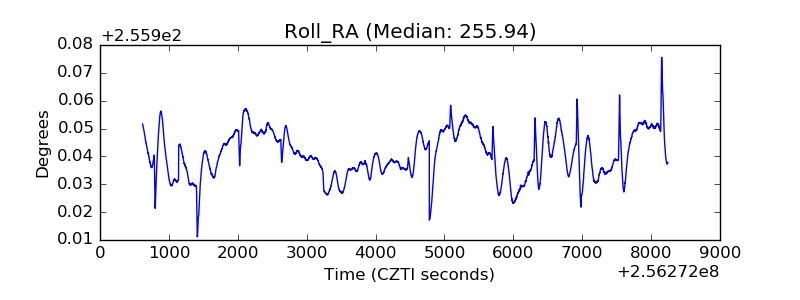 |
| Veto Counter | 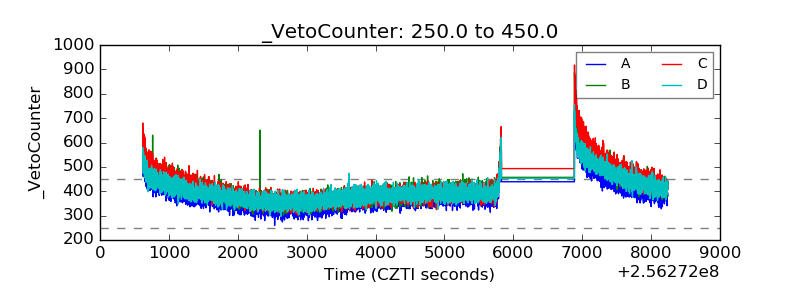 |