| Param | Original file | Final file |
|---|---|---|
| Filename | modeM0/AS1G08_041T01_9000001892_12879cztM0_level2.evt | modeM0/AS1G08_041T01_9000001892_12879cztM0_level2_quad_clean.evt |
| Size (bytes) | 140,221,440 | 33,183,360 |
| Size | 133.7 MB | 31.6 MB |
| Events in quadrant A | 777,725 | 221,525 |
| Events in quadrant B | 1,212,133 | 220,476 |
| Events in quadrant C | 771,017 | 226,346 |
| Events in quadrant D | 1,364,255 | 207,876 |
| Mode SS | |||
|---|---|---|---|
| Quadrant | BADHDUFLAG | Total packets | Discarded packets |
| A | 0 | 34 | 0 |
| B | 0 | 34 | 0 |
| C | 0 | 34 | 0 |
| D | 0 | 34 | 0 |
| Mode M0 | |||
|---|---|---|---|
| Quadrant | BADHDUFLAG | Total packets | Discarded packets |
| A | 0 | 3524 | 0 |
| B | 0 | 4796 | 0 |
| C | 0 | 3520 | 0 |
| D | 0 | 5356 | 0 |
| Quadrant | Total seconds | Saturated seconds | Saturation percentage |
|---|---|---|---|
| A | 1754 | 0 | 0.000000% |
| B | 1754 | 75 | 4.275941% |
| C | 1754 | 2 | 0.114025% |
| D | 1754 | 48 | 2.736602% |
Noise dominated data is calculated using 1-second bins in cleaned event files. If a bin has >2000 counts, and if more than 50% of those come from <1% of pixels, then it is considered to be noise-dominated and hence unusable.
| Quadrant | # 1 sec bins | Bins with >0 counts | Bins with >2000 counts | High rate bins dominated by noise | Noise dominated (total time) | Noise dominated (detector-on time) | Marked lightcurve |
|---|---|---|---|---|---|---|---|
| A | 1755 | 1755 | 0 | 0 | 0.00% | 0.00% | 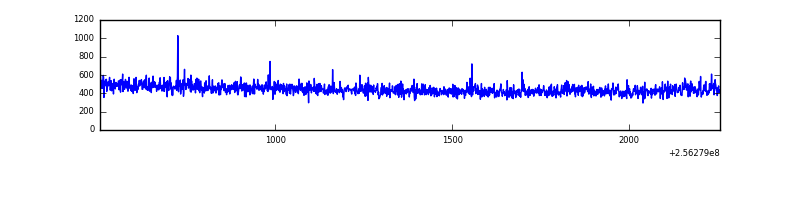 |
| B | 1755 | 1755 | 64 | 64 | 3.65% | 3.65% | 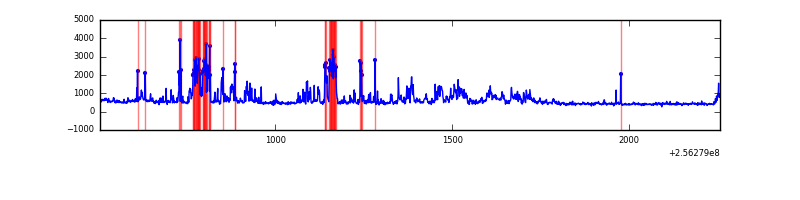 |
| C | 1755 | 1755 | 0 | 0 | 0.00% | 0.00% | 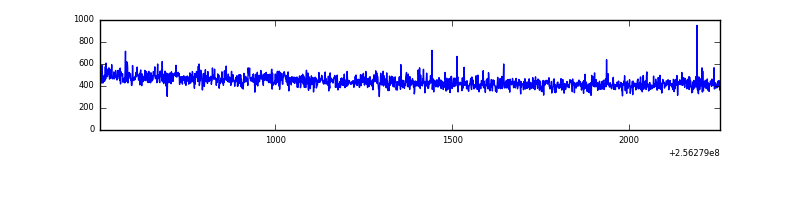 |
| D | 1755 | 1755 | 49 | 49 | 2.79% | 2.79% | 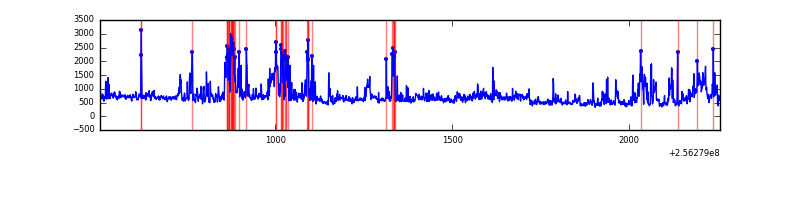 |
Top three noisy pixels from each quadrant. If the there are fewer than three noisy pixels in the level2.evt file, extra rows are filled as -1
| Pixel properties | Quadrant properties | ||||||
|---|---|---|---|---|---|---|---|
| Quadrant | DetID | PixID | Counts | Sigma | Mean | Median | Sigma |
| A | 1 | 162 | 8388 | 195.03 | 196 | 191 | 42.0 |
| A | 1 | 178 | 4289 | 97.5 | 196 | 191 | 42.0 |
| A | 1 | 161 | 3574 | 80.49 | 196 | 191 | 42.0 |
| B | 0 | 85 | 257144 | 6682.94 | 193 | 188 | 38.4 |
| B | 4 | 239 | 173111 | 4497.4 | 193 | 188 | 38.4 |
| B | 0 | 219 | 12548 | 321.46 | 193 | 188 | 38.4 |
| C | 13 | 61 | 1425 | 25.73 | 197 | 199 | 47.6 |
| C | 3 | 202 | 549 | 7.35 | 197 | 199 | 47.6 |
| C | -1 | -1 | -1 | -1.0 | 197 | 199 | 47.6 |
| D | 1 | 52 | 438544 | 9213.57 | 191 | 185 | 47.6 |
| D | 2 | 14 | 150632 | 3162.14 | 191 | 185 | 47.6 |
| D | 8 | 195 | 46698 | 977.63 | 191 | 185 | 47.6 |
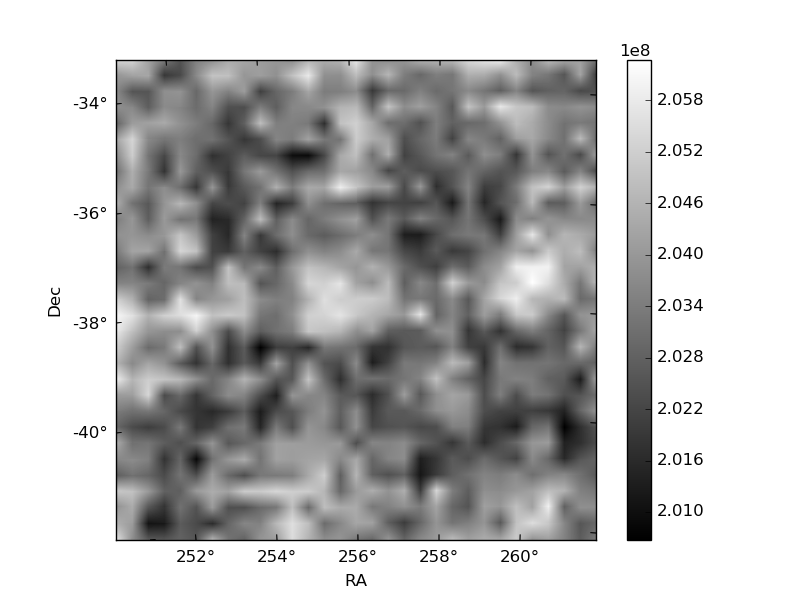
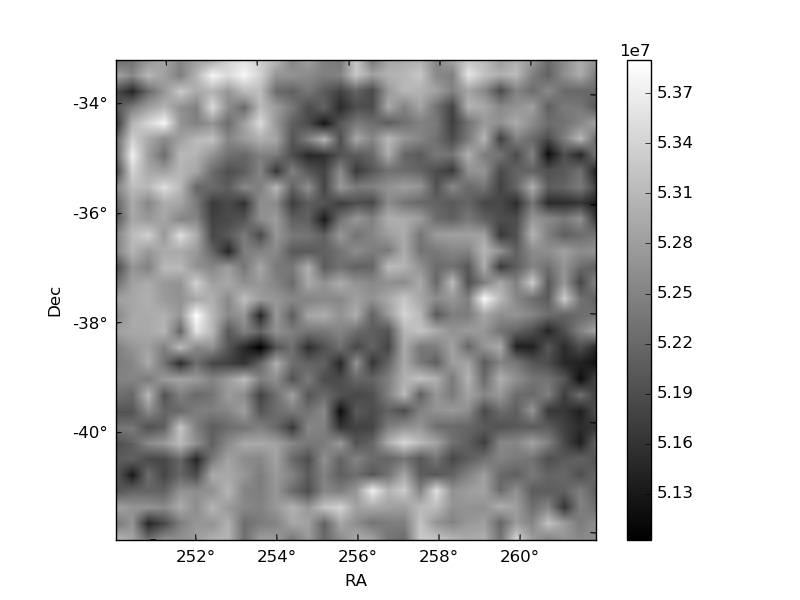
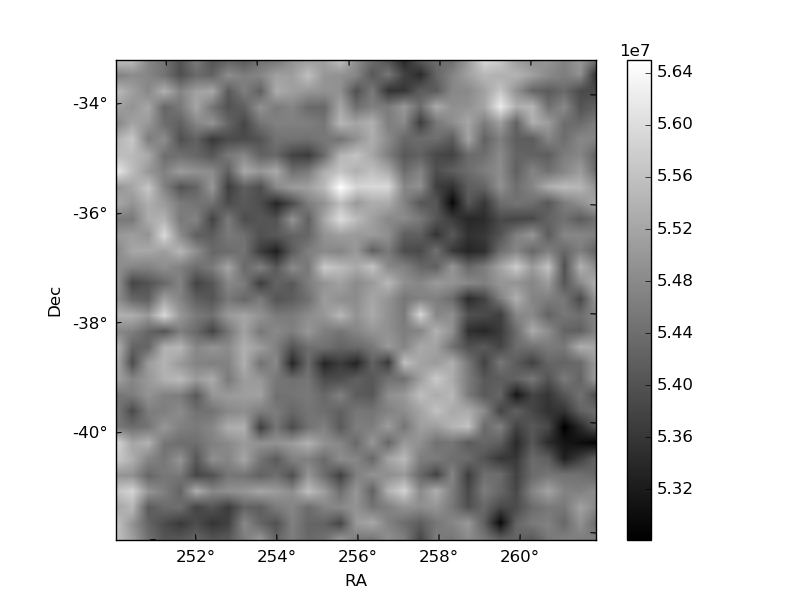
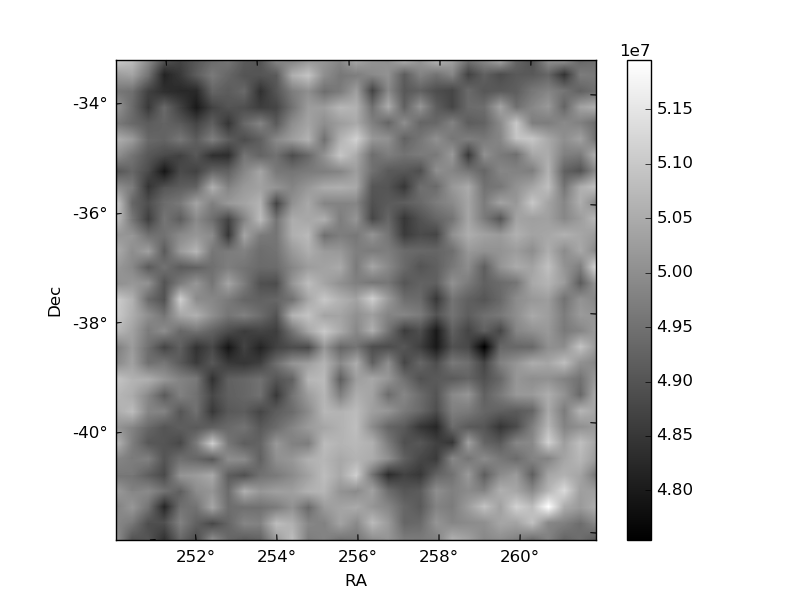
Histogram calculated using DETX and DETY for each event in the final _common_clean file
| Quadrant A | 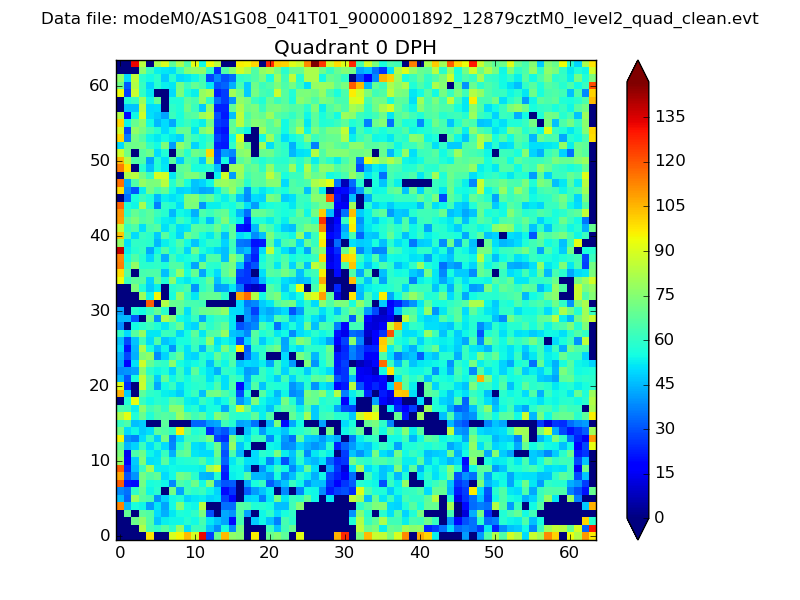 |
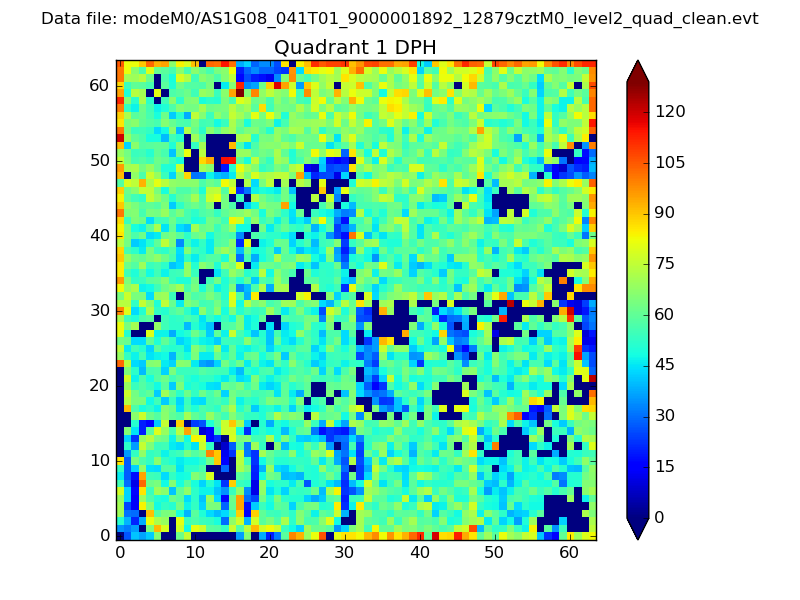 |
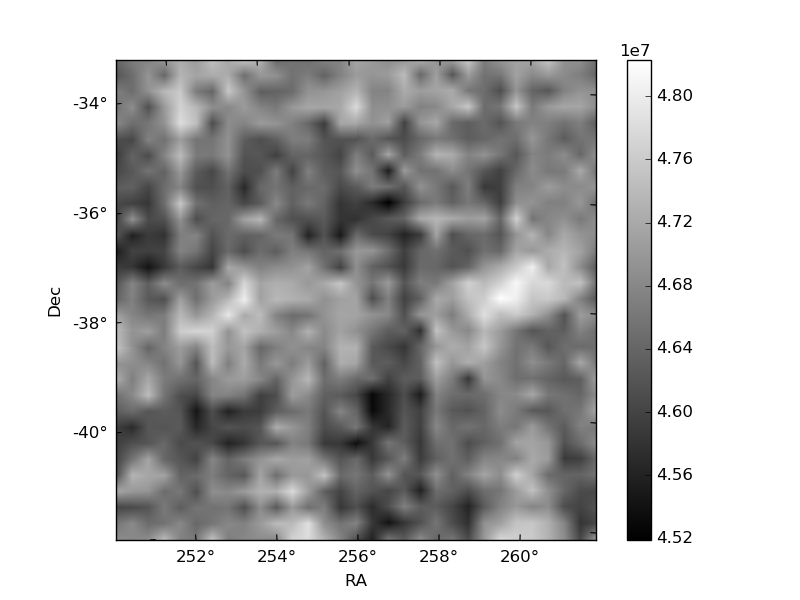
Quadrant B |
|---|---|---|---|
| Quadrant D |  |
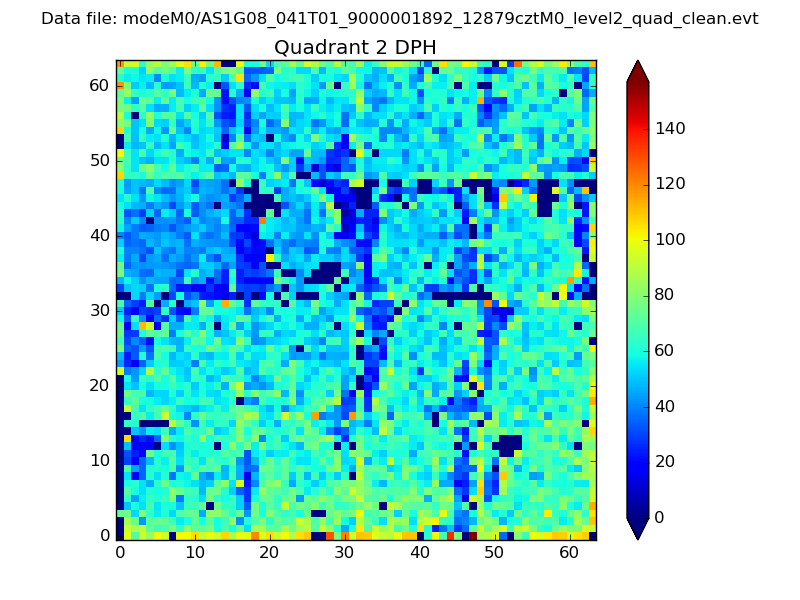 |
Quadrant C |
| Plot type | Count rate plots | Images |
|---|---|---|
| Comparison with Poisson distribution Blue bars denote a histogram of data divided into 1 sec bins. Red curve is a Poisson curve with rate = median count rate of data. |
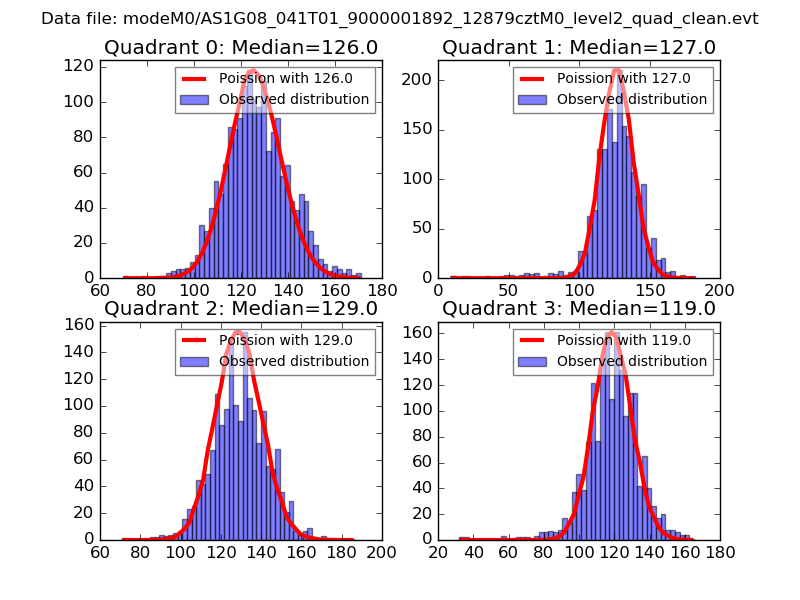 |
 |
| Quadrant-wise count rates Data is divided into 100 sec bins |
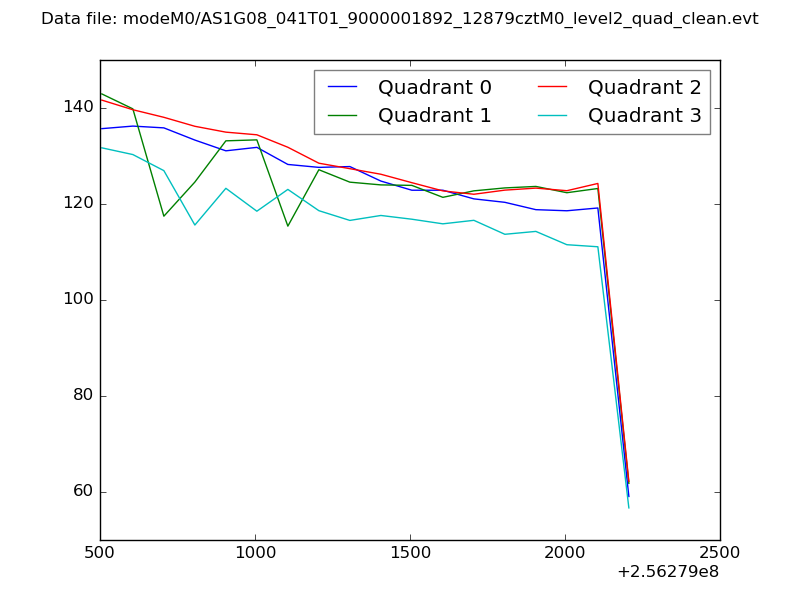 |
|
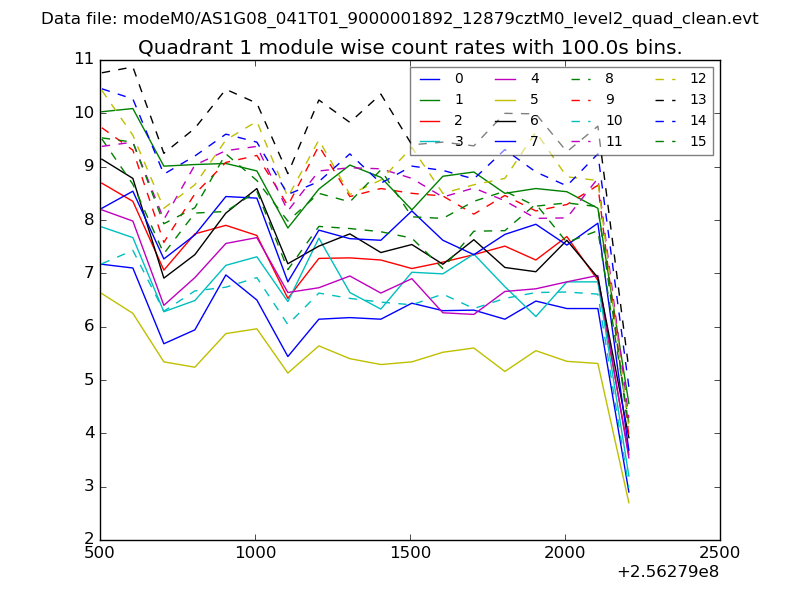
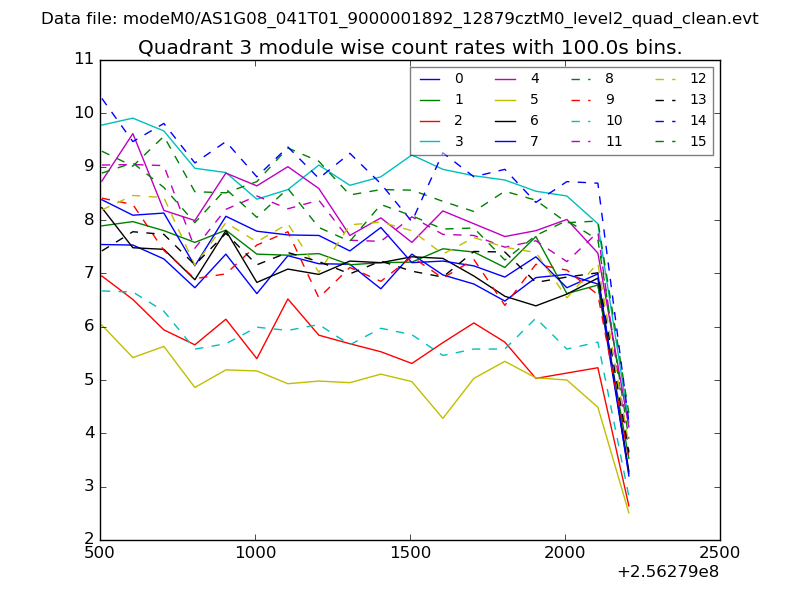
| Module-wise count rates for Quadrant A Data is divided into 100 sec bins |
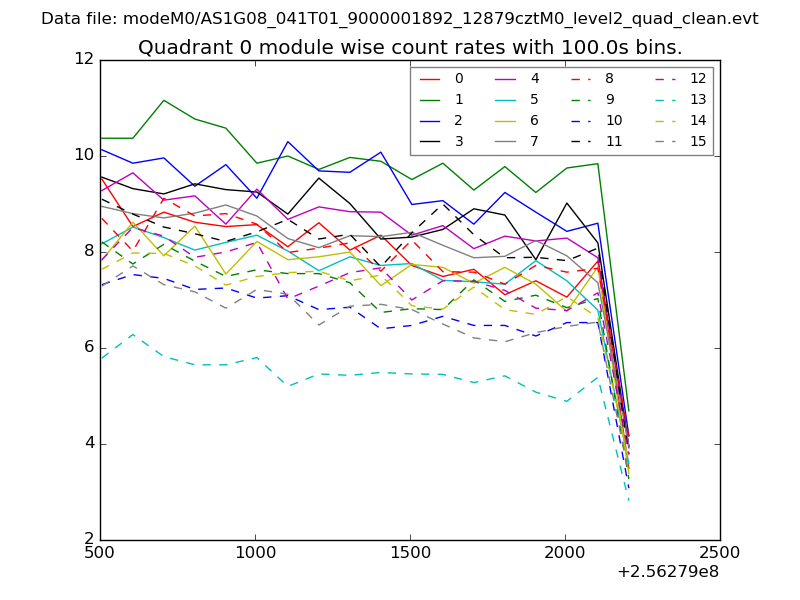 |
 |
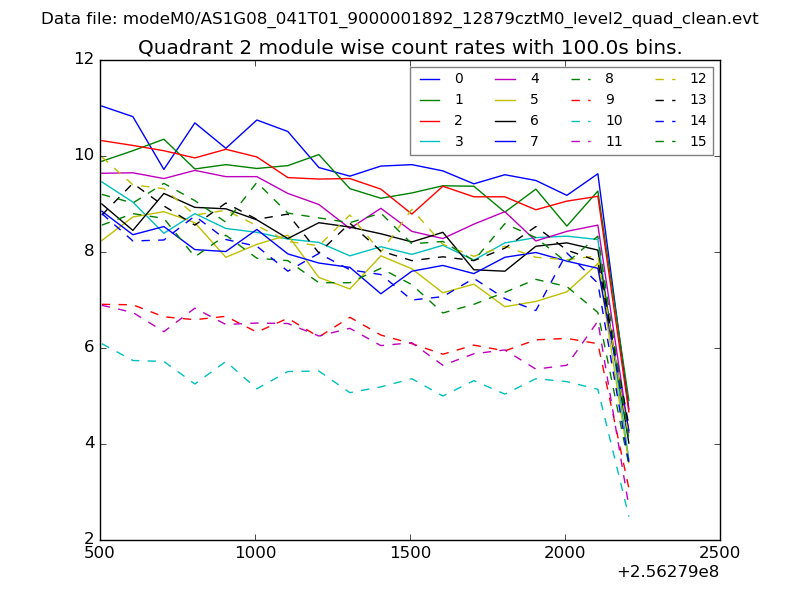
| Module-wise count rates for Quadrant B Data is divided into 100 sec bins |
 |
 |
| Module-wise count rates for Quadrant C Data is divided into 100 sec bins |
 |
 |
| Module-wise count rates for Quadrant D Data is divided into 100 sec bins |
 |
 |
| Parameter | Plot |
|---|---|
| CZT HV Monitor | 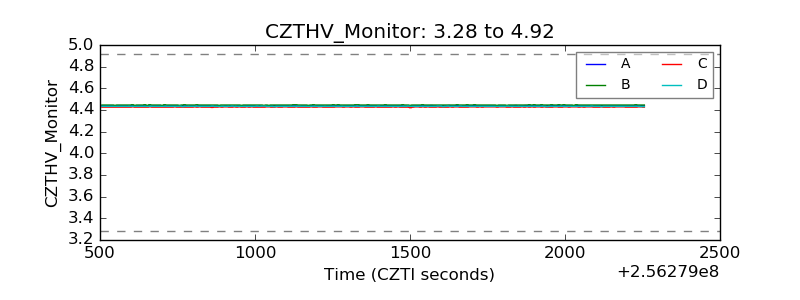 |
| D_VDD | 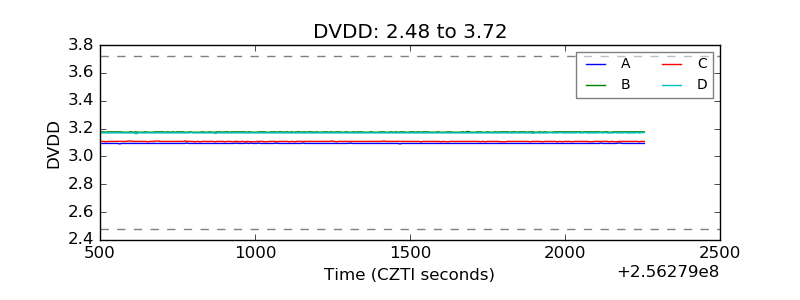 |
| Temperature 1 | 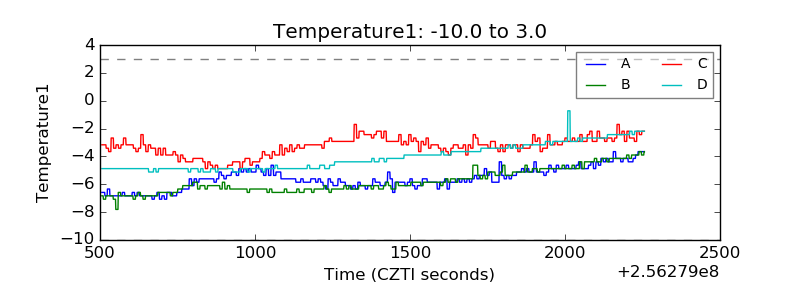 |
| Veto HV Monitor | 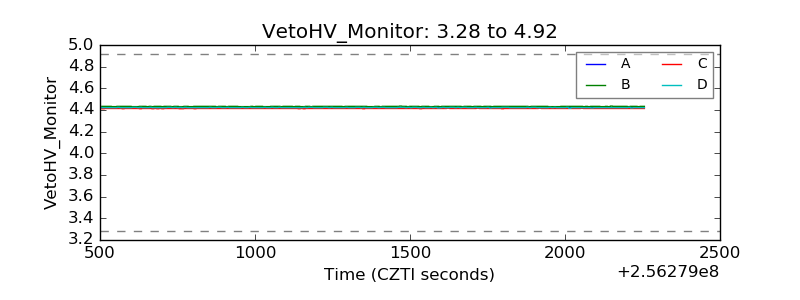 |
| Veto LLD | 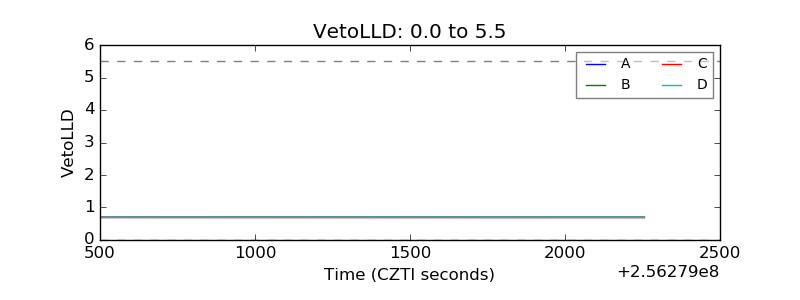 |
| Alpha Counter | 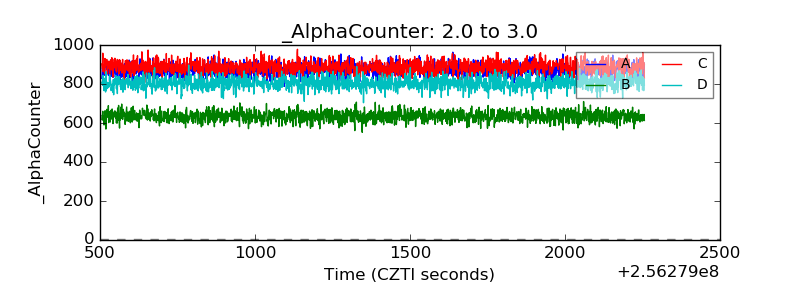 |
| _CPM_Rate |  |
| CZT Counter | 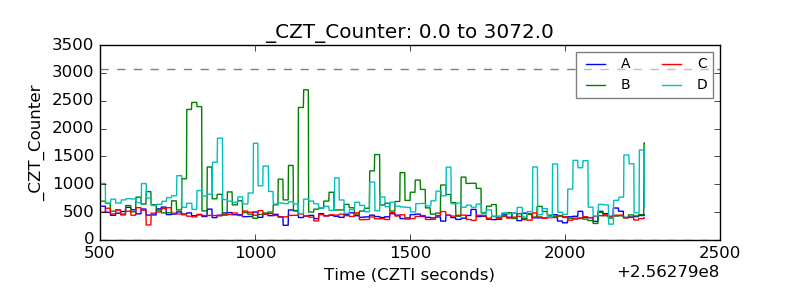 |
| +2.5 Volts monitor |  |
| +5 Volts monitor |  |
| _ROLL_ROT | 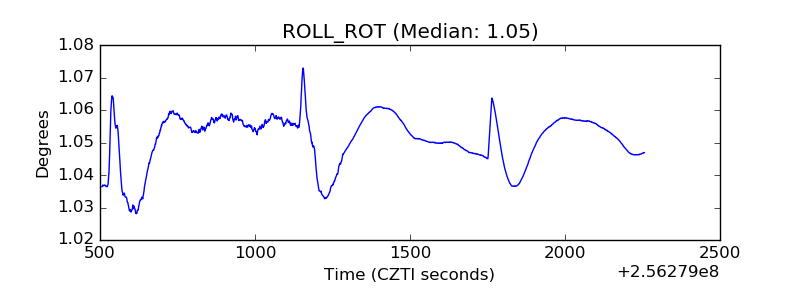 |
| _Roll_DEC | 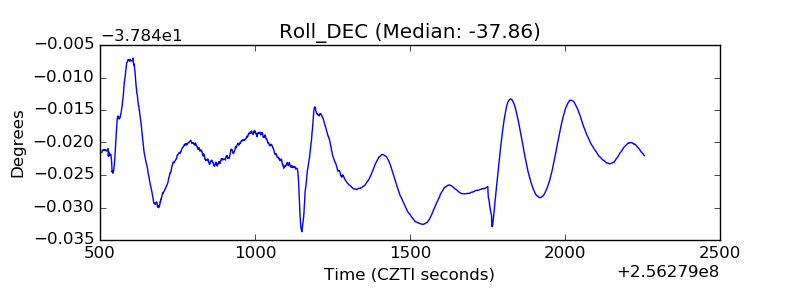 |
| _Roll_RA | 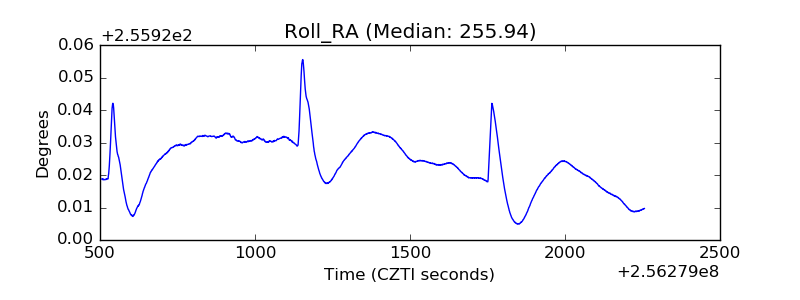 |
| Veto Counter | 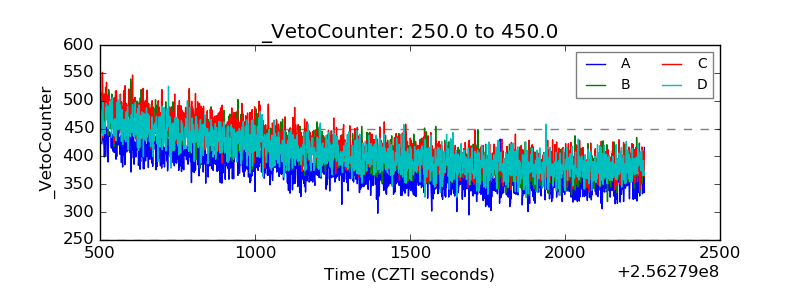 |