| Param | Original file | Final file |
|---|---|---|
| Filename | modeM0/AS1C03_001T01_9000001894_12879cztM0_level2.evt | modeM0/AS1C03_001T01_9000001894_12879cztM0_level2_quad_clean.evt |
| Size (bytes) | 279,296,640 | 56,920,320 |
| Size | 266.4 MB | 54.3 MB |
| Events in quadrant A | 1,635,359 | 400,550 |
| Events in quadrant B | 2,162,864 | 373,013 |
| Events in quadrant C | 1,385,451 | 395,905 |
| Events in quadrant D | 3,075,676 | 346,114 |
| Mode M0 | |||
|---|---|---|---|
| Quadrant | BADHDUFLAG | Total packets | Discarded packets |
| A | 0 | 6558 | 2 |
| B | 0 | 8240 | 1 |
| C | 0 | 5931 | 1 |
| D | 0 | 11100 | 1 |
| Mode SS | |||
|---|---|---|---|
| Quadrant | BADHDUFLAG | Total packets | Discarded packets |
| A | 0 | 60 | 0 |
| B | 0 | 60 | 0 |
| C | 0 | 60 | 0 |
| D | 0 | 60 | 0 |
| Mode M9 | |||
|---|---|---|---|
| Quadrant | BADHDUFLAG | Total packets | Discarded packets |
| A | 0 | 12 | 0 |
| B | 0 | 12 | 0 |
| C | 0 | 12 | 0 |
| D | 0 | 12 | 0 |
| Quadrant | Total seconds | Saturated seconds | Saturation percentage |
|---|---|---|---|
| A | 2910 | 51 | 1.752577% |
| B | 2910 | 332 | 11.408935% |
| C | 2910 | 6 | 0.206186% |
| D | 2910 | 489 | 16.804124% |
Noise dominated data is calculated using 1-second bins in cleaned event files. If a bin has >2000 counts, and if more than 50% of those come from <1% of pixels, then it is considered to be noise-dominated and hence unusable.
| Quadrant | # 1 sec bins | Bins with >0 counts | Bins with >2000 counts | High rate bins dominated by noise | Noise dominated (total time) | Noise dominated (detector-on time) | Marked lightcurve |
|---|---|---|---|---|---|---|---|
| A | 4071 | 2912 | 0 | 0 | 0.00% | 0.00% | 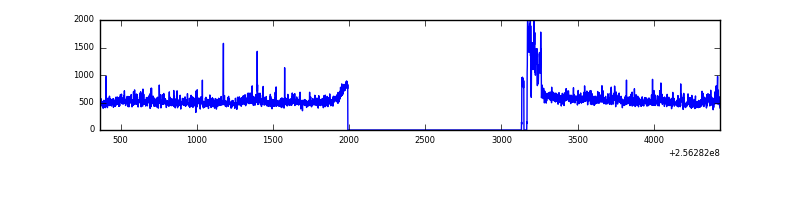 |
| B | 4071 | 2910 | 165 | 165 | 4.05% | 5.67% | 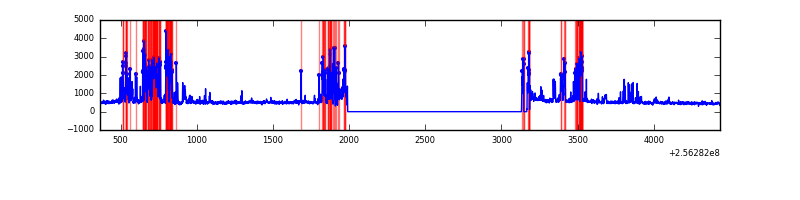 |
| C | 4071 | 2912 | 0 | 0 | 0.00% | 0.00% | 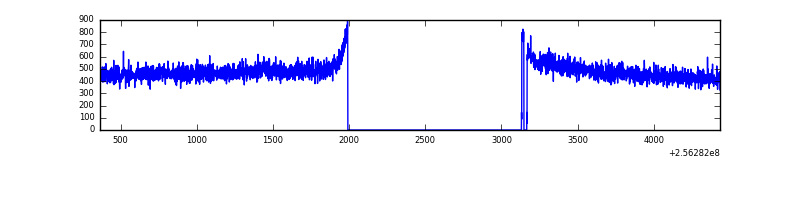 |
| D | 4071 | 2912 | 417 | 417 | 10.24% | 14.32% | 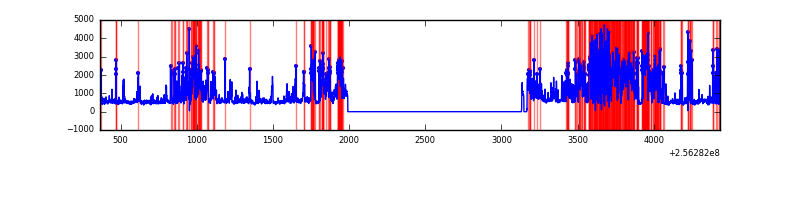 |
Top three noisy pixels from each quadrant. If the there are fewer than three noisy pixels in the level2.evt file, extra rows are filled as -1
| Pixel properties | Quadrant properties | ||||||
|---|---|---|---|---|---|---|---|
| Quadrant | DetID | PixID | Counts | Sigma | Mean | Median | Sigma |
| A | 15 | 222 | 74841 | 985.39 | 368 | 359 | 75.6 |
| A | 1 | 162 | 42079 | 551.95 | 368 | 359 | 75.6 |
| A | 12 | 189 | 31184 | 407.81 | 368 | 359 | 75.6 |
| B | 4 | 239 | 448243 | 6960.75 | 339 | 331 | 64.3 |
| B | 0 | 85 | 290094 | 4503.05 | 339 | 331 | 64.3 |
| B | 0 | 182 | 36670 | 564.72 | 339 | 331 | 64.3 |
| C | 13 | 61 | 2641 | 27.73 | 355 | 355 | 82.4 |
| C | 3 | 202 | 854 | 6.05 | 355 | 355 | 82.4 |
| C | -1 | -1 | -1 | -1.0 | 355 | 355 | 82.4 |
| D | 1 | 52 | 1465959 | 18045.82 | 332 | 321 | 81.2 |
| D | 4 | 95 | 239548 | 2945.51 | 332 | 321 | 81.2 |
| D | 8 | 195 | 90978 | 1116.22 | 332 | 321 | 81.2 |
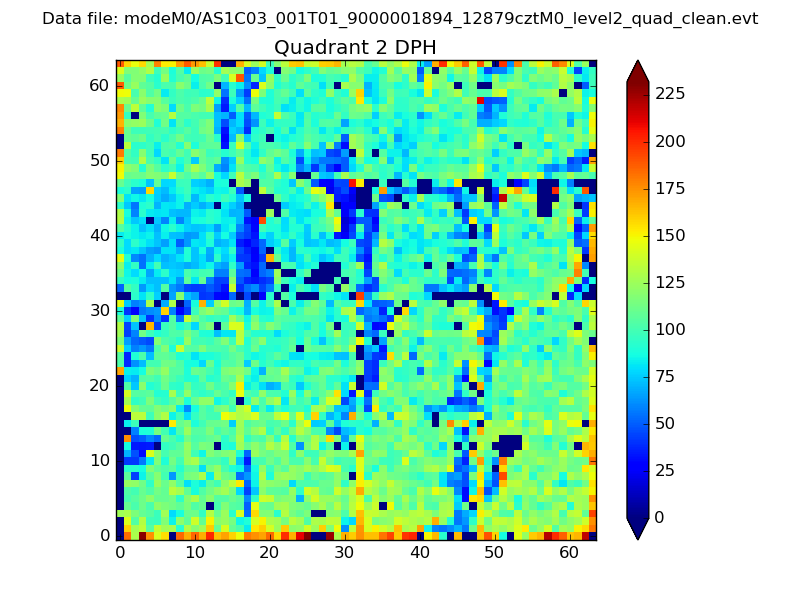
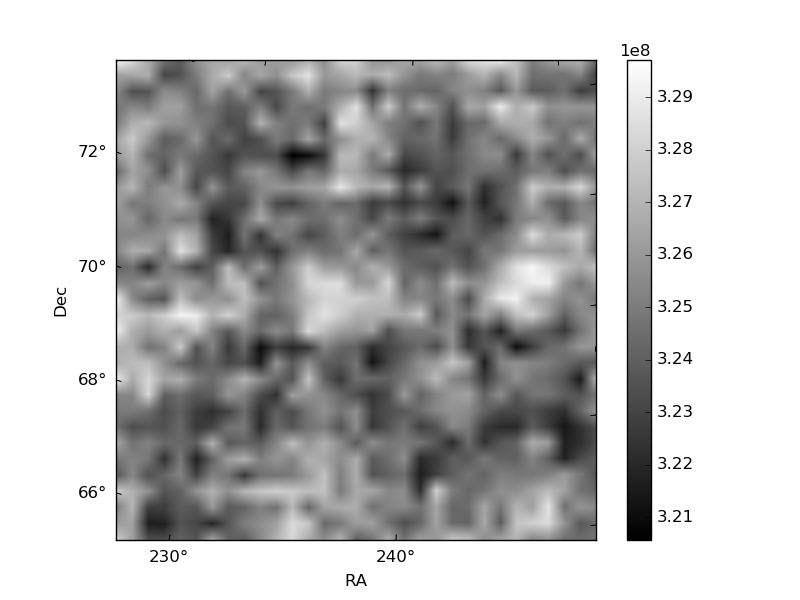
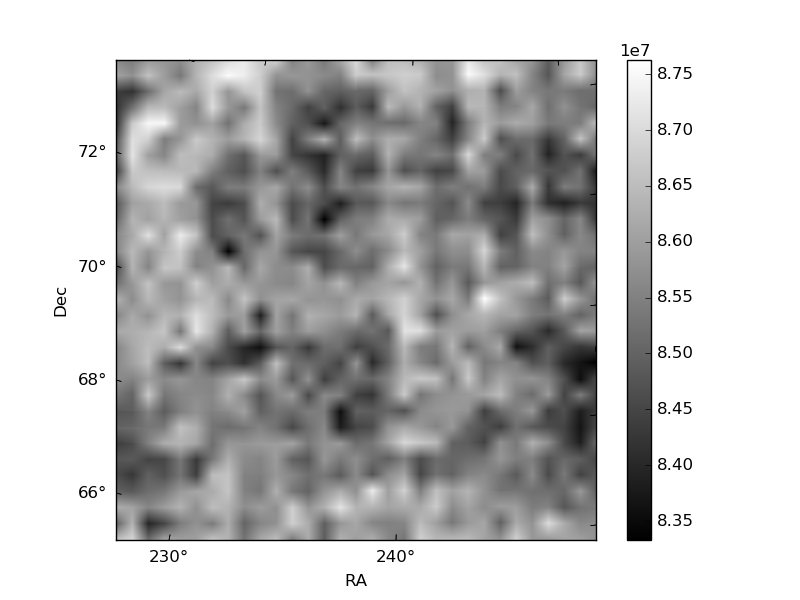
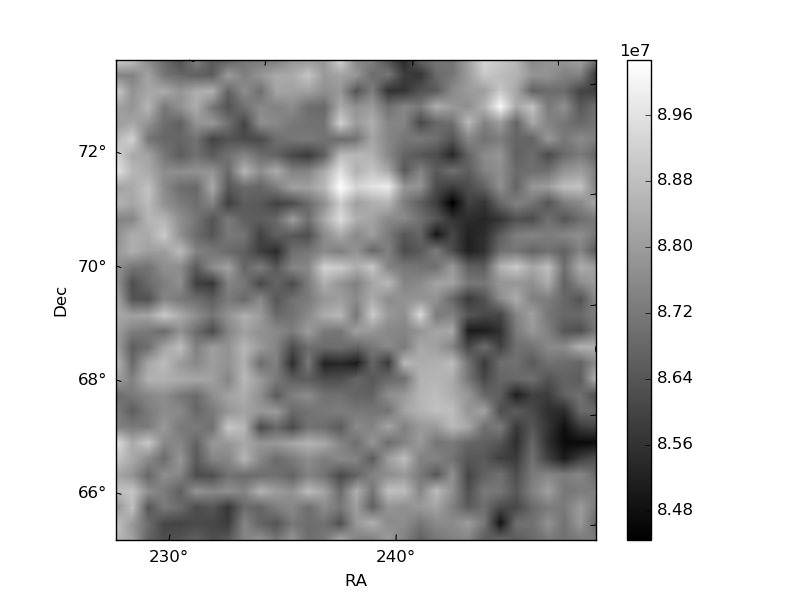
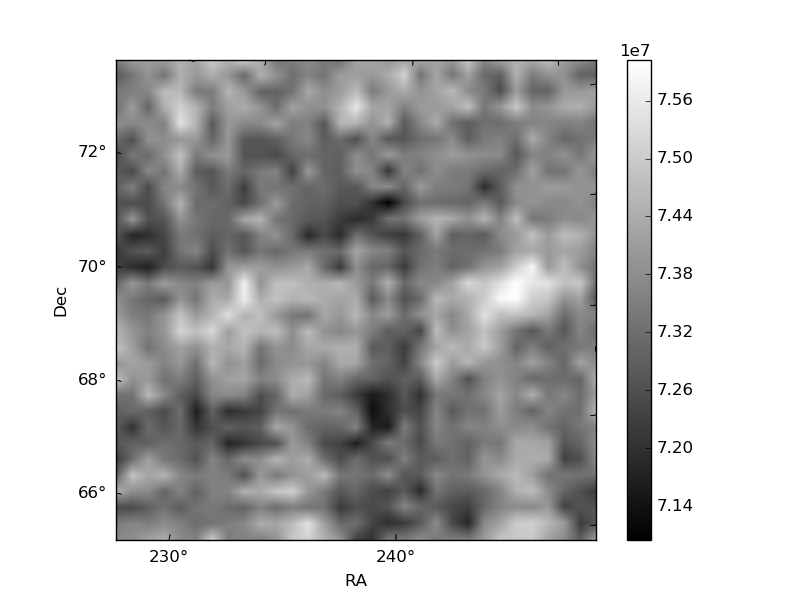
Histogram calculated using DETX and DETY for each event in the final _common_clean file
| Quadrant A | 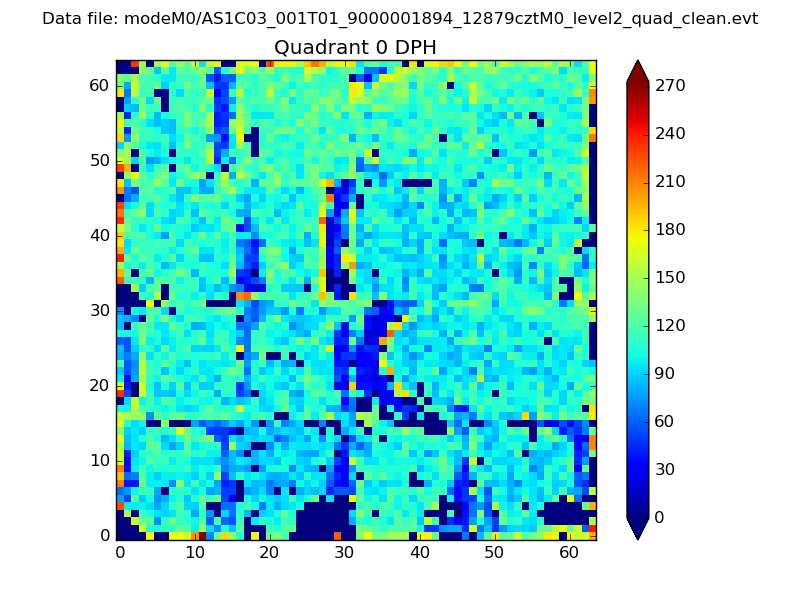 |
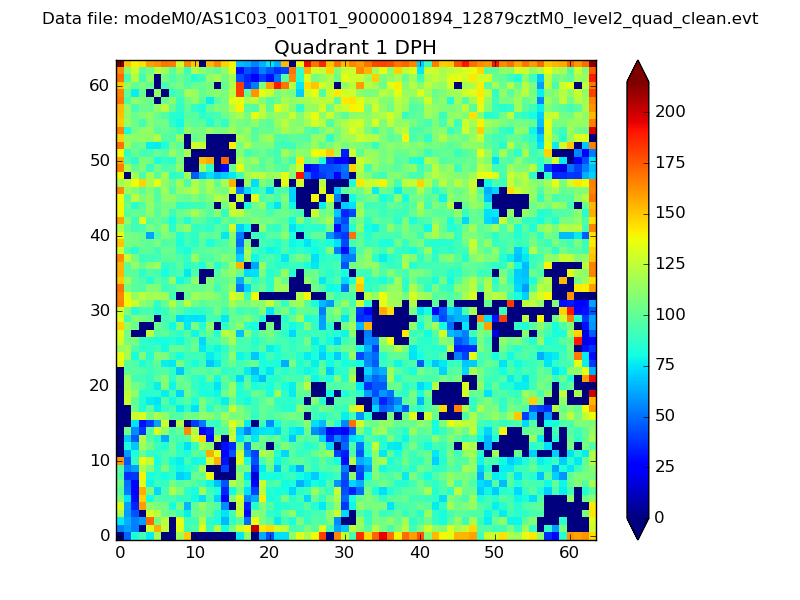 |
Quadrant B |
|---|---|---|---|
| Quadrant D | 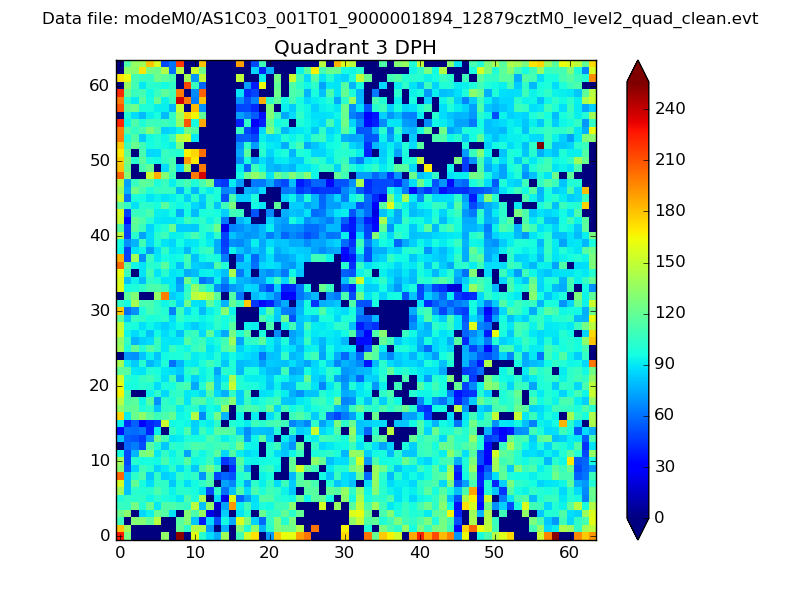 |
 |
Quadrant C |
| Plot type | Count rate plots | Images |
|---|---|---|
| Comparison with Poisson distribution Blue bars denote a histogram of data divided into 1 sec bins. Red curve is a Poisson curve with rate = median count rate of data. |
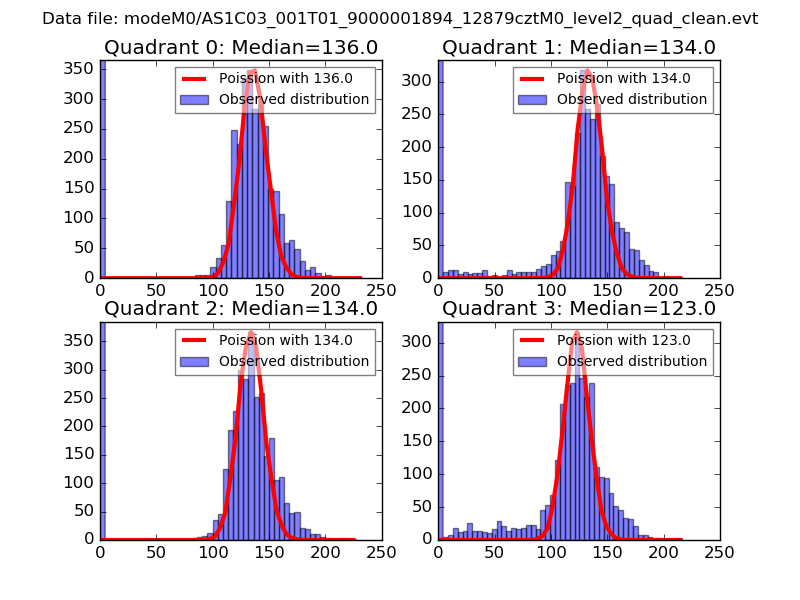 |
 |
| Quadrant-wise count rates Data is divided into 100 sec bins |
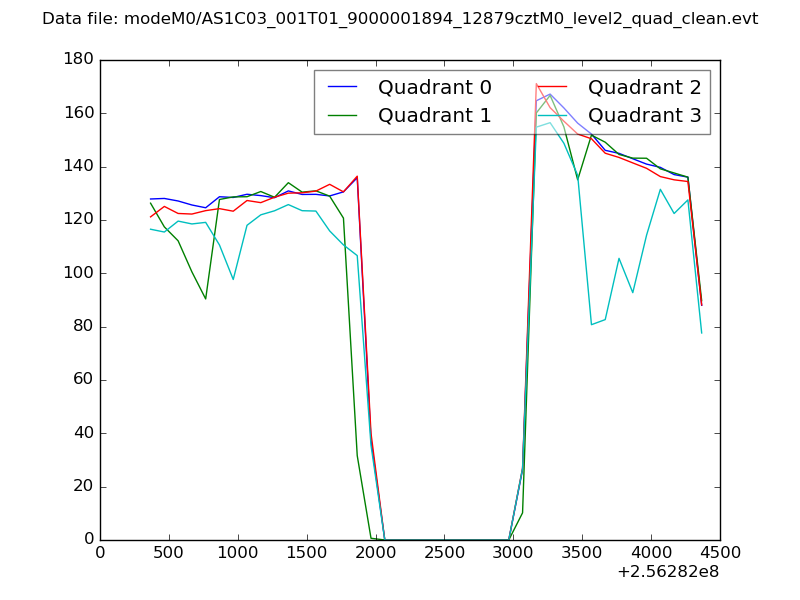 |
|
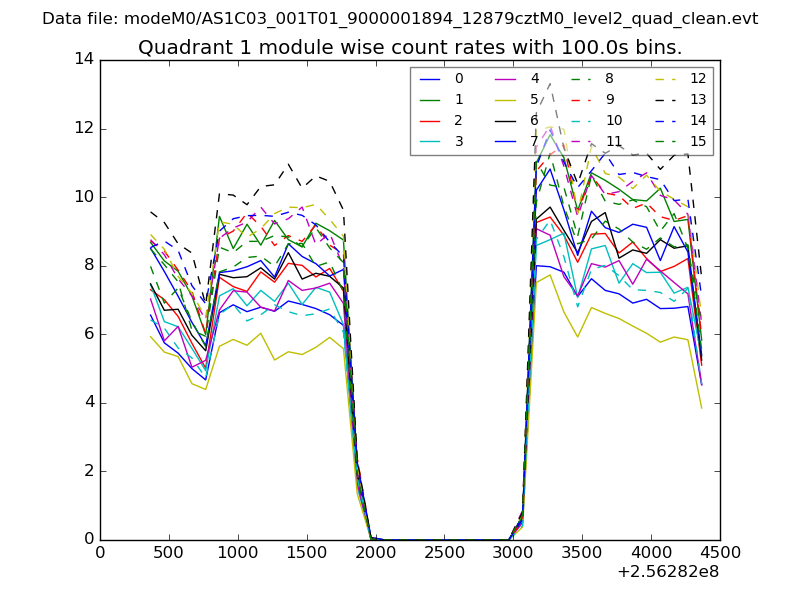
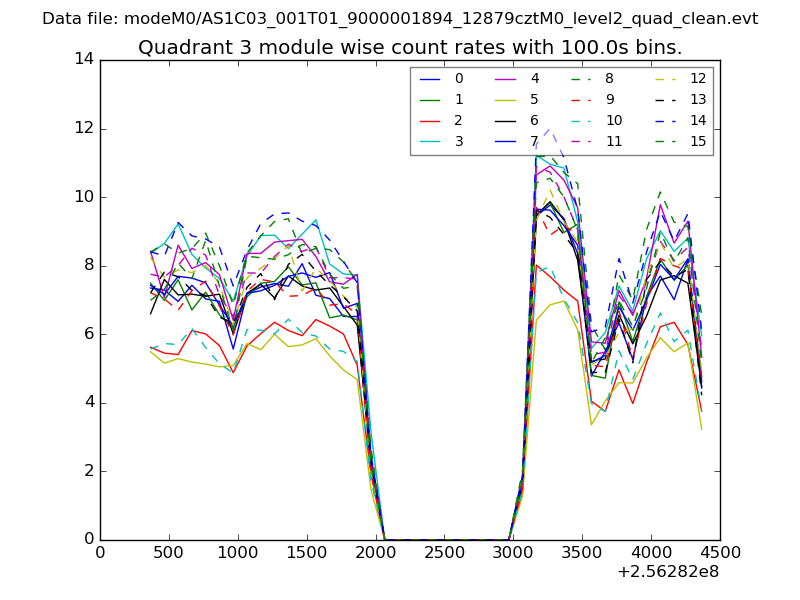
| Module-wise count rates for Quadrant A Data is divided into 100 sec bins |
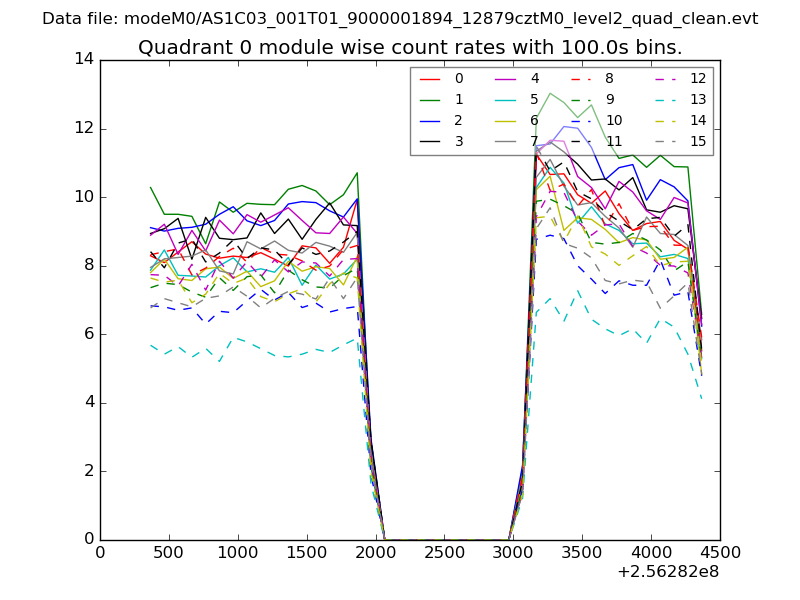 |
 |
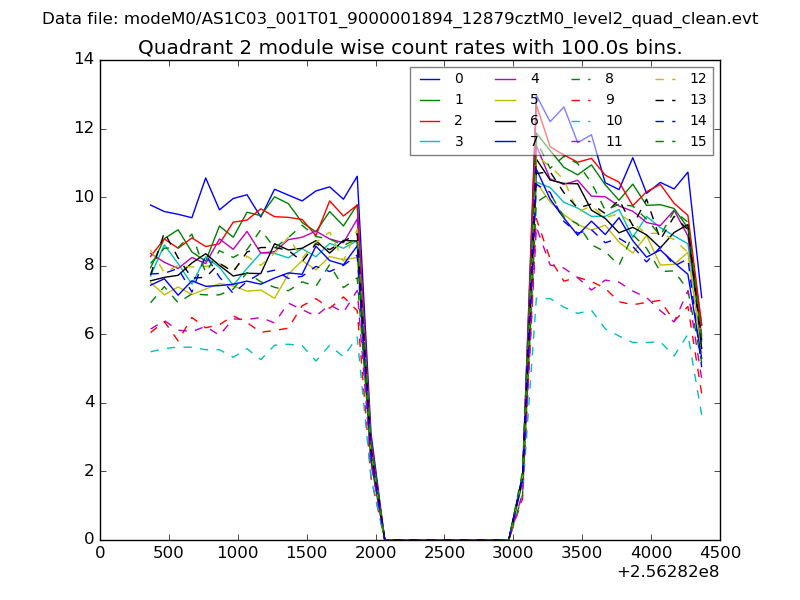
| Module-wise count rates for Quadrant B Data is divided into 100 sec bins |
 |
 |
| Module-wise count rates for Quadrant C Data is divided into 100 sec bins |
 |
 |
| Module-wise count rates for Quadrant D Data is divided into 100 sec bins |
 |
 |
| Parameter | Plot |
|---|---|
| CZT HV Monitor | 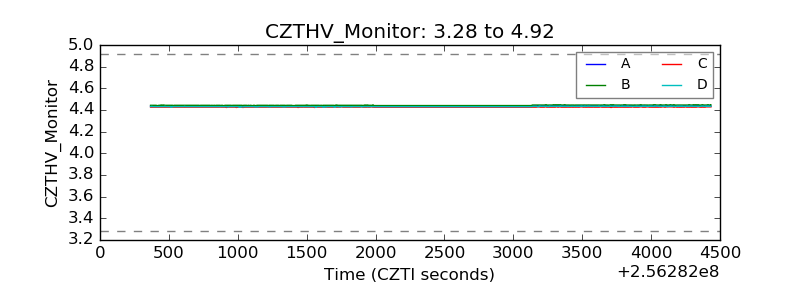 |
| D_VDD | 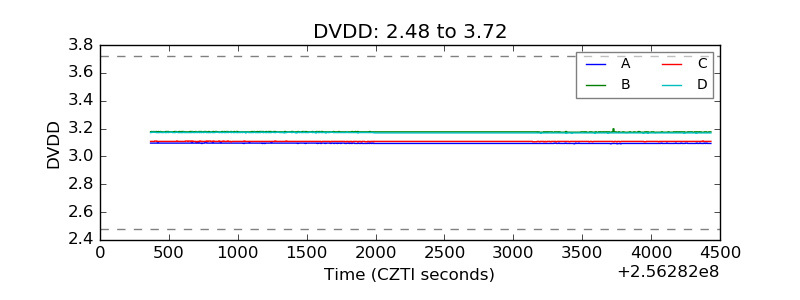 |
| Temperature 1 | 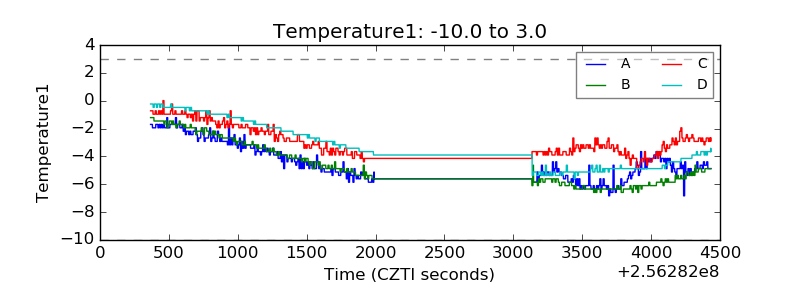 |
| Veto HV Monitor | 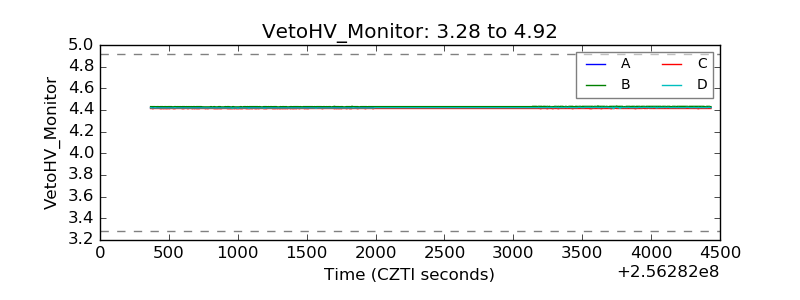 |
| Veto LLD | 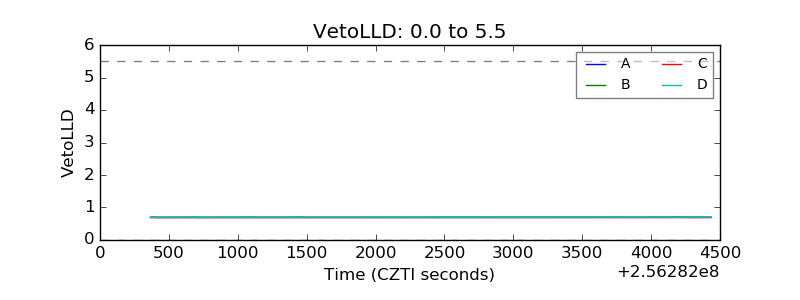 |
| Alpha Counter | 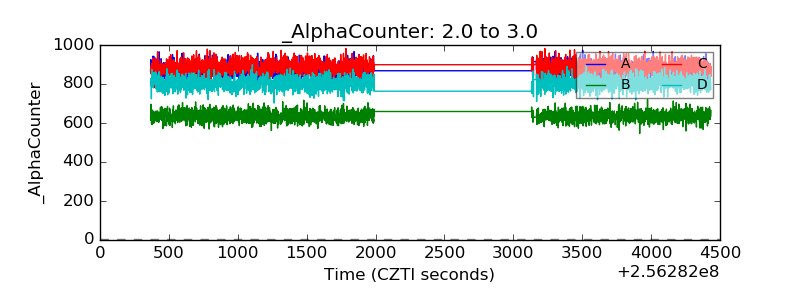 |
| _CPM_Rate | 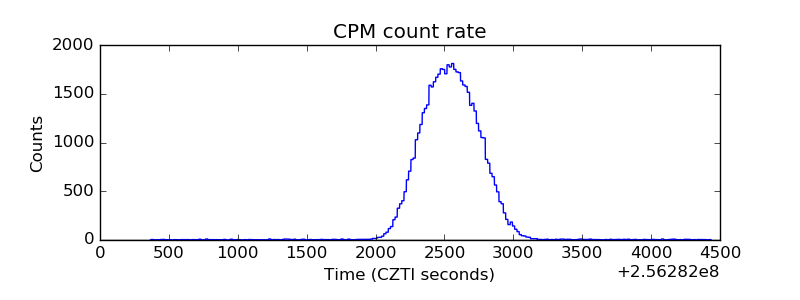 |
| CZT Counter | 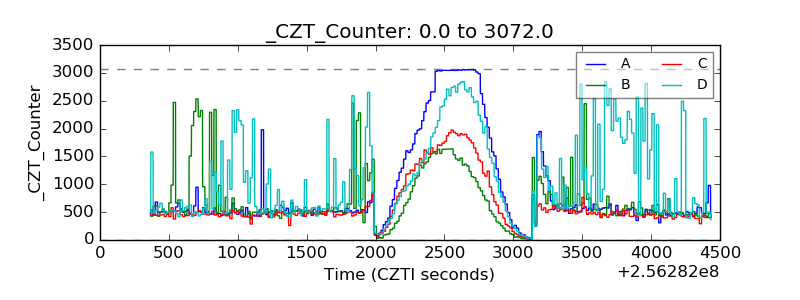 |
| +2.5 Volts monitor |  |
| +5 Volts monitor |  |
| _ROLL_ROT | 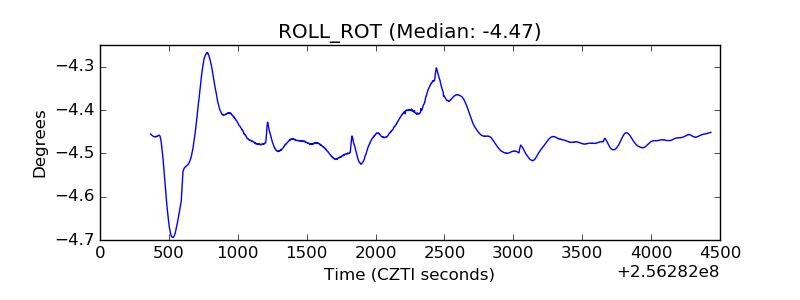 |
| _Roll_DEC | 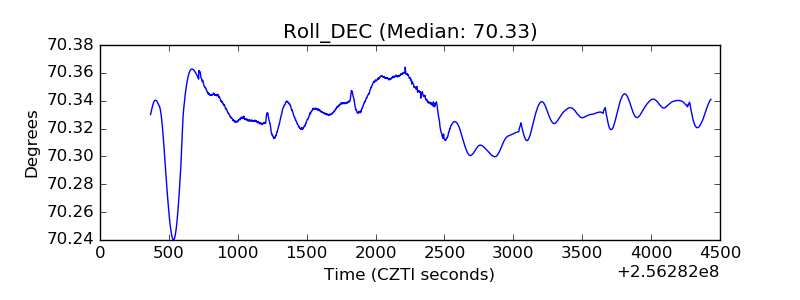 |
| _Roll_RA | 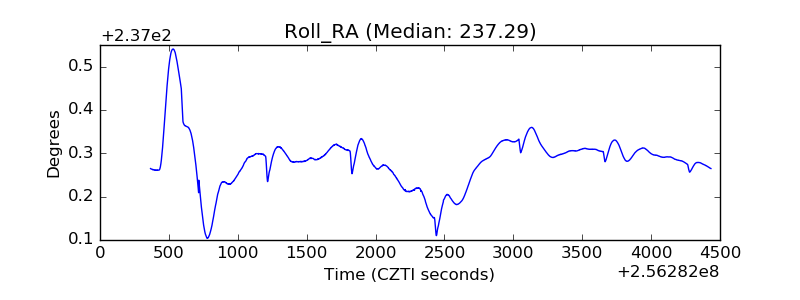 |
| Veto Counter |  |