| Param | Original file | Final file |
|---|---|---|
| Filename | modeM0/AS1C03_001T01_9000001894_12882cztM0_level2.evt | modeM0/AS1C03_001T01_9000001894_12882cztM0_level2_quad_clean.evt |
| Size (bytes) | 593,308,800 | 117,480,960 |
| Size | 565.8 MB | 112.0 MB |
| Events in quadrant A | 3,112,212 | 849,260 |
| Events in quadrant B | 5,058,760 | 792,353 |
| Events in quadrant C | 2,777,384 | 826,976 |
| Events in quadrant D | 6,619,981 | 676,170 |
| Mode M0 | |||
|---|---|---|---|
| Quadrant | BADHDUFLAG | Total packets | Discarded packets |
| A | 0 | 12610 | 2 |
| B | 0 | 18780 | 1 |
| C | 0 | 12032 | 1 |
| D | 0 | 23586 | 1 |
| Mode SS | |||
|---|---|---|---|
| Quadrant | BADHDUFLAG | Total packets | Discarded packets |
| A | 0 | 120 | 0 |
| B | 0 | 120 | 0 |
| C | 0 | 120 | 0 |
| D | 0 | 120 | 0 |
| Mode M9 | |||
|---|---|---|---|
| Quadrant | BADHDUFLAG | Total packets | Discarded packets |
| A | 0 | 13 | 0 |
| B | 0 | 13 | 0 |
| C | 0 | 13 | 0 |
| D | 0 | 13 | 0 |
| Quadrant | Total seconds | Saturated seconds | Saturation percentage |
|---|---|---|---|
| A | 5904 | 96 | 1.626016% |
| B | 5904 | 774 | 13.109756% |
| C | 5904 | 64 | 1.084011% |
| D | 5904 | 1422 | 24.085366% |
Noise dominated data is calculated using 1-second bins in cleaned event files. If a bin has >2000 counts, and if more than 50% of those come from <1% of pixels, then it is considered to be noise-dominated and hence unusable.
| Quadrant | # 1 sec bins | Bins with >0 counts | Bins with >2000 counts | High rate bins dominated by noise | Noise dominated (total time) | Noise dominated (detector-on time) | Marked lightcurve |
|---|---|---|---|---|---|---|---|
| A | 7215 | 5905 | 4 | 4 | 0.06% | 0.07% |  |
| B | 7215 | 5905 | 438 | 438 | 6.07% | 7.42% |  |
| C | 7215 | 5906 | 0 | 0 | 0.00% | 0.00% |  |
| D | 7215 | 5906 | 1176 | 1176 | 16.30% | 19.91% | 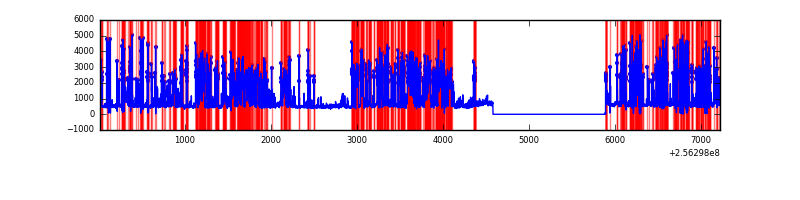 |
Top three noisy pixels from each quadrant. If the there are fewer than three noisy pixels in the level2.evt file, extra rows are filled as -1
| Pixel properties | Quadrant properties | ||||||
|---|---|---|---|---|---|---|---|
| Quadrant | DetID | PixID | Counts | Sigma | Mean | Median | Sigma |
| A | 1 | 162 | 69344 | 459.12 | 747 | 730 | 149.4 |
| A | 1 | 178 | 38481 | 252.6 | 747 | 730 | 149.4 |
| A | 15 | 174 | 33376 | 218.44 | 747 | 730 | 149.4 |
| B | 4 | 239 | 1162766 | 9065.2 | 696 | 678 | 128.2 |
| B | 0 | 85 | 905695 | 7059.84 | 696 | 678 | 128.2 |
| B | 0 | 219 | 74234 | 573.79 | 696 | 678 | 128.2 |
| C | 13 | 61 | 5130 | 27.34 | 712 | 713 | 161.5 |
| C | 3 | 202 | 1720 | 6.23 | 712 | 713 | 161.5 |
| C | 3 | 203 | 1581 | 5.37 | 712 | 713 | 161.5 |
| D | 1 | 52 | 4070825 | 27323.66 | 627 | 608 | 149.0 |
| D | 4 | 95 | 89879 | 599.28 | 627 | 608 | 149.0 |
| D | 8 | 195 | 46200 | 306.06 | 627 | 608 | 149.0 |
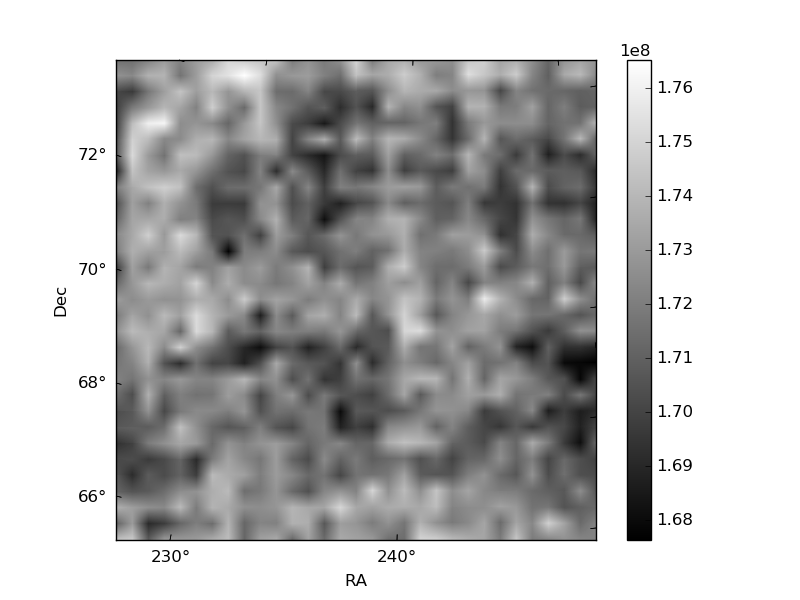
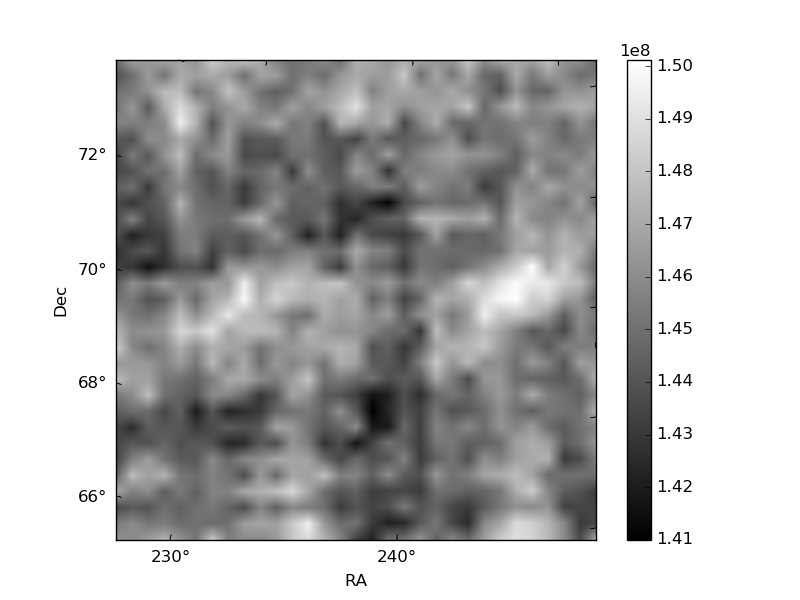
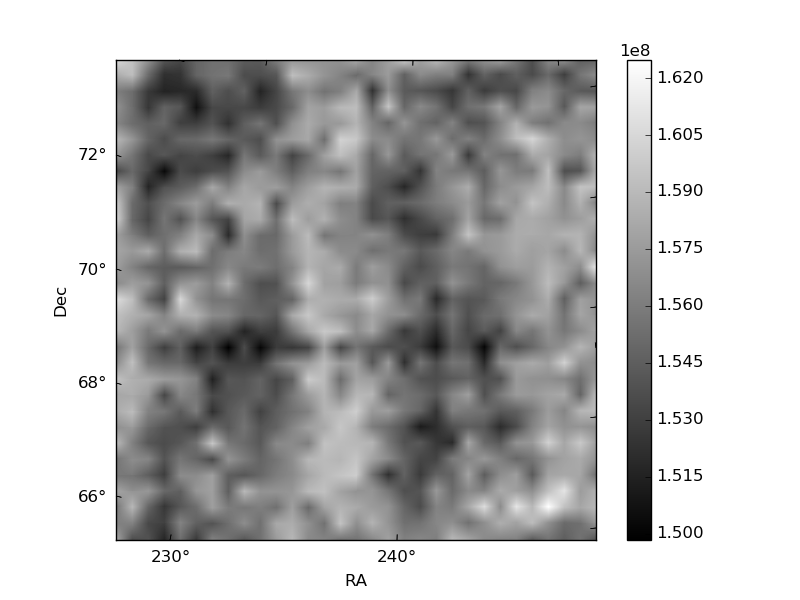
Histogram calculated using DETX and DETY for each event in the final _common_clean file
| Quadrant A | 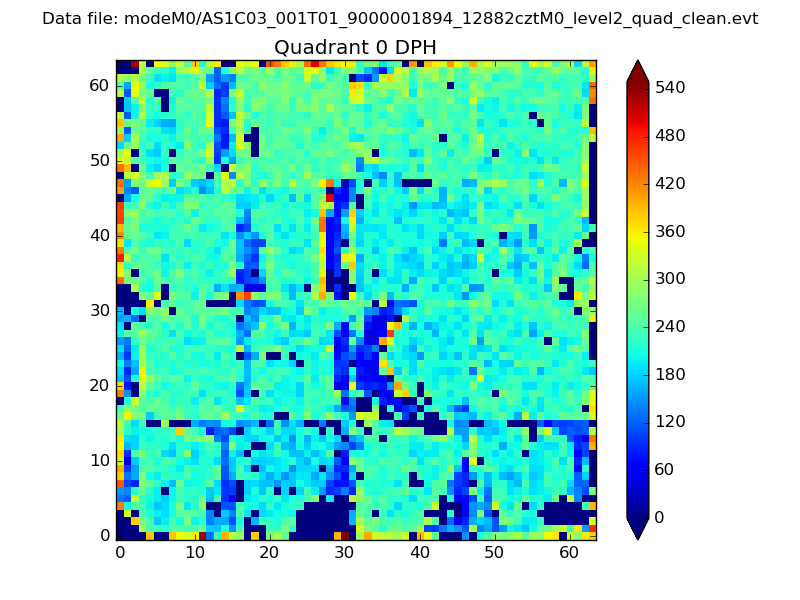 |
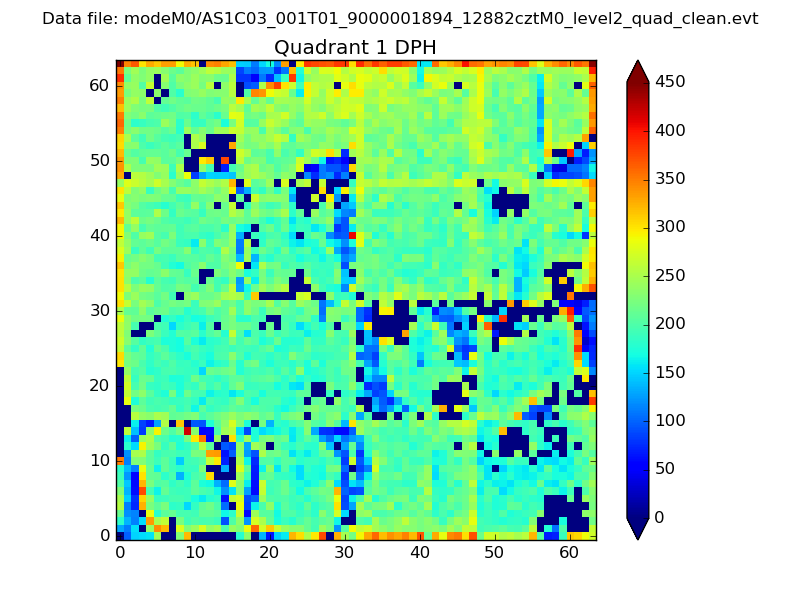 |
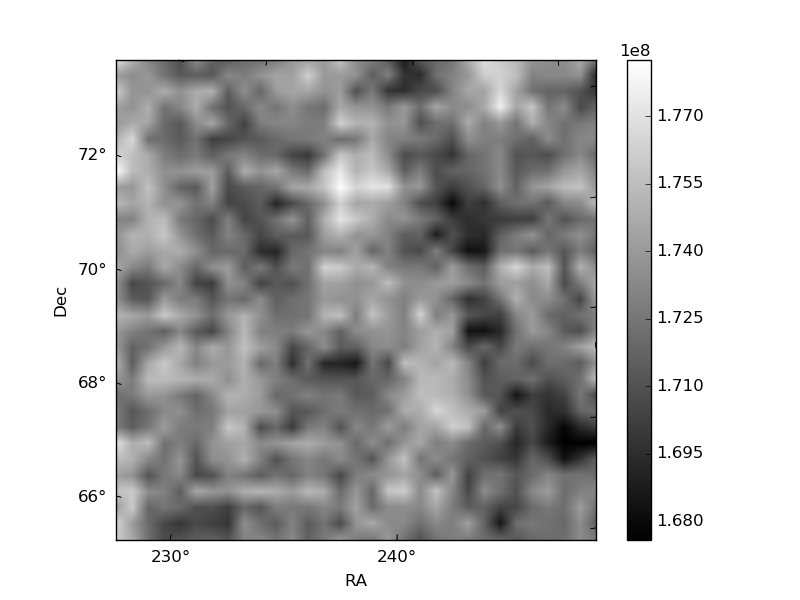
Quadrant B |
|---|---|---|---|
| Quadrant D | 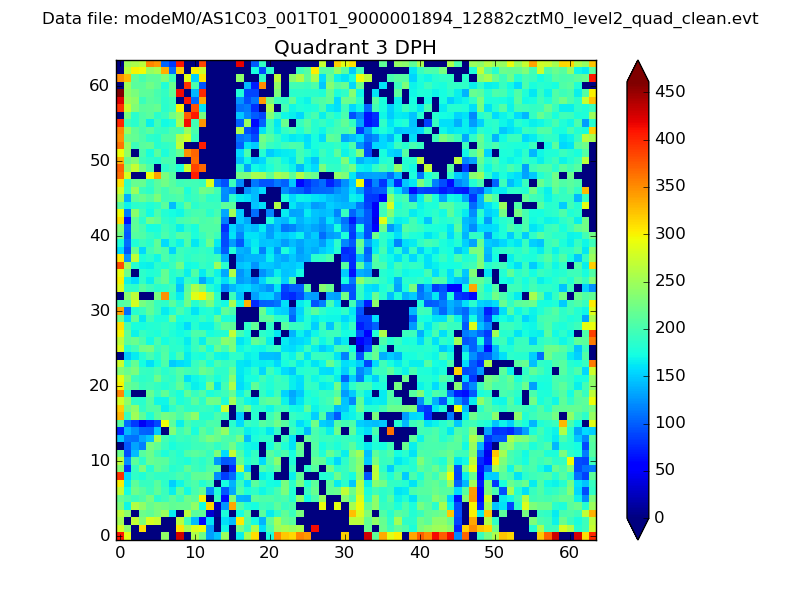 |
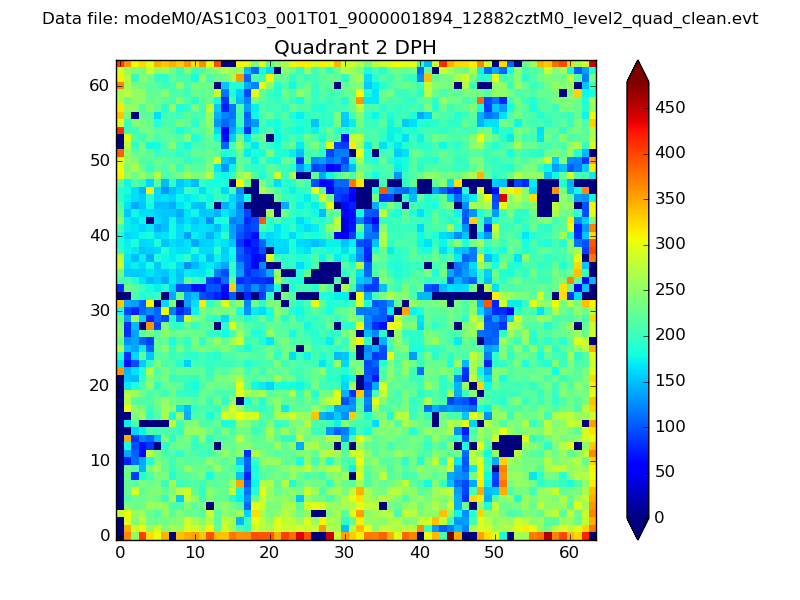 |
Quadrant C |
| Plot type | Count rate plots | Images |
|---|---|---|
| Comparison with Poisson distribution Blue bars denote a histogram of data divided into 1 sec bins. Red curve is a Poisson curve with rate = median count rate of data. |
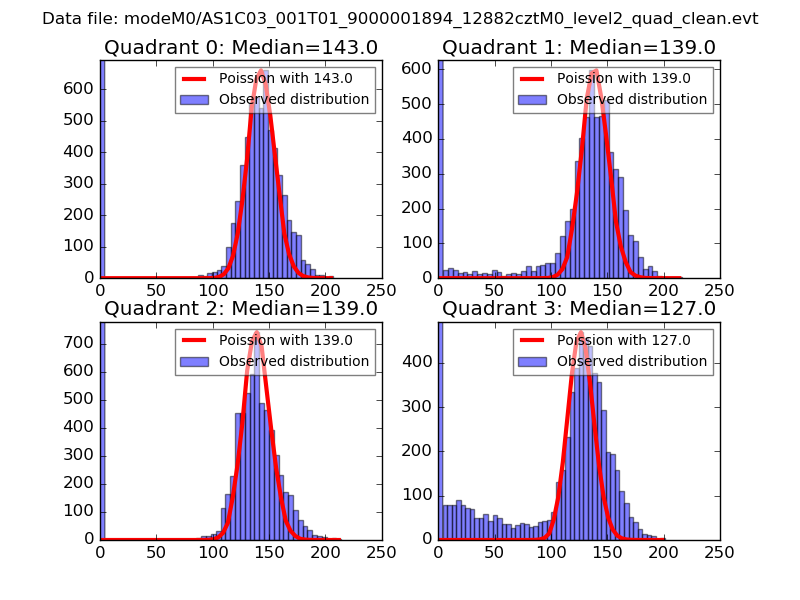 |
 |
| Quadrant-wise count rates Data is divided into 100 sec bins |
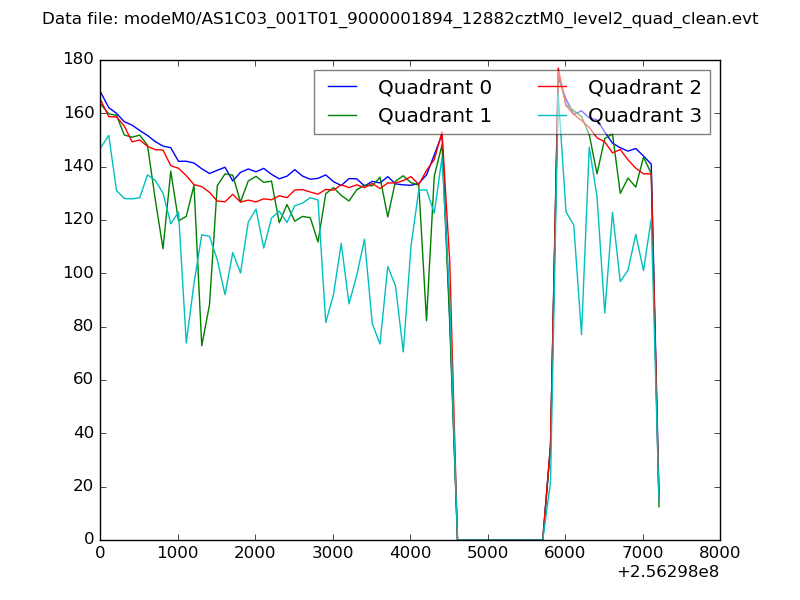 |
|
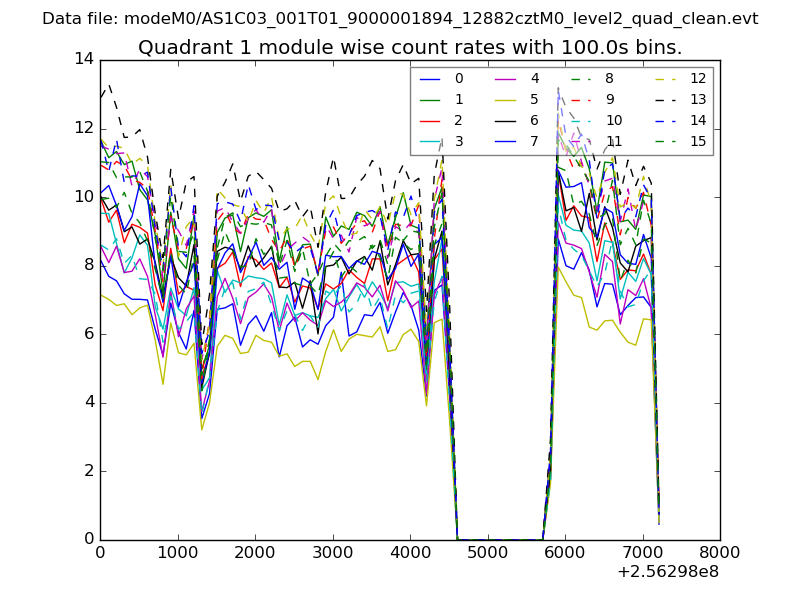
| Module-wise count rates for Quadrant A Data is divided into 100 sec bins |
 |
 |
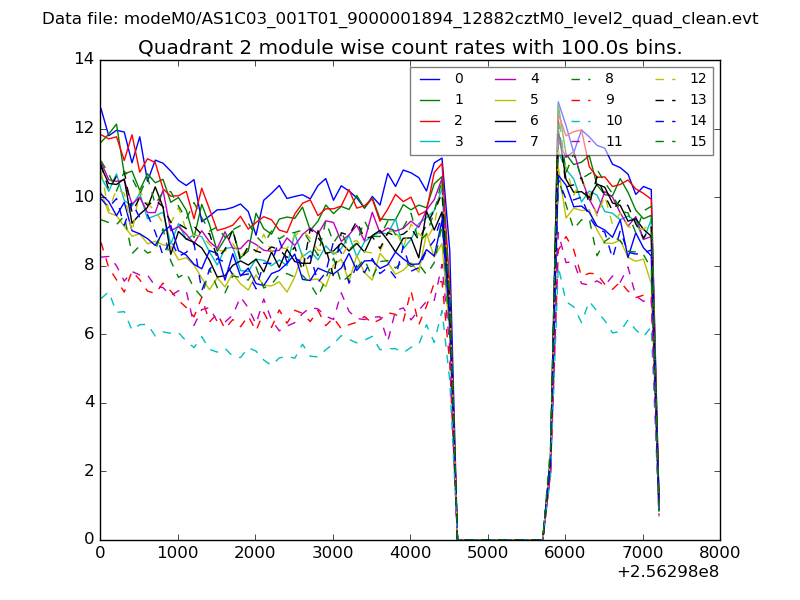
| Module-wise count rates for Quadrant B Data is divided into 100 sec bins |
 |
 |
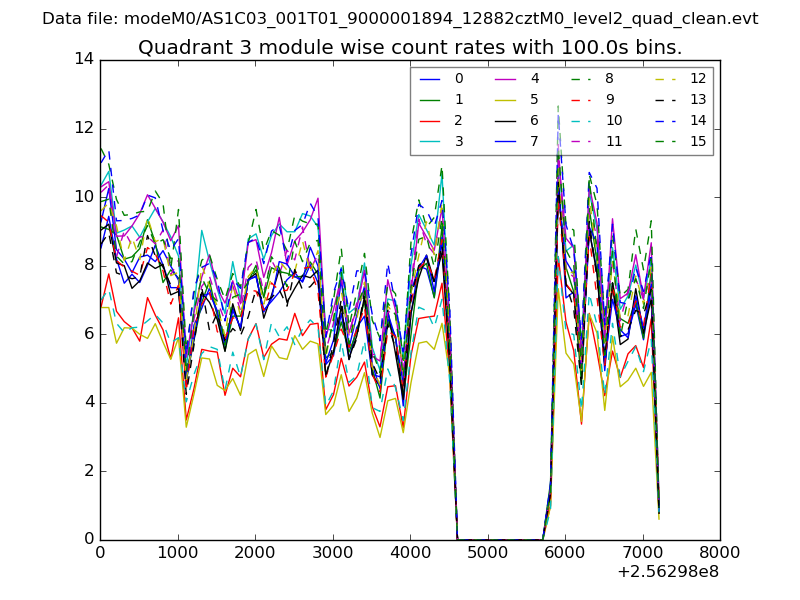
| Module-wise count rates for Quadrant C Data is divided into 100 sec bins |
 |
 |
| Module-wise count rates for Quadrant D Data is divided into 100 sec bins |
 |
 |
| Parameter | Plot |
|---|---|
| CZT HV Monitor | 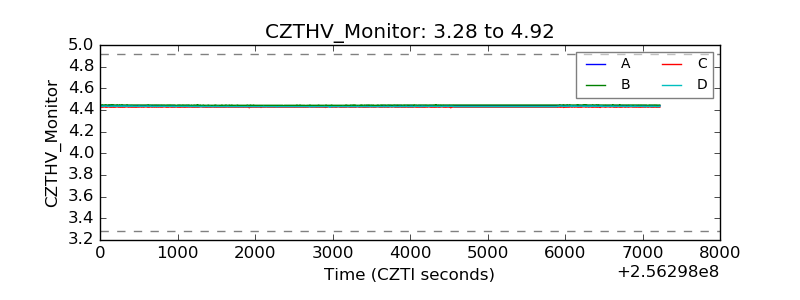 |
| D_VDD | 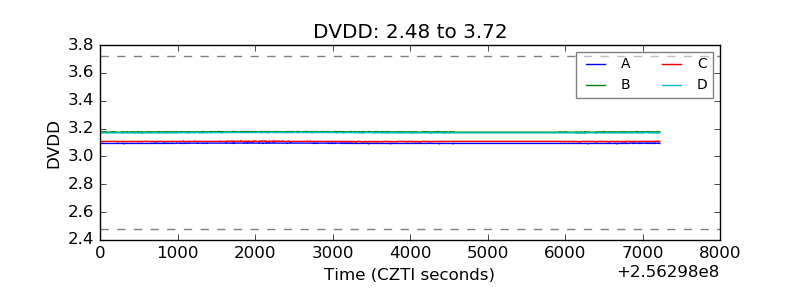 |
| Temperature 1 | 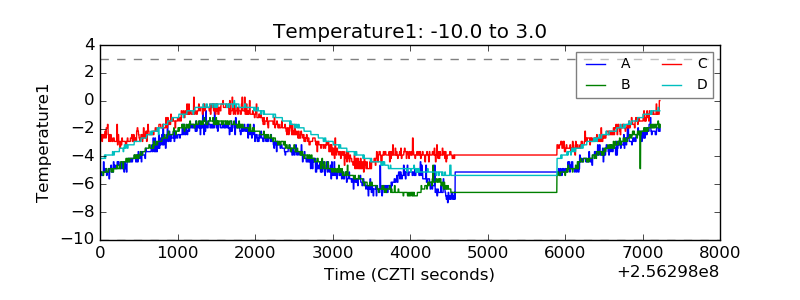 |
| Veto HV Monitor | 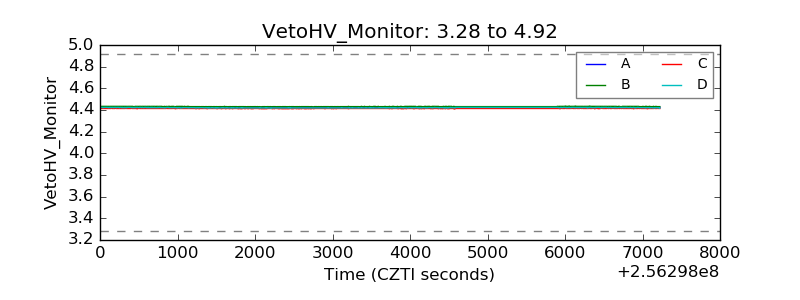 |
| Veto LLD |  |
| Alpha Counter | 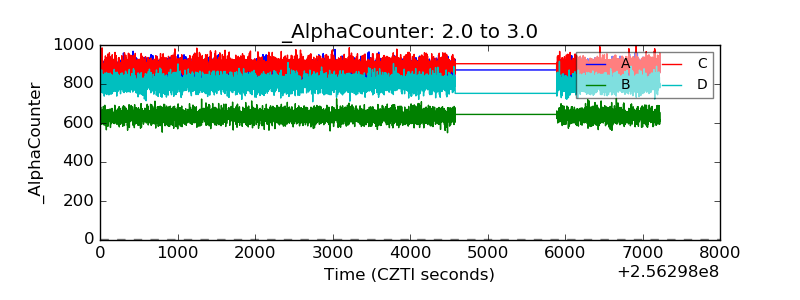 |
| _CPM_Rate | 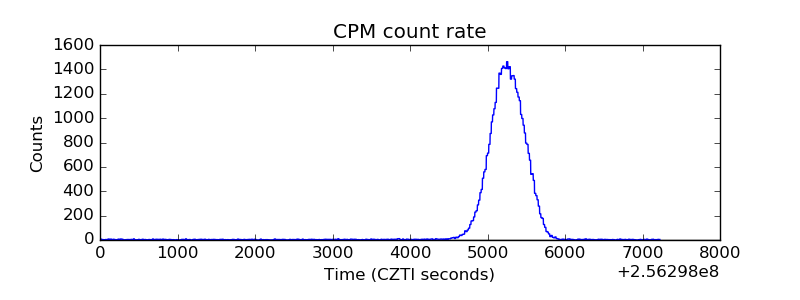 |
| CZT Counter | 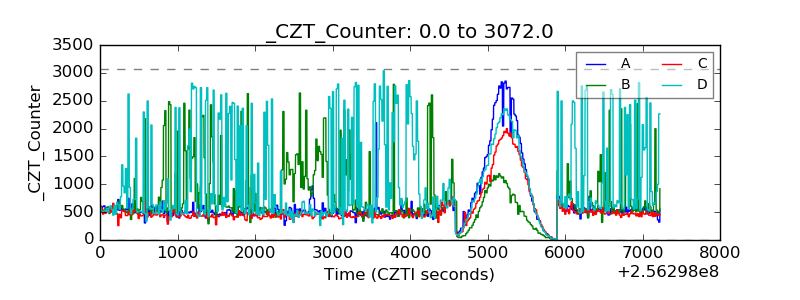 |
| +2.5 Volts monitor |  |
| +5 Volts monitor |  |
| _ROLL_ROT | 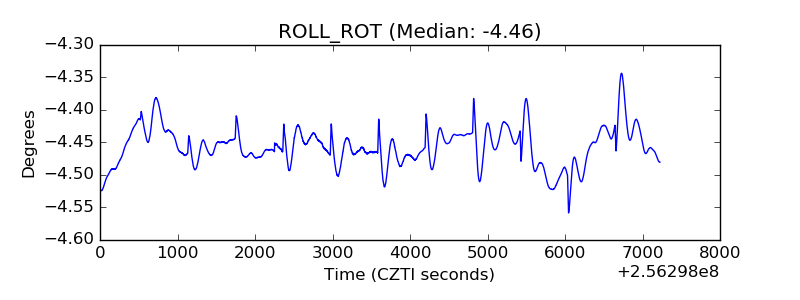 |
| _Roll_DEC |  |
| _Roll_RA | 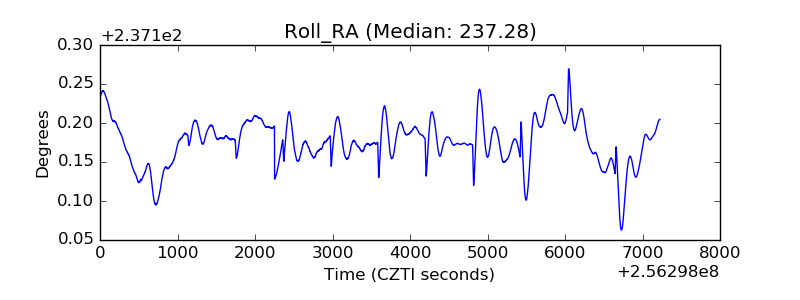 |
| Veto Counter | 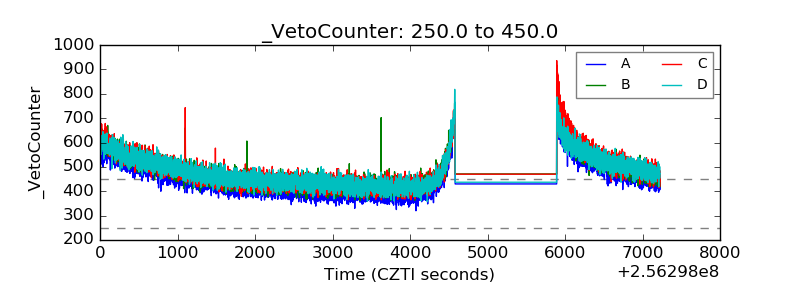 |