| Param | Original file | Final file |
|---|---|---|
| Filename | modeM0/AS1C03_001T01_9000001894_12885cztM0_level2.evt | modeM0/AS1C03_001T01_9000001894_12885cztM0_level2_quad_clean.evt |
| Size (bytes) | 491,892,480 | 118,330,560 |
| Size | 469.1 MB | 112.8 MB |
| Events in quadrant A | 3,086,776 | 810,192 |
| Events in quadrant B | 4,269,937 | 779,482 |
| Events in quadrant C | 2,891,279 | 798,680 |
| Events in quadrant D | 4,206,400 | 741,042 |
| Mode M0 | |||
|---|---|---|---|
| Quadrant | BADHDUFLAG | Total packets | Discarded packets |
| A | 0 | 13450 | 2 |
| B | 0 | 16901 | 1 |
| C | 0 | 13219 | 1 |
| D | 0 | 17007 | 1 |
| Mode SS | |||
|---|---|---|---|
| Quadrant | BADHDUFLAG | Total packets | Discarded packets |
| A | 0 | 132 | 0 |
| B | 0 | 132 | 0 |
| C | 0 | 132 | 0 |
| D | 0 | 132 | 0 |
| Mode M9 | |||
|---|---|---|---|
| Quadrant | BADHDUFLAG | Total packets | Discarded packets |
| A | 0 | 6 | 0 |
| B | 0 | 6 | 0 |
| C | 0 | 6 | 0 |
| D | 0 | 6 | 0 |
| Quadrant | Total seconds | Saturated seconds | Saturation percentage |
|---|---|---|---|
| A | 6512 | 33 | 0.506757% |
| B | 6512 | 485 | 7.447789% |
| C | 6512 | 27 | 0.414619% |
| D | 6512 | 432 | 6.633907% |
Noise dominated data is calculated using 1-second bins in cleaned event files. If a bin has >2000 counts, and if more than 50% of those come from <1% of pixels, then it is considered to be noise-dominated and hence unusable.
| Quadrant | # 1 sec bins | Bins with >0 counts | Bins with >2000 counts | High rate bins dominated by noise | Noise dominated (total time) | Noise dominated (detector-on time) | Marked lightcurve |
|---|---|---|---|---|---|---|---|
| A | 7108 | 6514 | 0 | 0 | 0.00% | 0.00% | 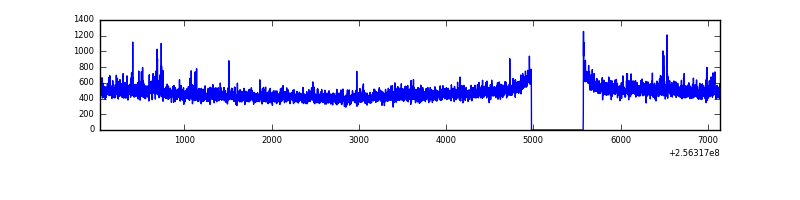 |
| B | 7108 | 6514 | 258 | 258 | 3.63% | 3.96% | 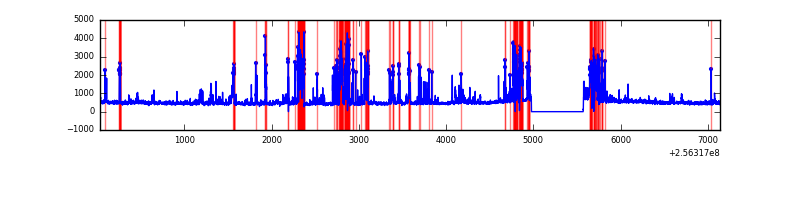 |
| C | 7108 | 6514 | 0 | 0 | 0.00% | 0.00% | 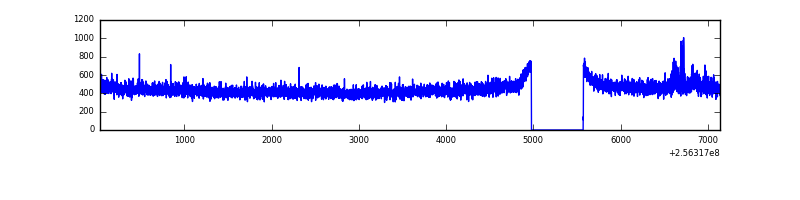 |
| D | 7108 | 6514 | 273 | 273 | 3.84% | 4.19% | 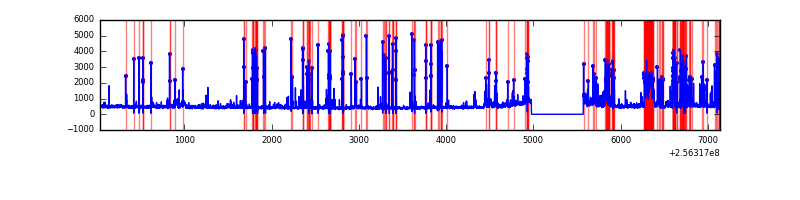 |
Top three noisy pixels from each quadrant. If the there are fewer than three noisy pixels in the level2.evt file, extra rows are filled as -1
| Pixel properties | Quadrant properties | ||||||
|---|---|---|---|---|---|---|---|
| Quadrant | DetID | PixID | Counts | Sigma | Mean | Median | Sigma |
| A | 1 | 162 | 67934 | 437.49 | 754 | 736 | 153.6 |
| A | 1 | 178 | 37765 | 241.07 | 754 | 736 | 153.6 |
| A | 1 | 161 | 31586 | 200.85 | 754 | 736 | 153.6 |
| B | 4 | 239 | 944908 | 6944.44 | 723 | 705 | 136.0 |
| B | 0 | 85 | 191437 | 1402.8 | 723 | 705 | 136.0 |
| B | 0 | 219 | 92005 | 671.49 | 723 | 705 | 136.0 |
| C | 3 | 233 | 33897 | 197.18 | 733 | 735 | 168.2 |
| C | 13 | 61 | 5476 | 28.19 | 733 | 735 | 168.2 |
| C | 3 | 202 | 1855 | 6.66 | 733 | 735 | 168.2 |
| D | 1 | 52 | 1185060 | 7061.45 | 706 | 684 | 167.7 |
| D | 13 | 122 | 242712 | 1443.01 | 706 | 684 | 167.7 |
| D | 4 | 95 | 35039 | 204.83 | 706 | 684 | 167.7 |
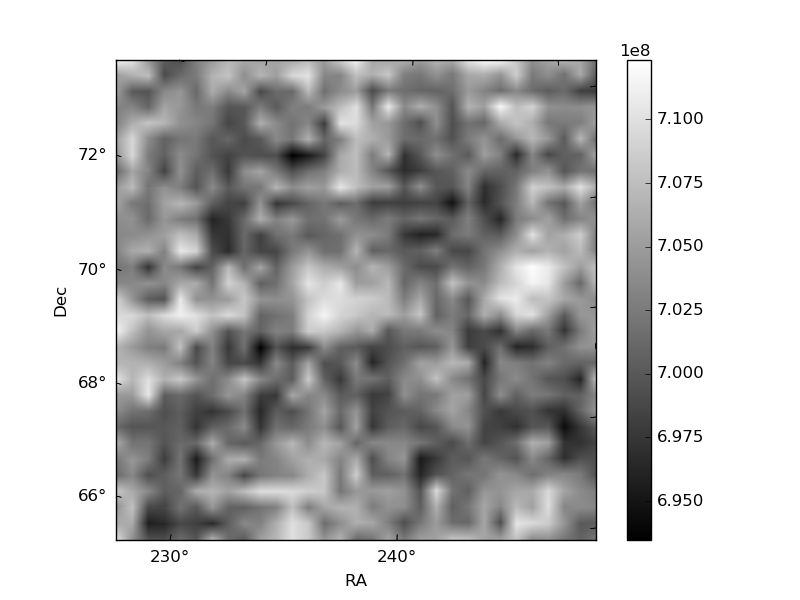
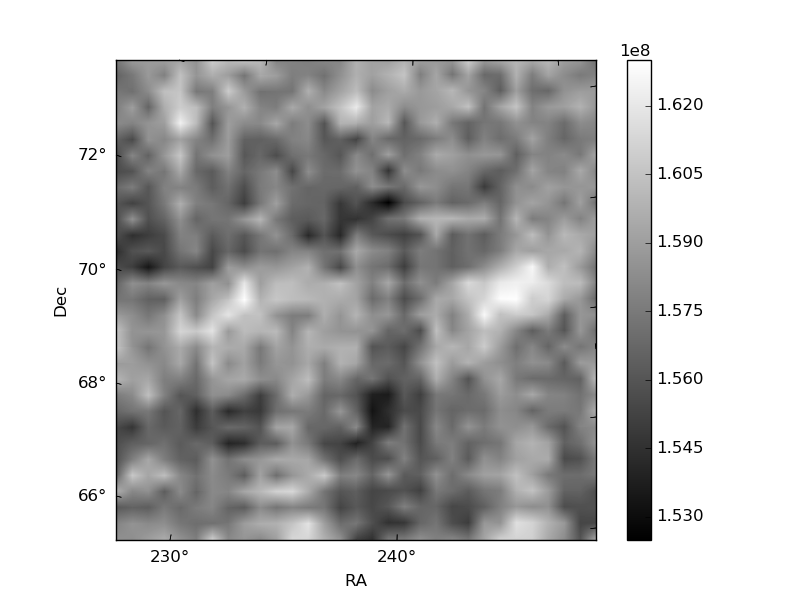
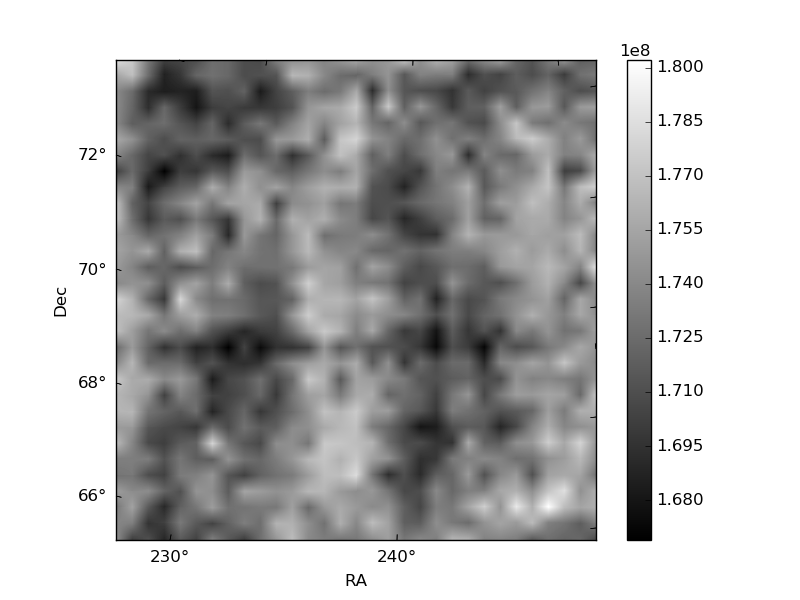
Histogram calculated using DETX and DETY for each event in the final _common_clean file
| Quadrant A | 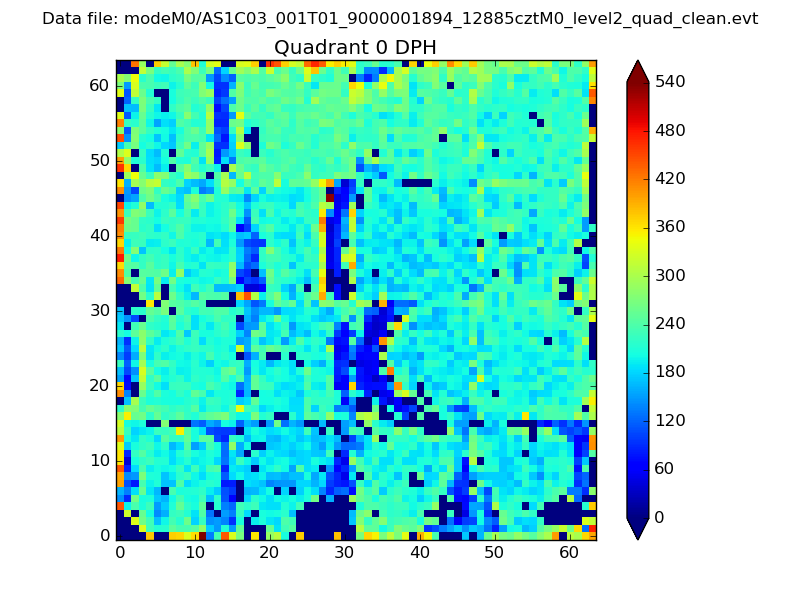 |
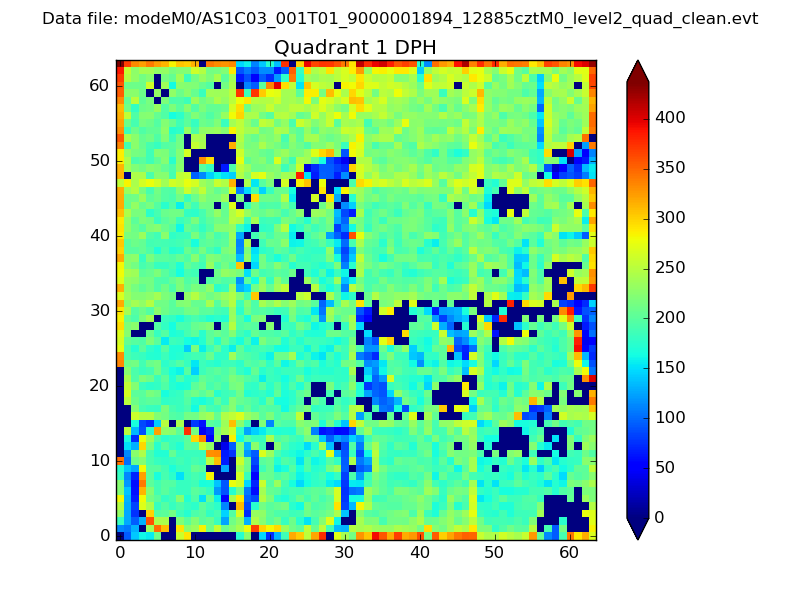 |
Quadrant B |
|---|---|---|---|
| Quadrant D | 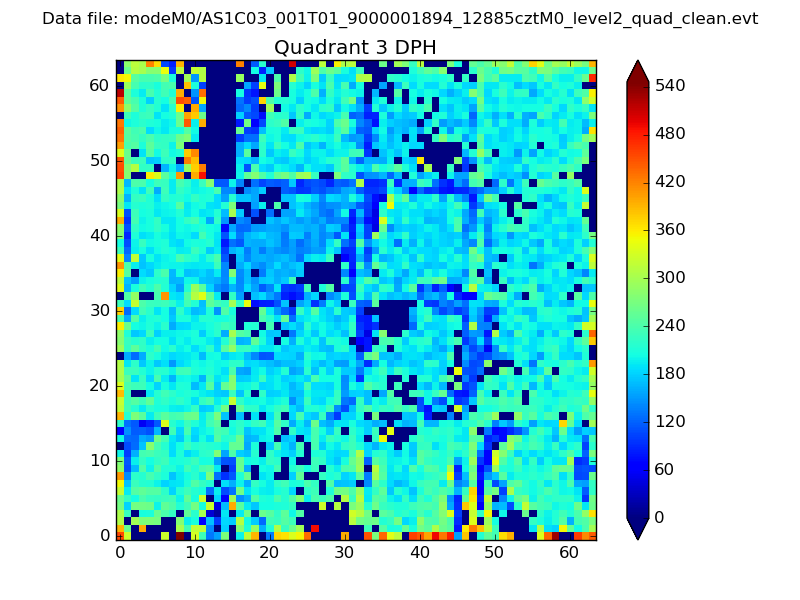 |
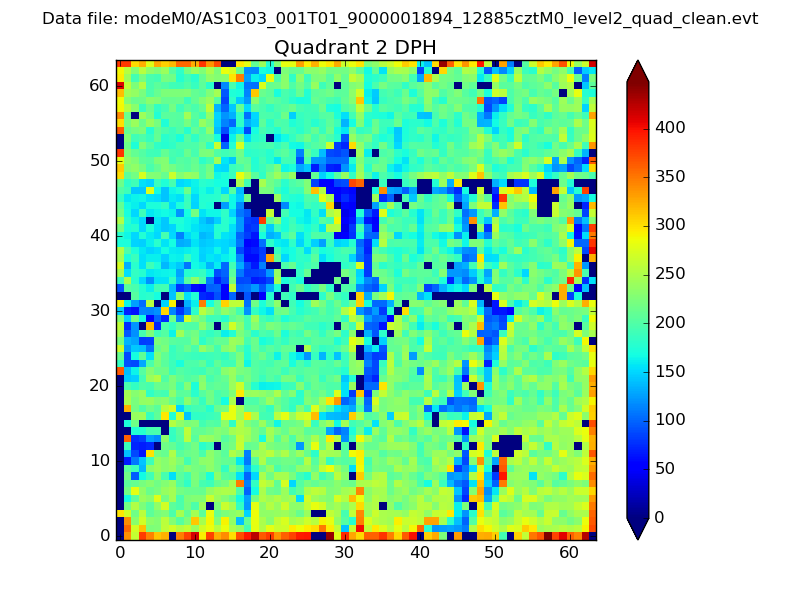 |
Quadrant C |
| Plot type | Count rate plots | Images |
|---|---|---|
| Comparison with Poisson distribution Blue bars denote a histogram of data divided into 1 sec bins. Red curve is a Poisson curve with rate = median count rate of data. |
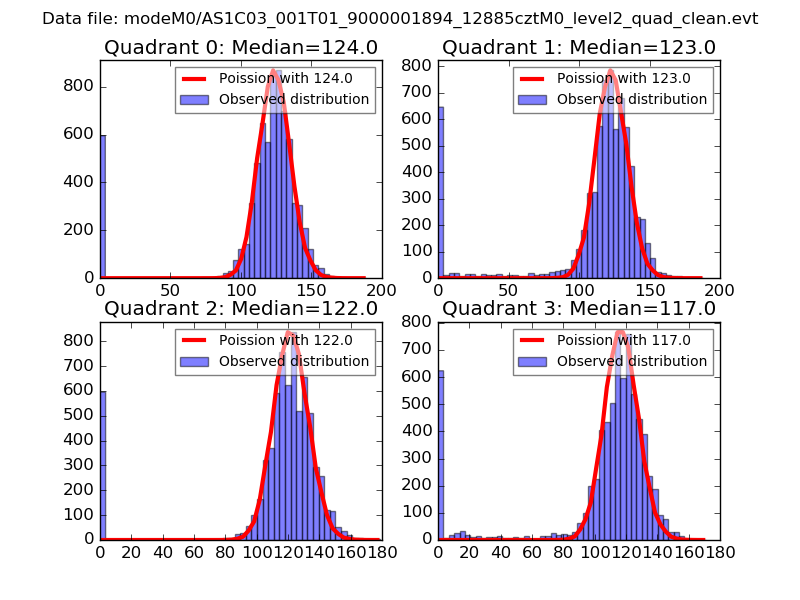 |
 |
| Quadrant-wise count rates Data is divided into 100 sec bins |
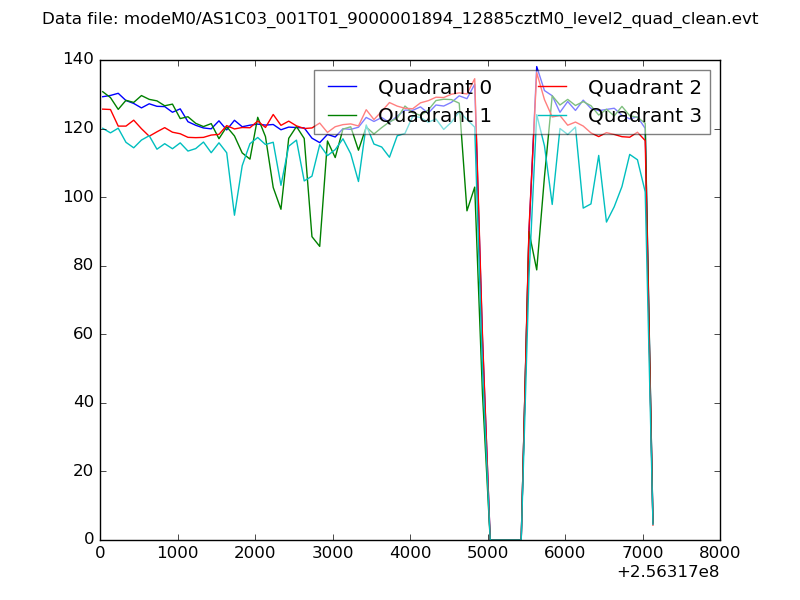 |
|
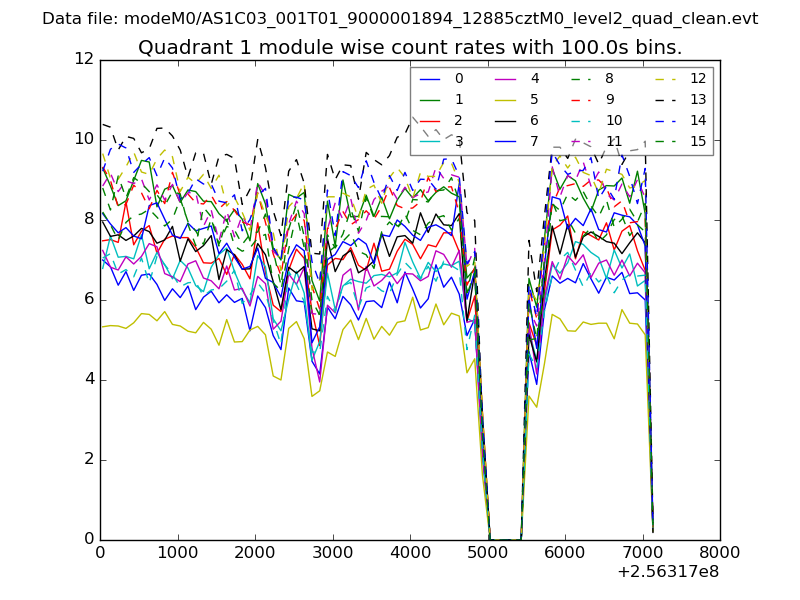
| Module-wise count rates for Quadrant A Data is divided into 100 sec bins |
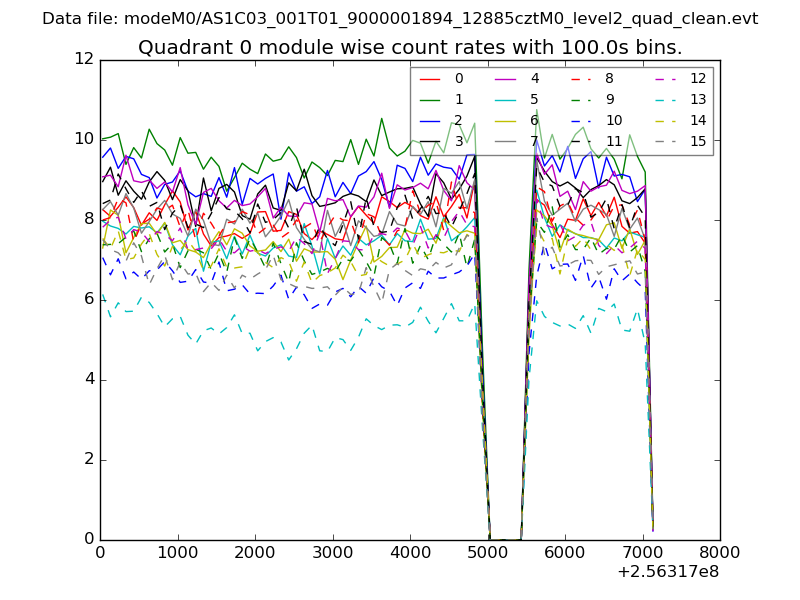 |
 |
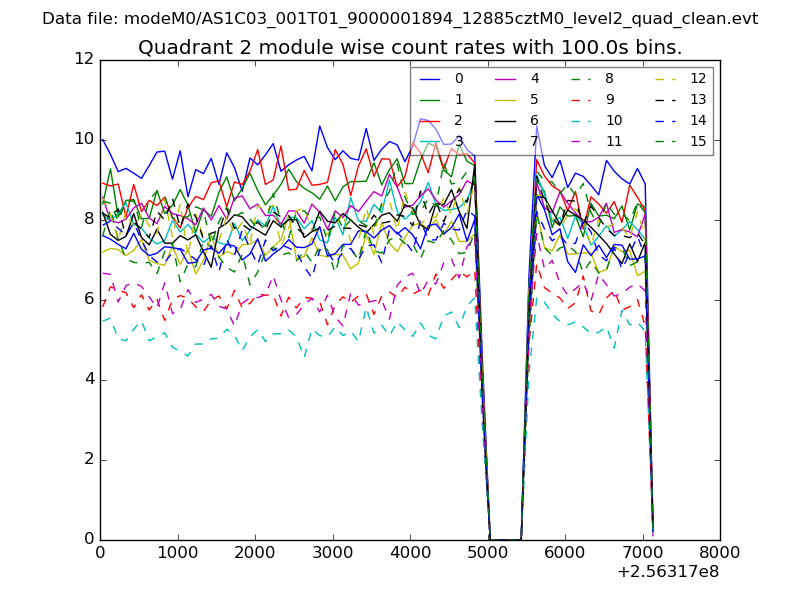
| Module-wise count rates for Quadrant B Data is divided into 100 sec bins |
 |
 |
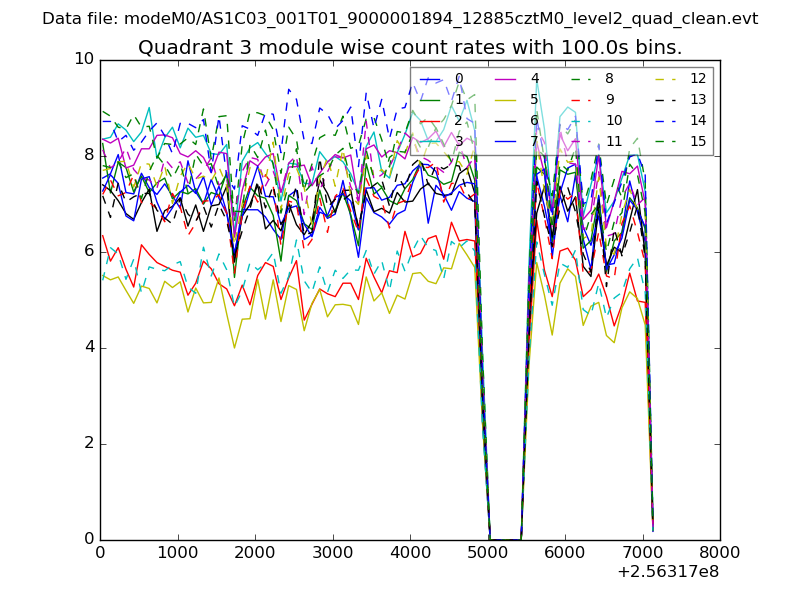
| Module-wise count rates for Quadrant C Data is divided into 100 sec bins |
 |
 |
| Module-wise count rates for Quadrant D Data is divided into 100 sec bins |
 |
 |
| Parameter | Plot |
|---|---|
| CZT HV Monitor | 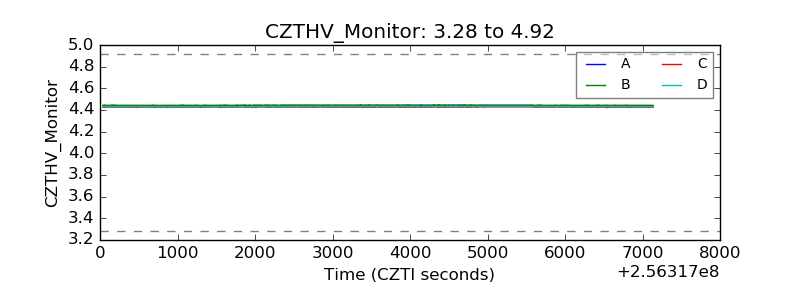 |
| D_VDD | 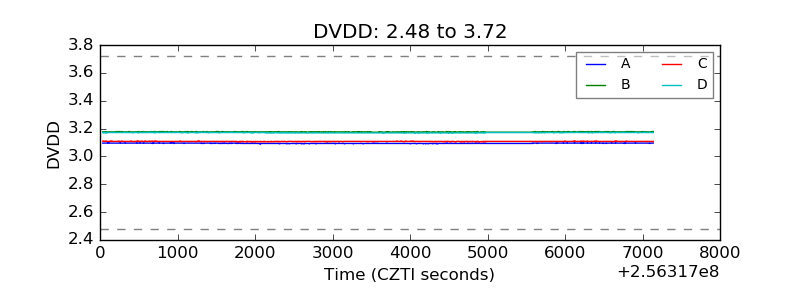 |
| Temperature 1 | 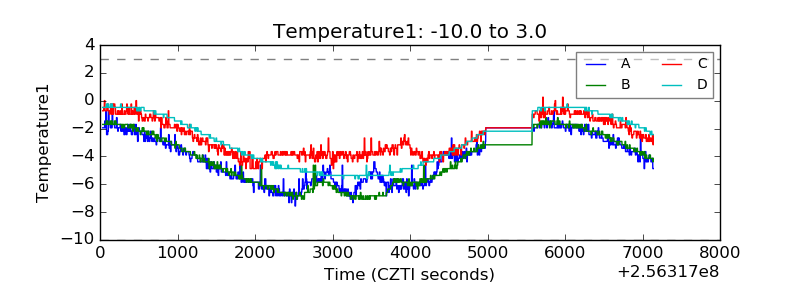 |
| Veto HV Monitor | 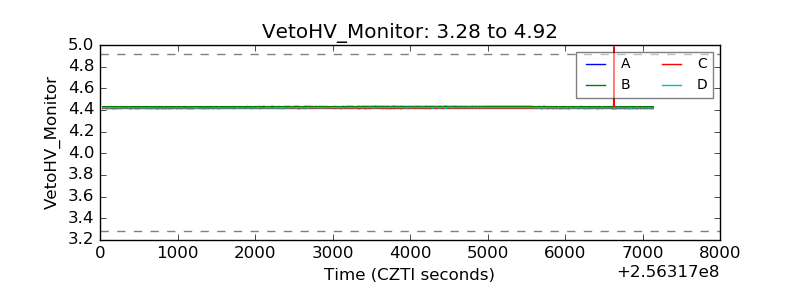 |
| Veto LLD | 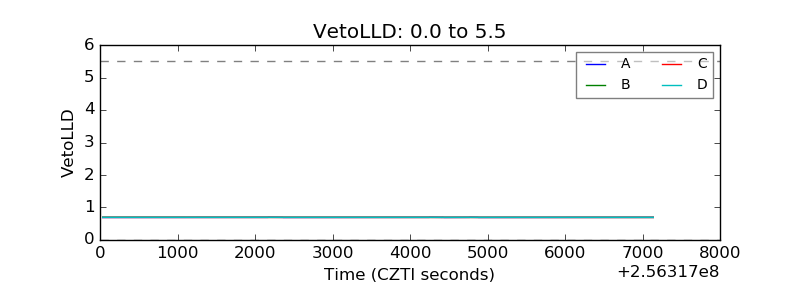 |
| Alpha Counter | 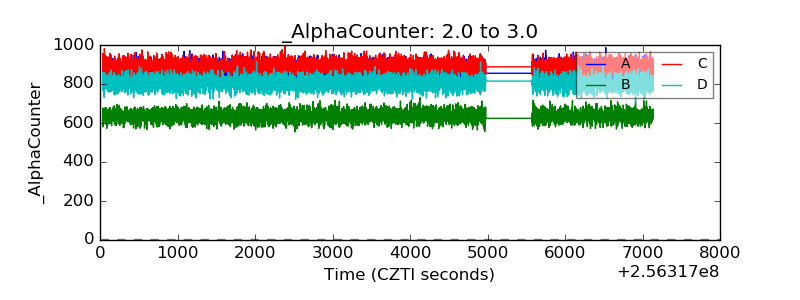 |
| _CPM_Rate | 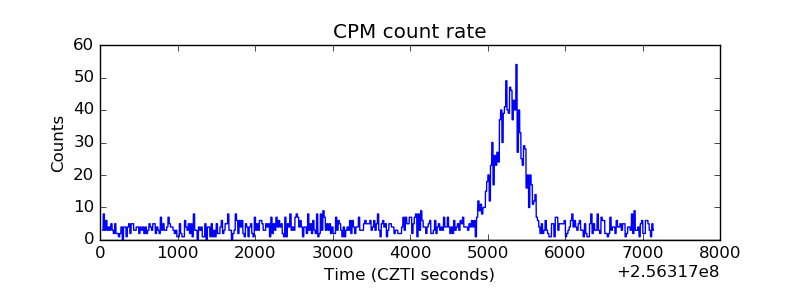 |
| CZT Counter | 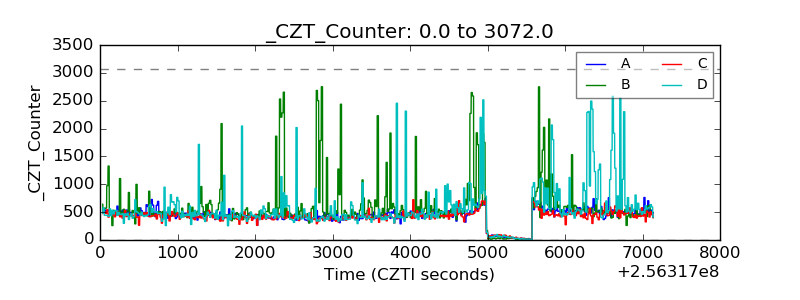 |
| +2.5 Volts monitor |  |
| +5 Volts monitor |  |
| _ROLL_ROT | 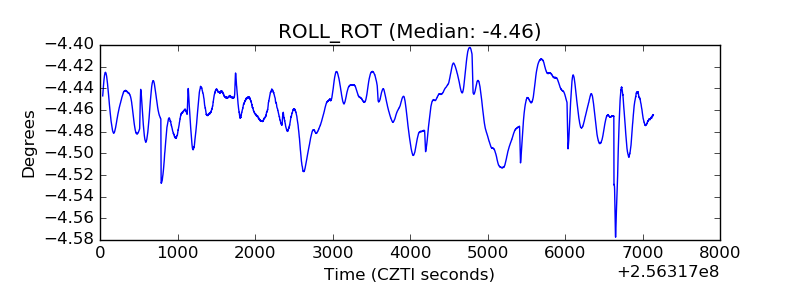 |
| _Roll_DEC | 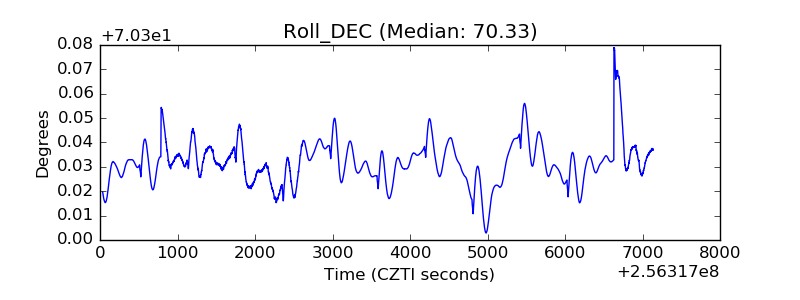 |
| _Roll_RA | 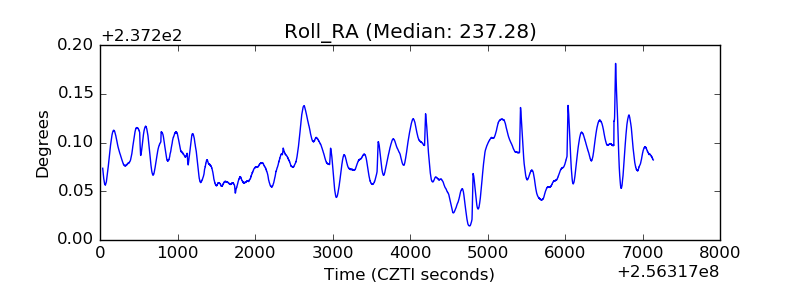 |
| Veto Counter | 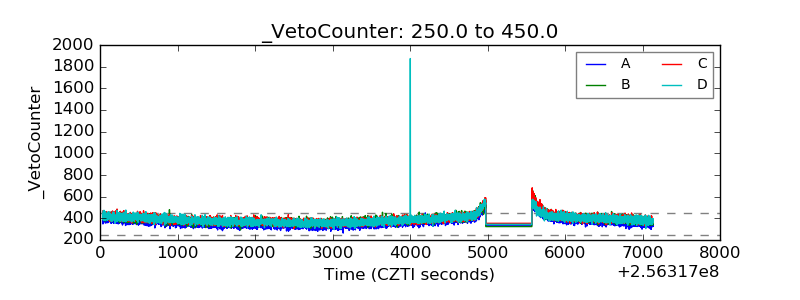 |