| Param | Original file | Final file |
|---|---|---|
| Filename | modeM0/AS1C03_001T01_9000001894_12887cztM0_level2.evt | modeM0/AS1C03_001T01_9000001894_12887cztM0_level2_quad_clean.evt |
| Size (bytes) | 626,112,000 | 141,094,080 |
| Size | 597.1 MB | 134.6 MB |
| Events in quadrant A | 4,124,233 | 961,041 |
| Events in quadrant B | 4,868,390 | 920,269 |
| Events in quadrant C | 3,561,772 | 957,861 |
| Events in quadrant D | 5,874,109 | 887,021 |
| Mode M0 | |||
|---|---|---|---|
| Quadrant | BADHDUFLAG | Total packets | Discarded packets |
| A | 0 | 17419 | 3 |
| B | 0 | 19766 | 2 |
| C | 0 | 16191 | 2 |
| D | 0 | 22896 | 2 |
| Mode SS | |||
|---|---|---|---|
| Quadrant | BADHDUFLAG | Total packets | Discarded packets |
| A | 0 | 162 | 0 |
| B | 0 | 162 | 0 |
| C | 0 | 162 | 0 |
| D | 0 | 162 | 0 |
| Mode M9 | |||
|---|---|---|---|
| Quadrant | BADHDUFLAG | Total packets | Discarded packets |
| A | 0 | 4 | 0 |
| B | 0 | 4 | 0 |
| C | 0 | 4 | 0 |
| D | 0 | 4 | 0 |
| Quadrant | Total seconds | Saturated seconds | Saturation percentage |
|---|---|---|---|
| A | 7864 | 136 | 1.729400% |
| B | 7864 | 697 | 8.863174% |
| C | 7864 | 57 | 0.724822% |
| D | 7864 | 632 | 8.036623% |
Noise dominated data is calculated using 1-second bins in cleaned event files. If a bin has >2000 counts, and if more than 50% of those come from <1% of pixels, then it is considered to be noise-dominated and hence unusable.
| Quadrant | # 1 sec bins | Bins with >0 counts | Bins with >2000 counts | High rate bins dominated by noise | Noise dominated (total time) | Noise dominated (detector-on time) | Marked lightcurve |
|---|---|---|---|---|---|---|---|
| A | 8291 | 7868 | 13 | 13 | 0.16% | 0.17% | 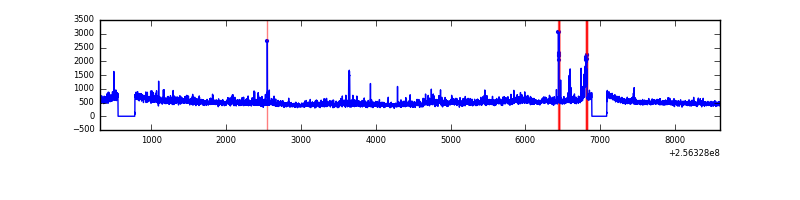 |
| B | 8291 | 7866 | 249 | 249 | 3.00% | 3.17% | 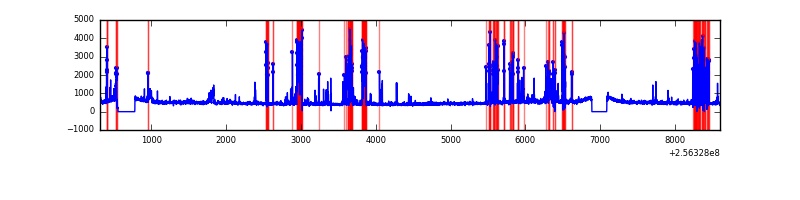 |
| C | 8291 | 7868 | 0 | 0 | 0.00% | 0.00% | 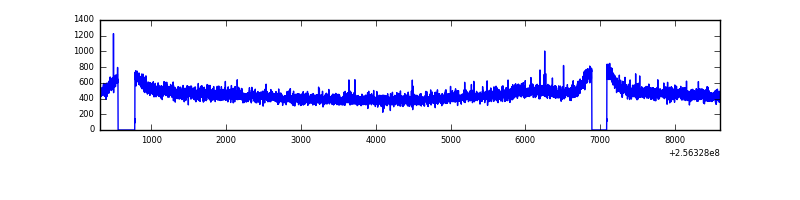 |
| D | 8291 | 7866 | 415 | 415 | 5.01% | 5.28% | 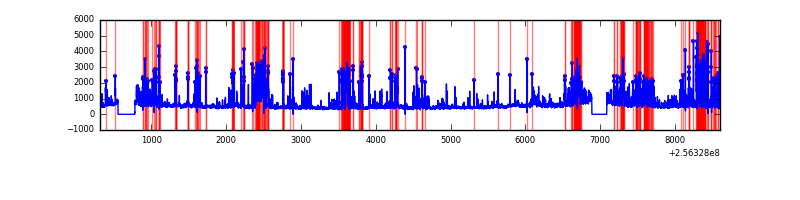 |
Top three noisy pixels from each quadrant. If the there are fewer than three noisy pixels in the level2.evt file, extra rows are filled as -1
| Pixel properties | Quadrant properties | ||||||
|---|---|---|---|---|---|---|---|
| Quadrant | DetID | PixID | Counts | Sigma | Mean | Median | Sigma |
| A | 1 | 162 | 172960 | 908.46 | 930 | 909 | 189.4 |
| A | 1 | 178 | 96295 | 503.66 | 930 | 909 | 189.4 |
| A | 1 | 161 | 81278 | 424.36 | 930 | 909 | 189.4 |
| B | 4 | 239 | 1169981 | 7058.0 | 882 | 859 | 165.6 |
| B | 3 | 209 | 83561 | 499.27 | 882 | 859 | 165.6 |
| B | 3 | 64 | 73195 | 436.69 | 882 | 859 | 165.6 |
| C | 3 | 233 | 8984 | 38.15 | 911 | 914 | 211.5 |
| C | 13 | 61 | 6847 | 28.05 | 911 | 914 | 211.5 |
| C | 8 | 222 | 2333 | 6.71 | 911 | 914 | 211.5 |
| D | 1 | 52 | 2323047 | 10869.27 | 884 | 855 | 213.6 |
| D | 4 | 95 | 63396 | 292.73 | 884 | 855 | 213.6 |
| D | 8 | 195 | 49232 | 226.43 | 884 | 855 | 213.6 |
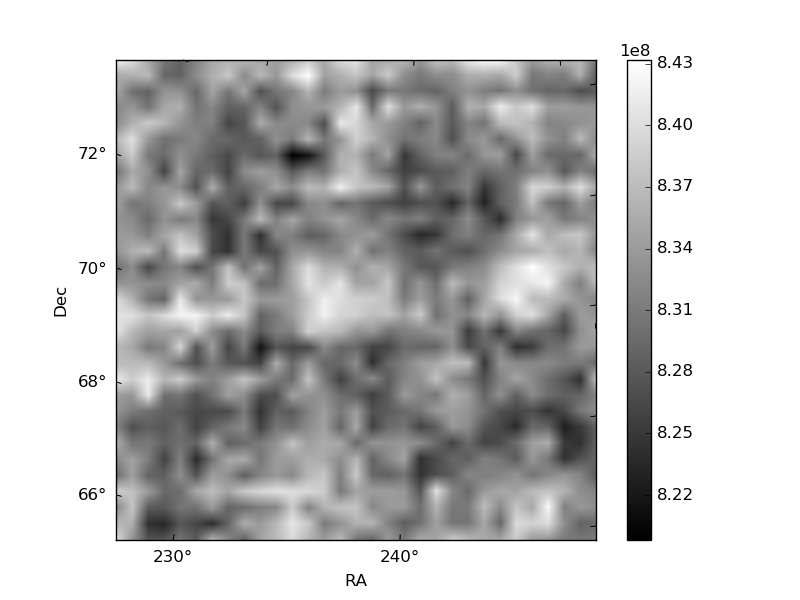
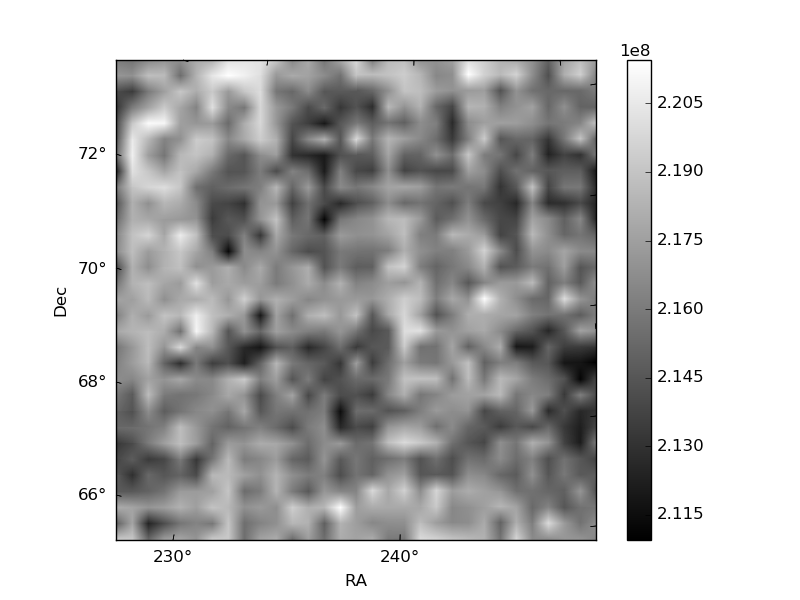
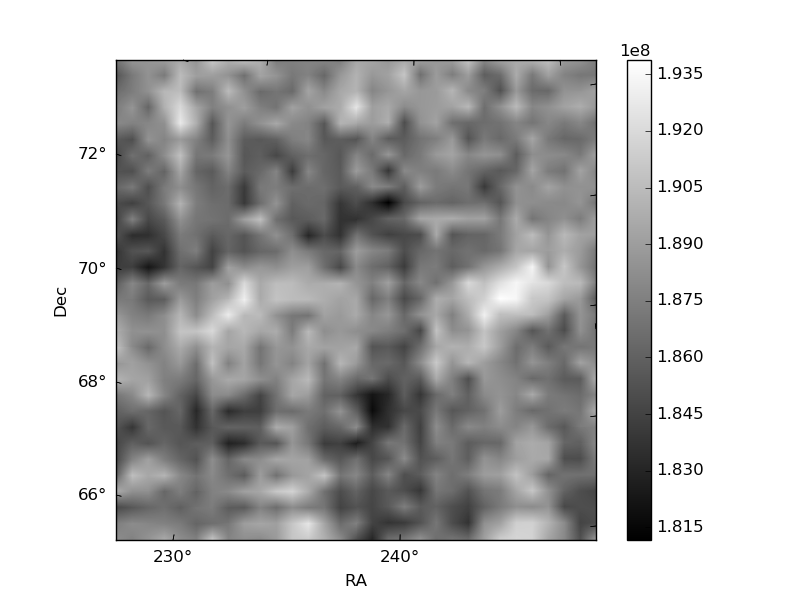
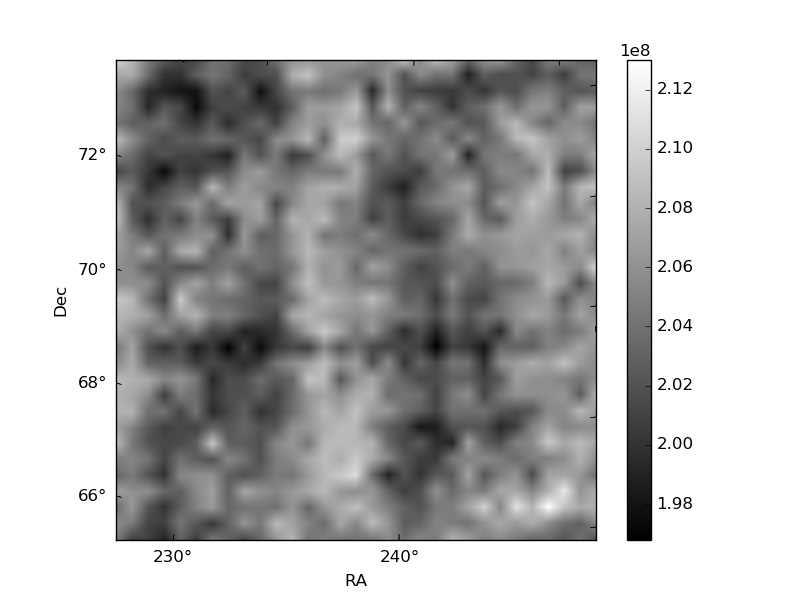
Histogram calculated using DETX and DETY for each event in the final _common_clean file
| Quadrant A | 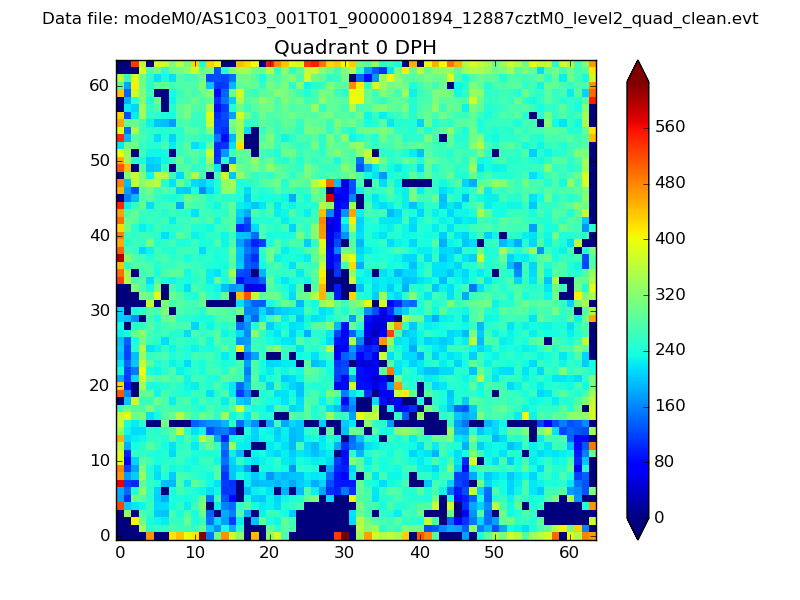 |
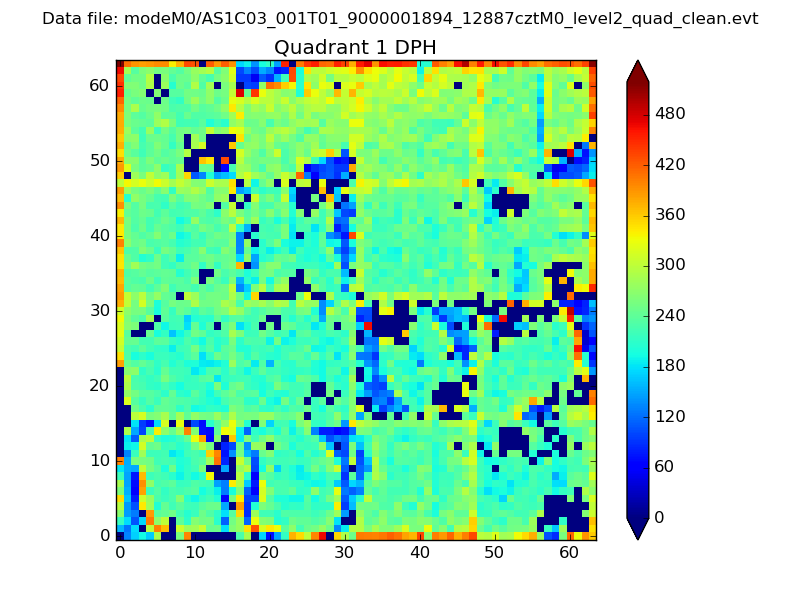 |
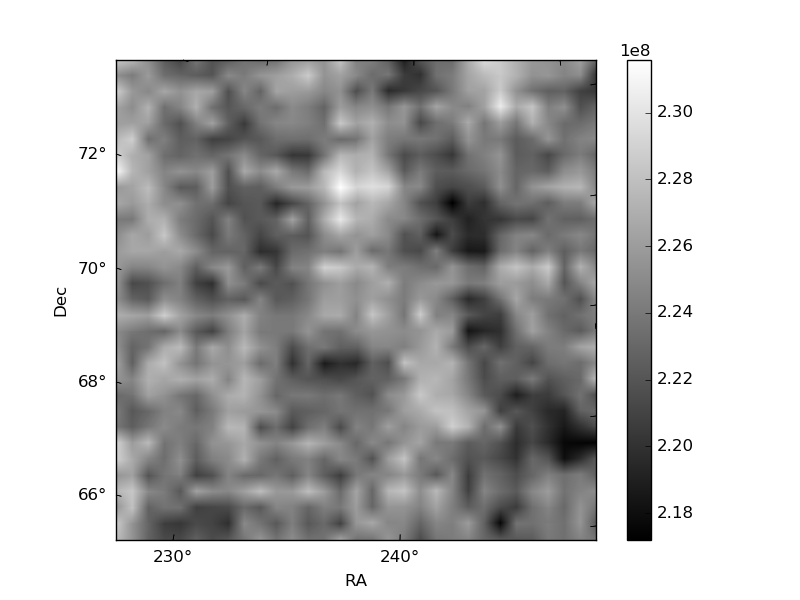
Quadrant B |
|---|---|---|---|
| Quadrant D | 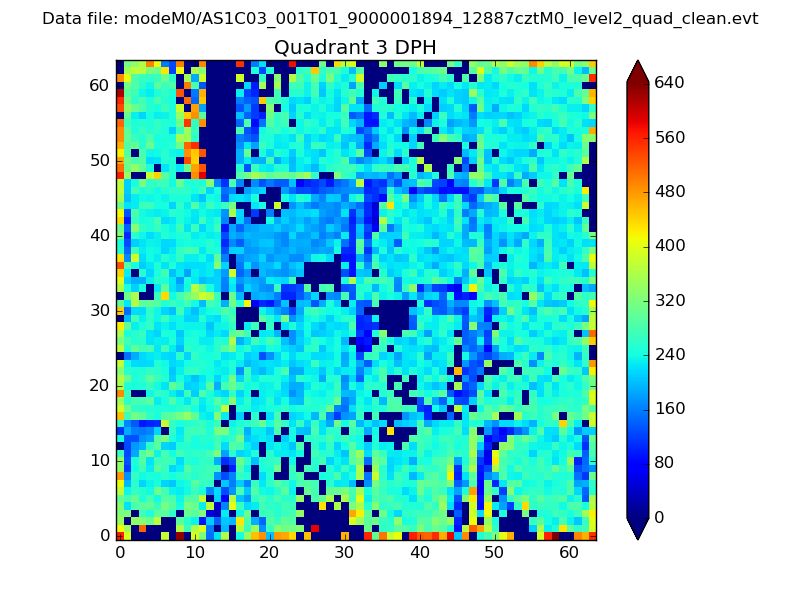 |
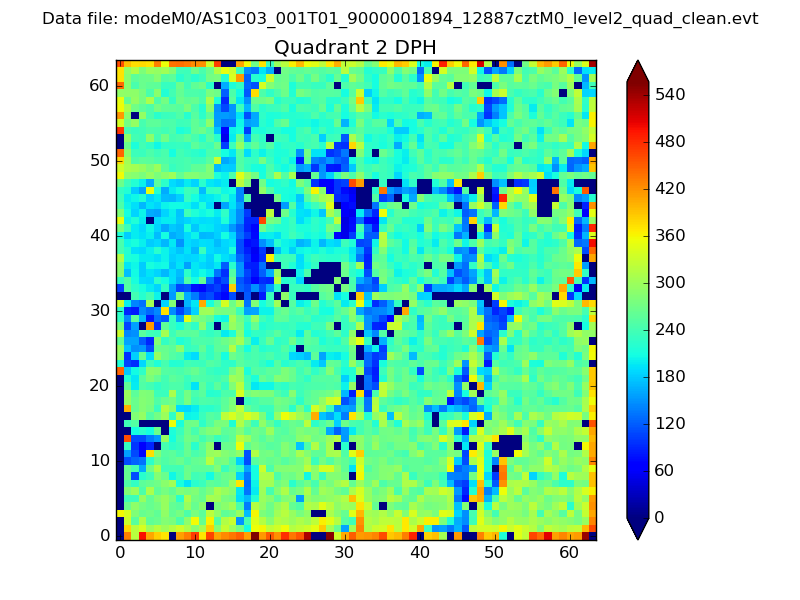 |
Quadrant C |
| Plot type | Count rate plots | Images |
|---|---|---|
| Comparison with Poisson distribution Blue bars denote a histogram of data divided into 1 sec bins. Red curve is a Poisson curve with rate = median count rate of data. |
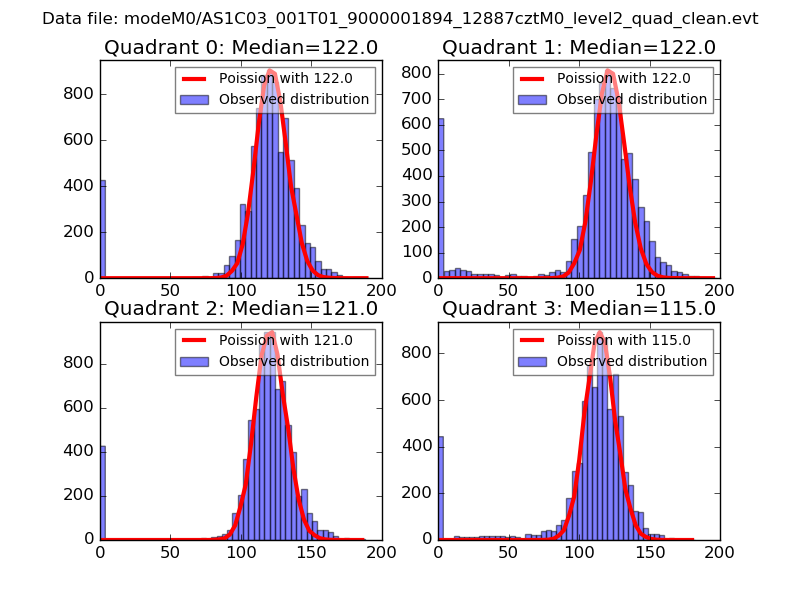 |
 |
| Quadrant-wise count rates Data is divided into 100 sec bins |
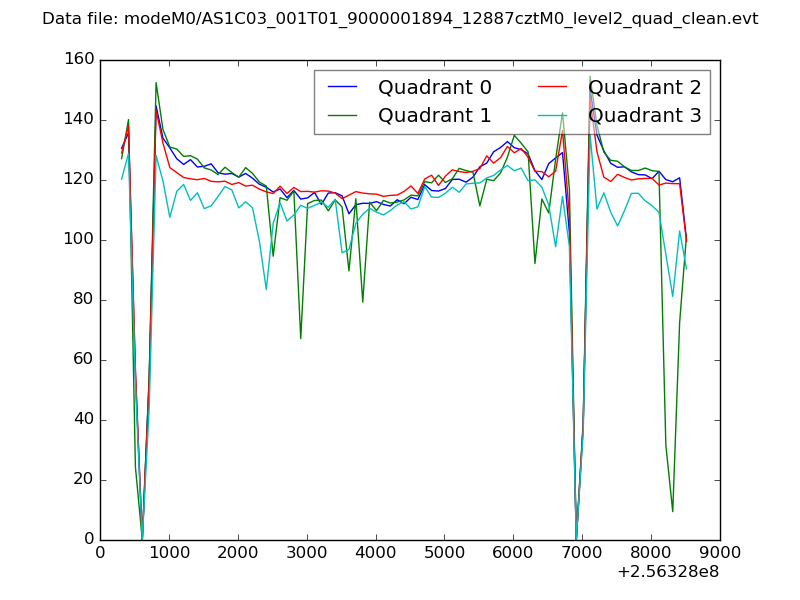 |
|
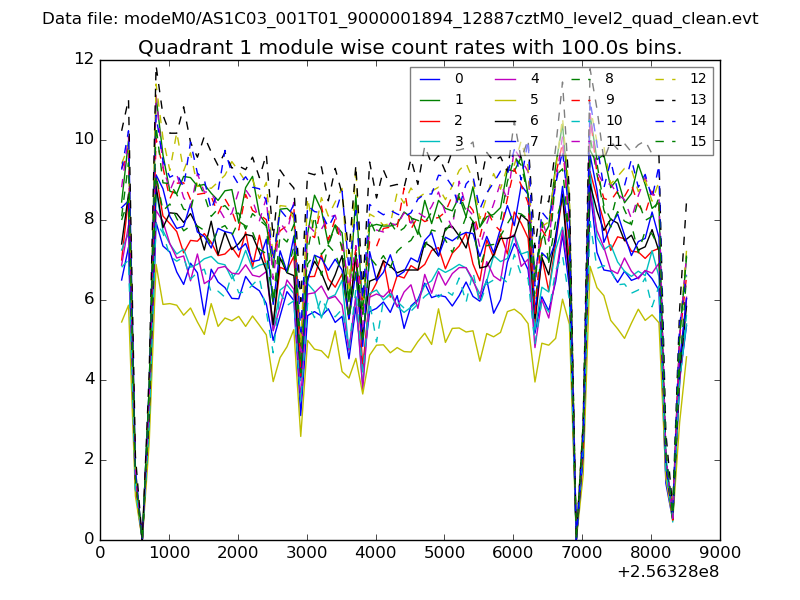
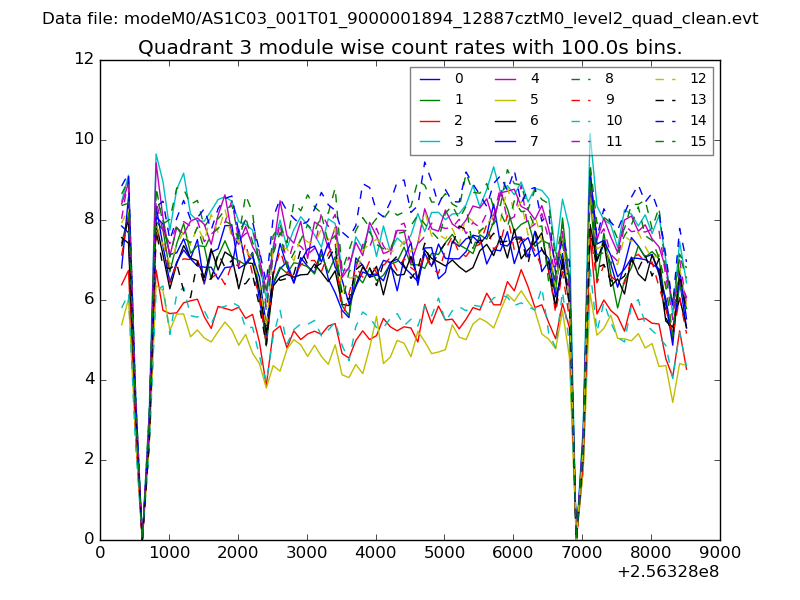
| Module-wise count rates for Quadrant A Data is divided into 100 sec bins |
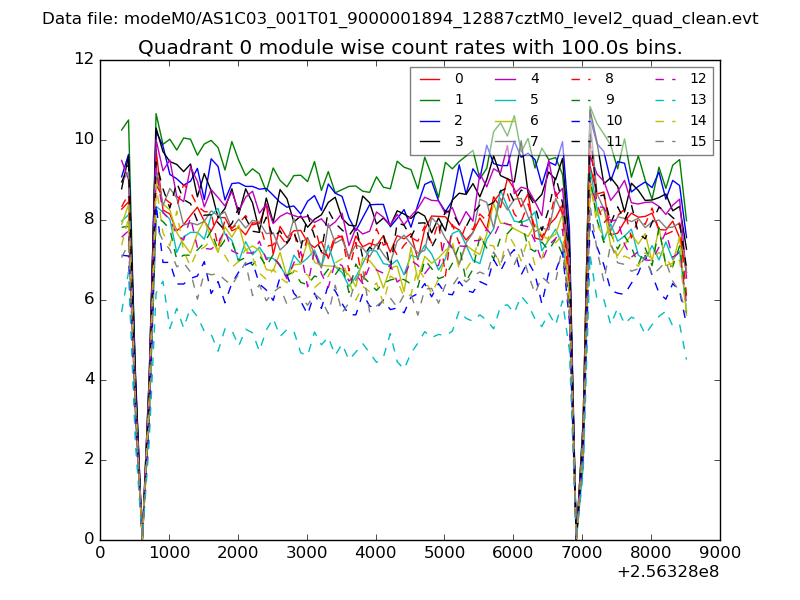 |
 |
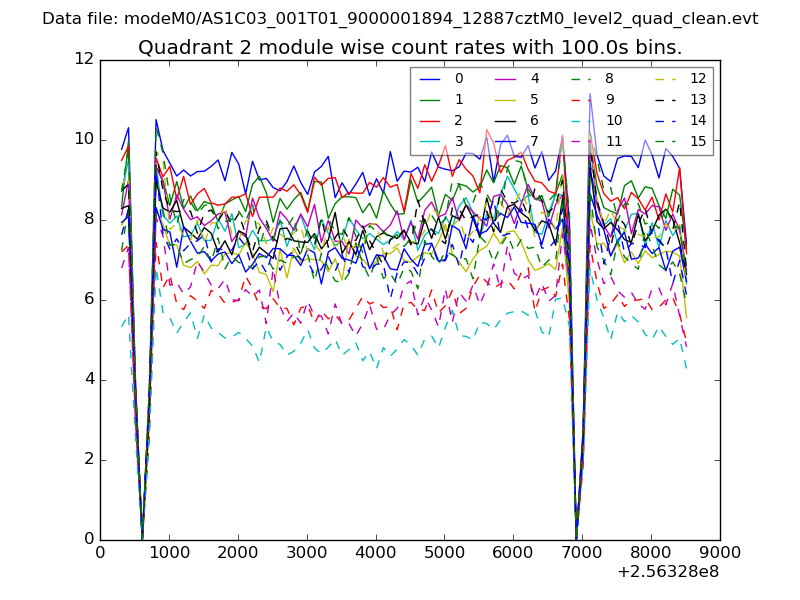
| Module-wise count rates for Quadrant B Data is divided into 100 sec bins |
 |
 |
| Module-wise count rates for Quadrant C Data is divided into 100 sec bins |
 |
 |
| Module-wise count rates for Quadrant D Data is divided into 100 sec bins |
 |
 |
| Parameter | Plot |
|---|---|
| CZT HV Monitor | 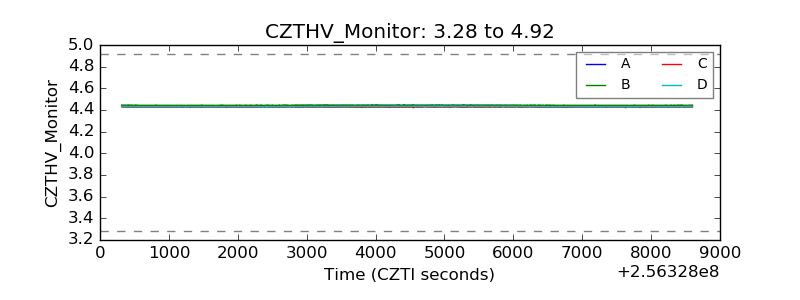 |
| D_VDD | 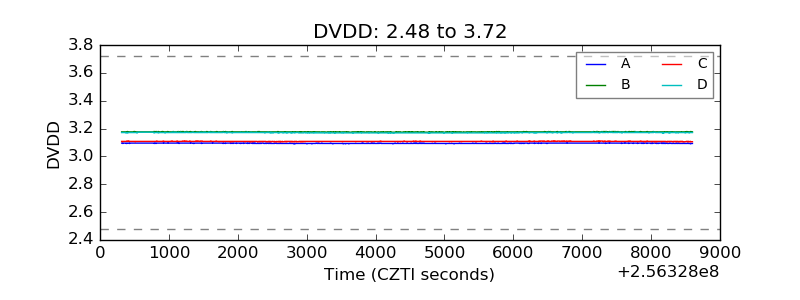 |
| Temperature 1 | 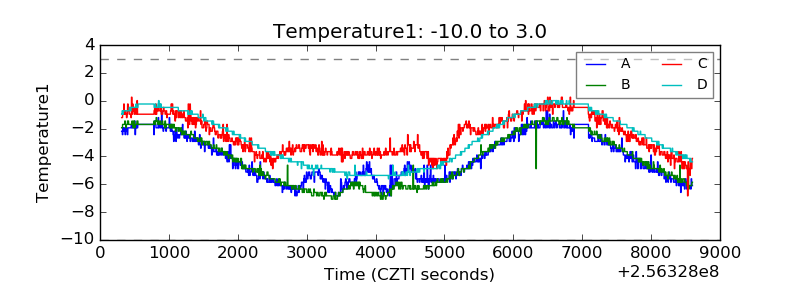 |
| Veto HV Monitor |  |
| Veto LLD | 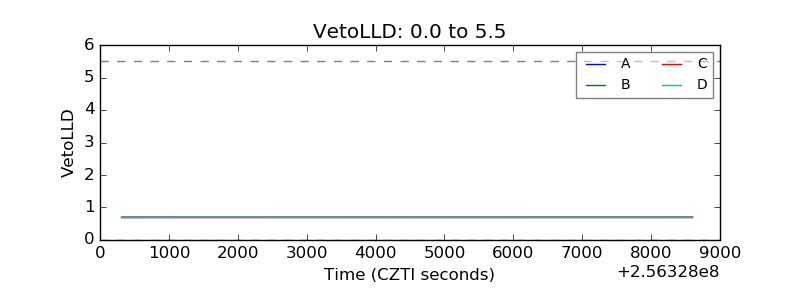 |
| Alpha Counter | 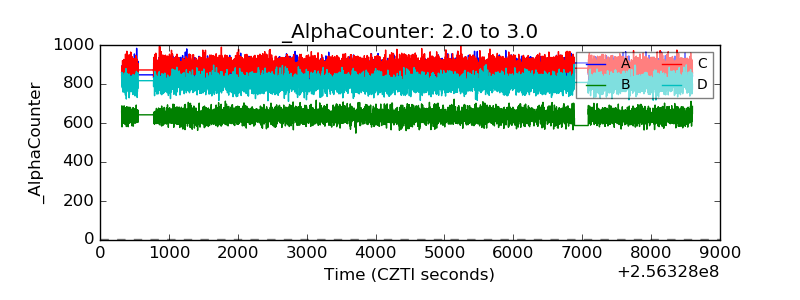 |
| _CPM_Rate | 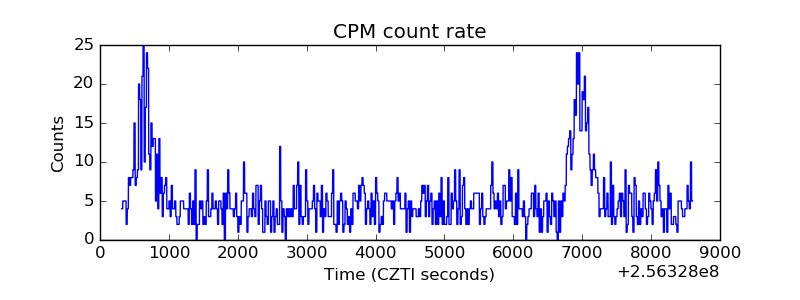 |
| CZT Counter | 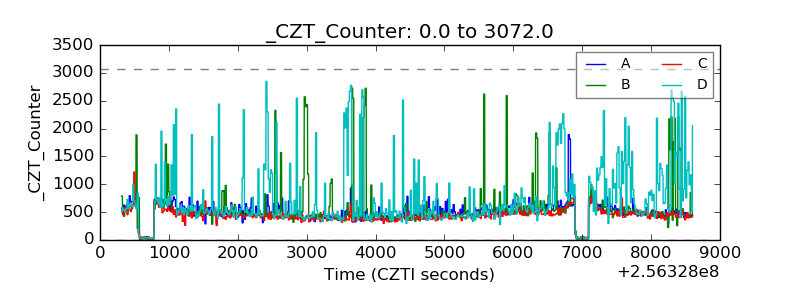 |
| +2.5 Volts monitor |  |
| +5 Volts monitor |  |
| _ROLL_ROT | 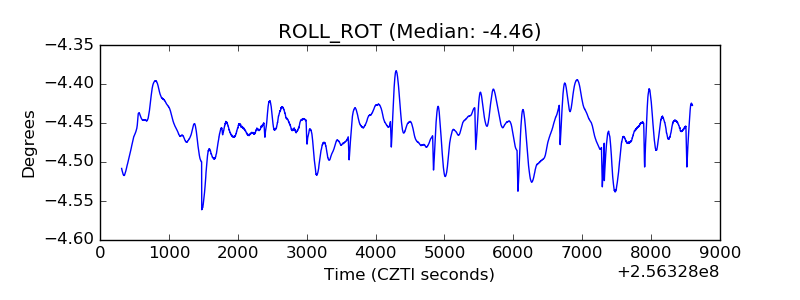 |
| _Roll_DEC | 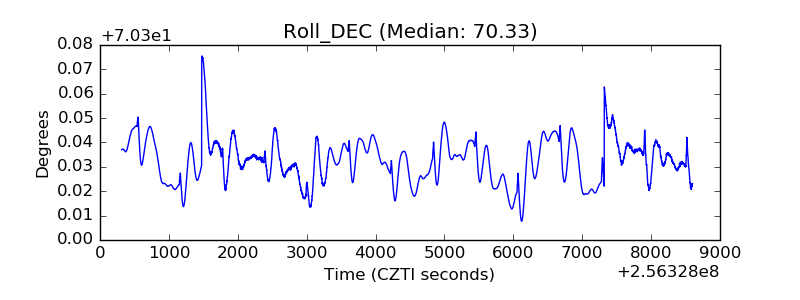 |
| _Roll_RA | 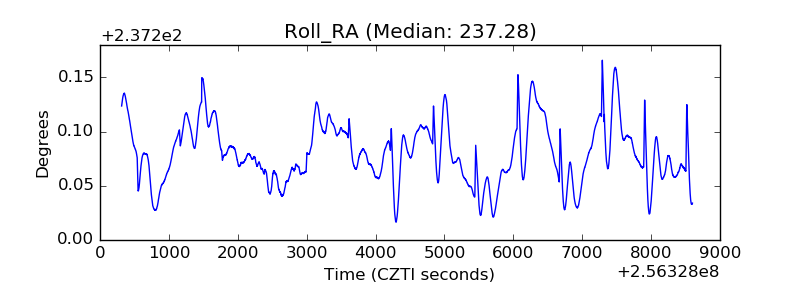 |
| Veto Counter | 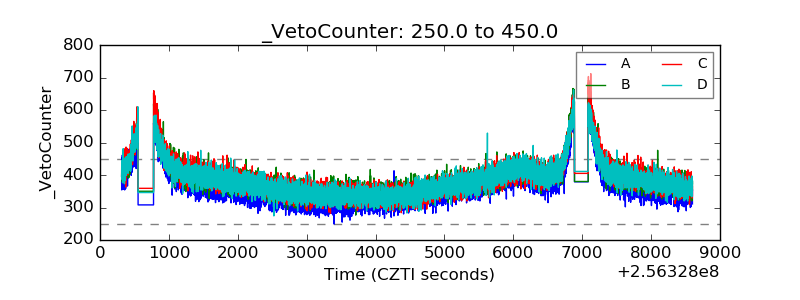 |