| Param | Original file | Final file |
|---|---|---|
| Filename | modeM0/AS1C03_001T01_9000001894_12891cztM0_level2.evt | modeM0/AS1C03_001T01_9000001894_12891cztM0_level2_quad_clean.evt |
| Size (bytes) | 545,463,360 | 120,499,200 |
| Size | 520.2 MB | 114.9 MB |
| Events in quadrant A | 3,383,728 | 822,307 |
| Events in quadrant B | 5,869,125 | 735,942 |
| Events in quadrant C | 2,963,090 | 829,583 |
| Events in quadrant D | 3,840,541 | 786,271 |
| Mode M0 | |||
|---|---|---|---|
| Quadrant | BADHDUFLAG | Total packets | Discarded packets |
| A | 0 | 14567 | 3 |
| B | 0 | 22014 | 2 |
| C | 0 | 13770 | 2 |
| D | 0 | 16305 | 2 |
| Mode SS | |||
|---|---|---|---|
| Quadrant | BADHDUFLAG | Total packets | Discarded packets |
| A | 0 | 140 | 0 |
| B | 0 | 140 | 0 |
| C | 0 | 140 | 0 |
| D | 0 | 140 | 0 |
| Mode M9 | |||
|---|---|---|---|
| Quadrant | BADHDUFLAG | Total packets | Discarded packets |
| A | 0 | 9 | 0 |
| B | 0 | 9 | 0 |
| C | 0 | 9 | 0 |
| D | 0 | 10 | 0 |
| Quadrant | Total seconds | Saturated seconds | Saturation percentage |
|---|---|---|---|
| A | 6809 | 68 | 0.998678% |
| B | 6809 | 1232 | 18.093700% |
| C | 6809 | 6 | 0.088119% |
| D | 6809 | 148 | 2.173594% |
Noise dominated data is calculated using 1-second bins in cleaned event files. If a bin has >2000 counts, and if more than 50% of those come from <1% of pixels, then it is considered to be noise-dominated and hence unusable.
| Quadrant | # 1 sec bins | Bins with >0 counts | Bins with >2000 counts | High rate bins dominated by noise | Noise dominated (total time) | Noise dominated (detector-on time) | Marked lightcurve |
|---|---|---|---|---|---|---|---|
| A | 7780 | 6811 | 36 | 36 | 0.46% | 0.53% | 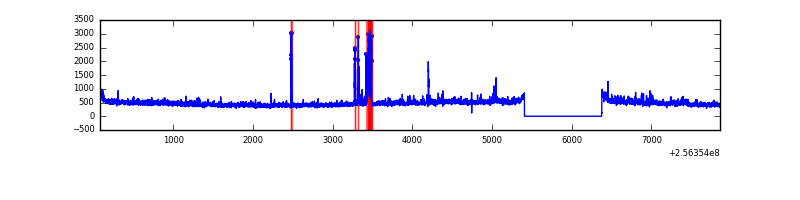 |
| B | 7780 | 6810 | 748 | 748 | 9.61% | 10.98% | 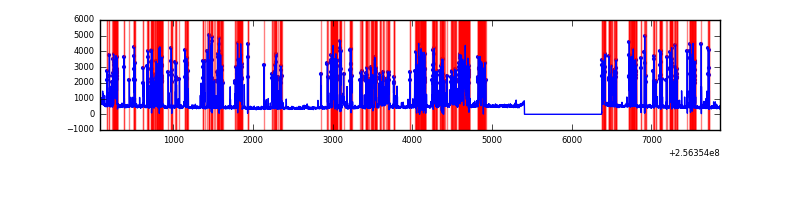 |
| C | 7780 | 6811 | 1 | 1 | 0.01% | 0.01% | 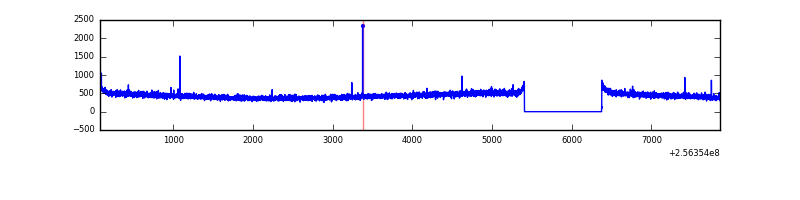 |
| D | 7780 | 6811 | 120 | 120 | 1.54% | 1.76% | 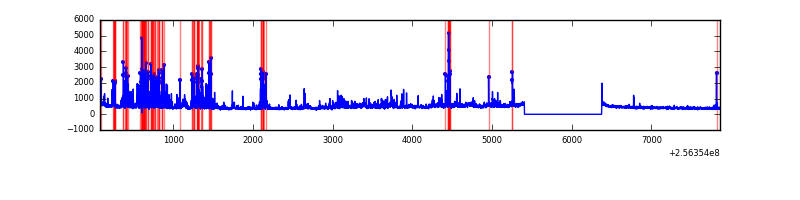 |
Top three noisy pixels from each quadrant. If the there are fewer than three noisy pixels in the level2.evt file, extra rows are filled as -1
| Pixel properties | Quadrant properties | ||||||
|---|---|---|---|---|---|---|---|
| Quadrant | DetID | PixID | Counts | Sigma | Mean | Median | Sigma |
| A | 15 | 174 | 159869 | 1015.72 | 776 | 758 | 156.6 |
| A | 1 | 162 | 99055 | 627.5 | 776 | 758 | 156.6 |
| A | 1 | 178 | 51050 | 321.05 | 776 | 758 | 156.6 |
| B | 4 | 239 | 2890382 | 21847.39 | 696 | 677 | 132.3 |
| B | 4 | 173 | 101442 | 761.83 | 696 | 677 | 132.3 |
| B | 0 | 214 | 37237 | 276.41 | 696 | 677 | 132.3 |
| C | 13 | 61 | 5494 | 26.88 | 758 | 762 | 176.1 |
| C | 14 | 234 | 4932 | 23.68 | 758 | 762 | 176.1 |
| C | 4 | 112 | 1973 | 6.88 | 758 | 762 | 176.1 |
| D | 1 | 52 | 835655 | 4663.31 | 743 | 721 | 179.0 |
| D | 4 | 95 | 70888 | 391.9 | 743 | 721 | 179.0 |
| D | 14 | 35 | 48169 | 265.01 | 743 | 721 | 179.0 |
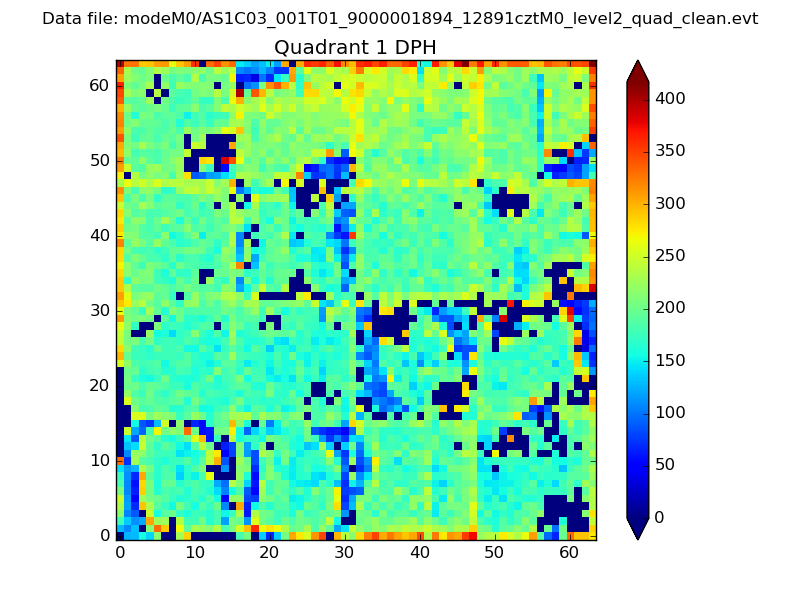
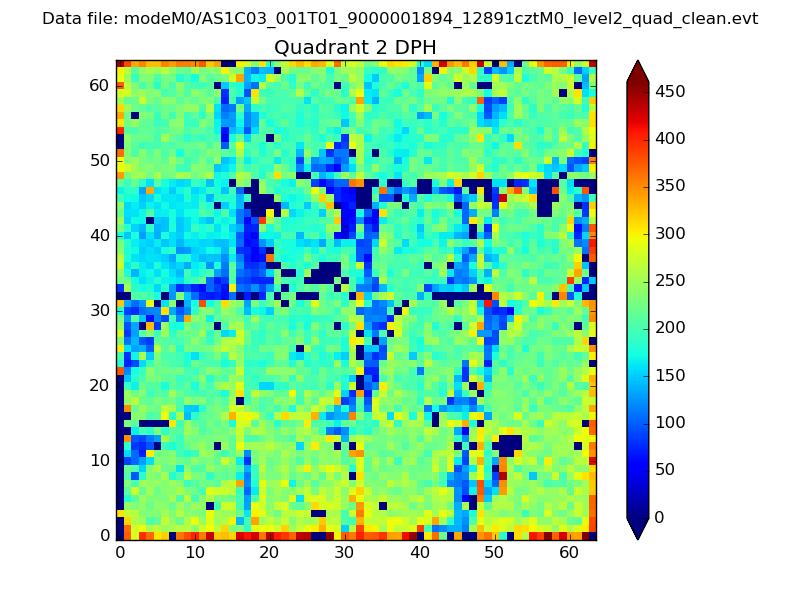
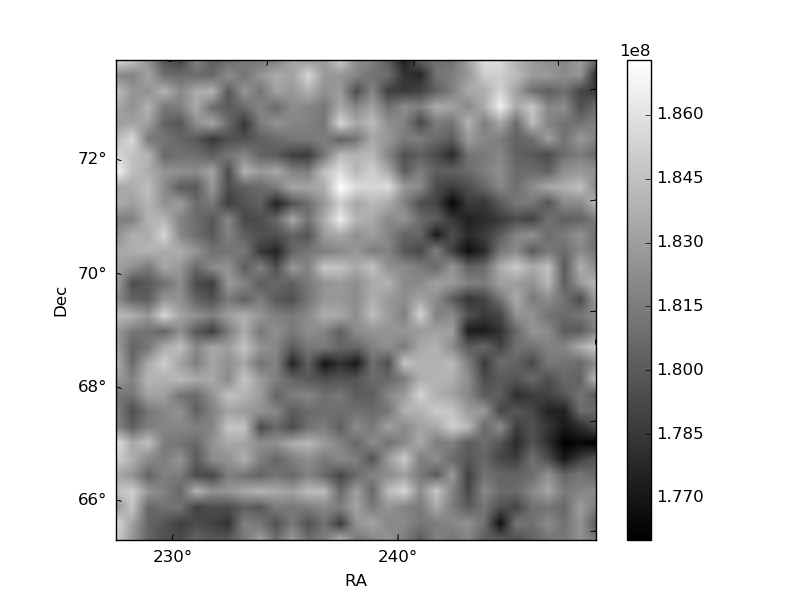
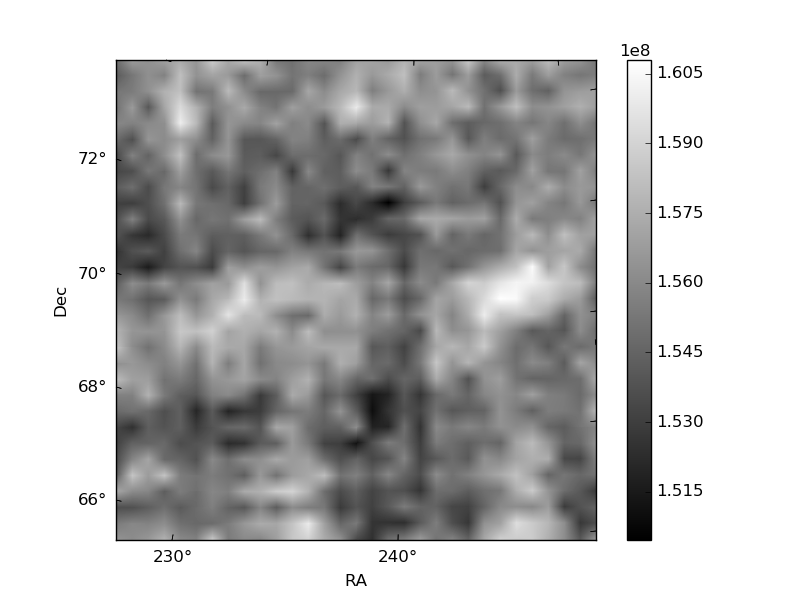
Histogram calculated using DETX and DETY for each event in the final _common_clean file
| Quadrant A |  |
 |
Quadrant B |
|---|---|---|---|
| Quadrant D |  |
 |
Quadrant C |
| Plot type | Count rate plots | Images |
|---|---|---|
| Comparison with Poisson distribution Blue bars denote a histogram of data divided into 1 sec bins. Red curve is a Poisson curve with rate = median count rate of data. |
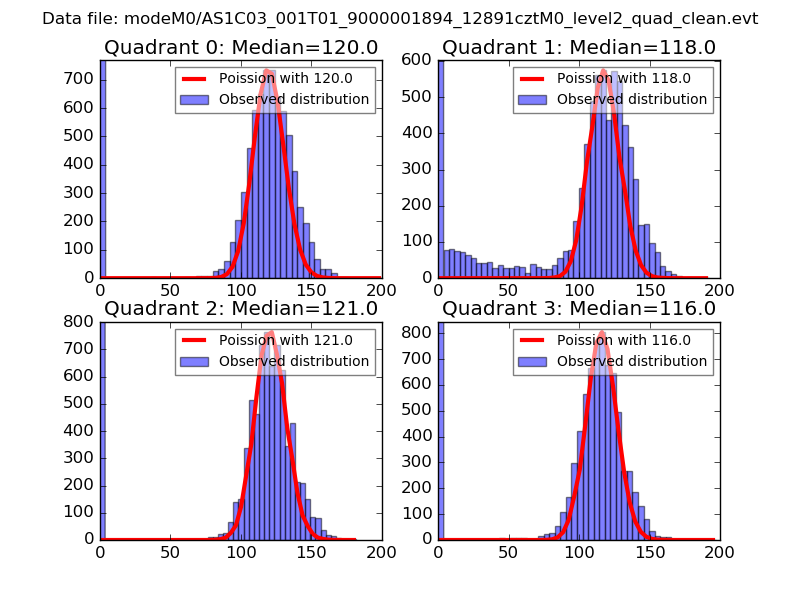 |
 |
| Quadrant-wise count rates Data is divided into 100 sec bins |
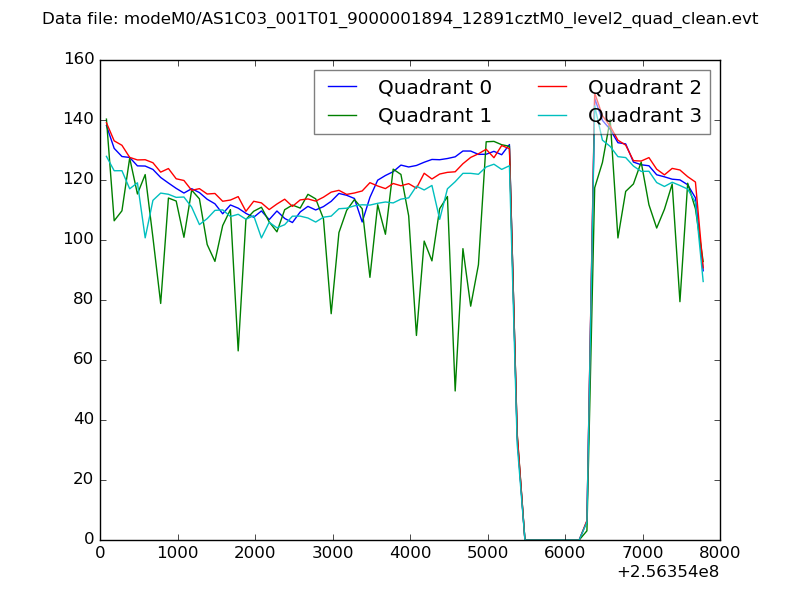 |
|
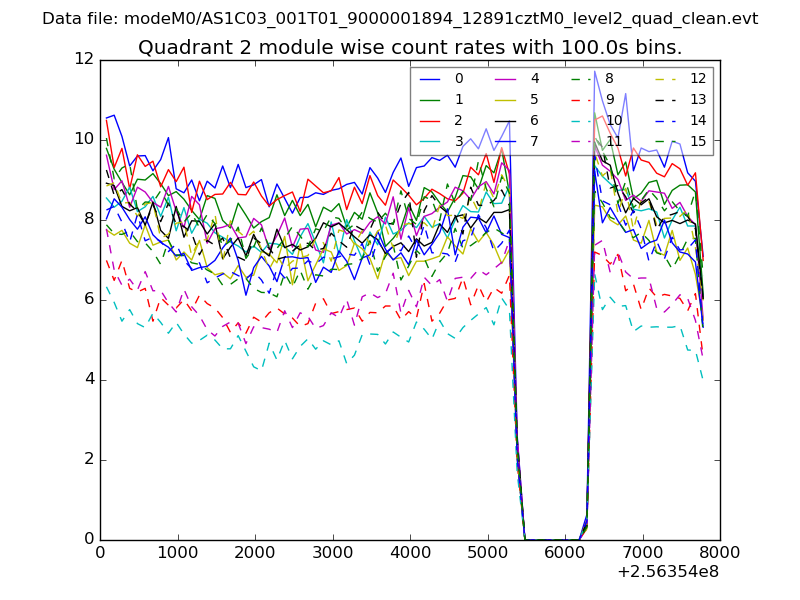
| Module-wise count rates for Quadrant A Data is divided into 100 sec bins |
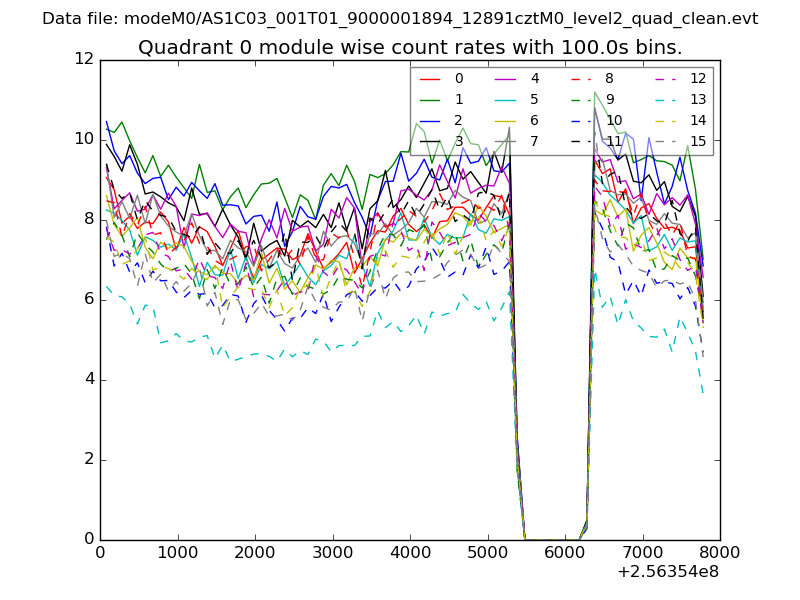 |
 |
| Module-wise count rates for Quadrant B Data is divided into 100 sec bins |
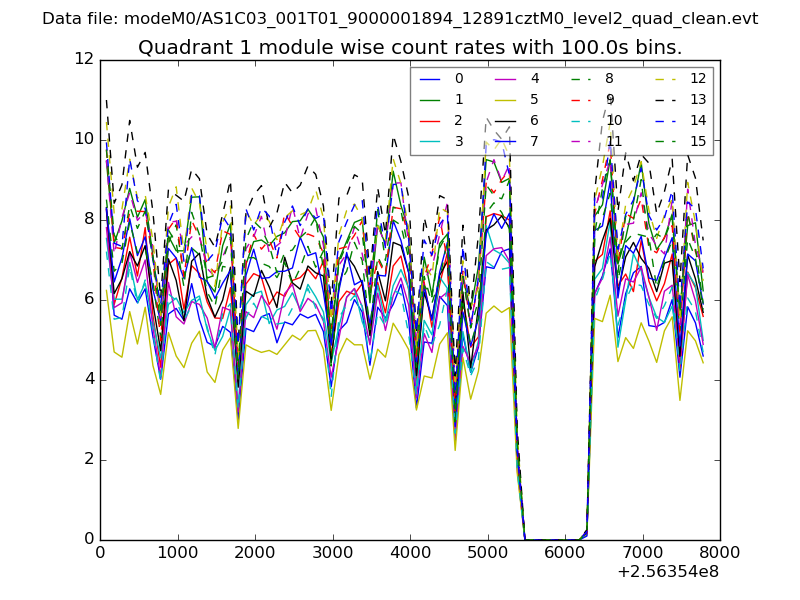 |
 |
| Module-wise count rates for Quadrant C Data is divided into 100 sec bins |
 |
 |
| Module-wise count rates for Quadrant D Data is divided into 100 sec bins |
 |
 |
| Parameter | Plot |
|---|---|
| CZT HV Monitor | 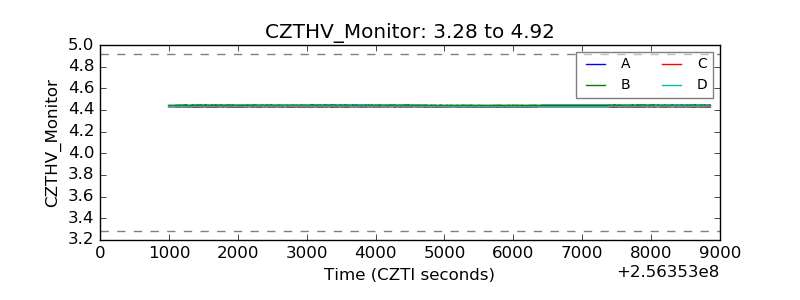 |
| D_VDD | 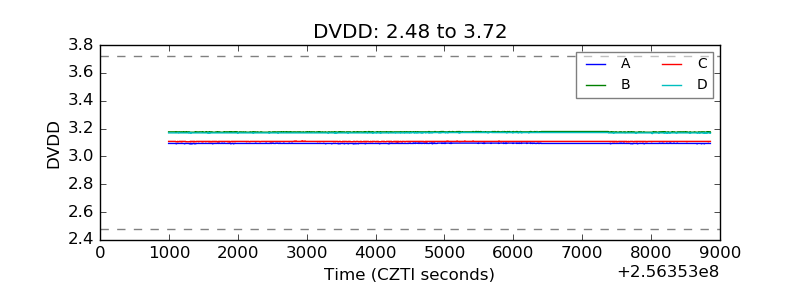 |
| Temperature 1 | 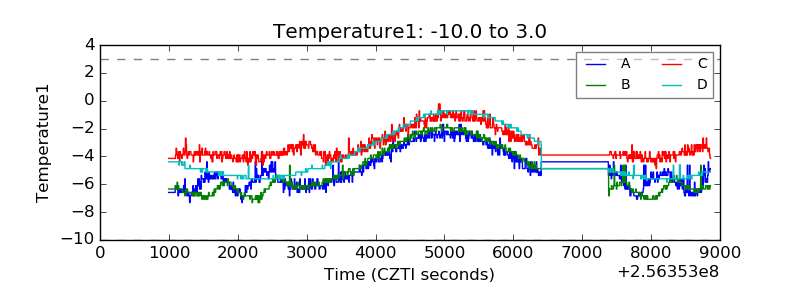 |
| Veto HV Monitor | 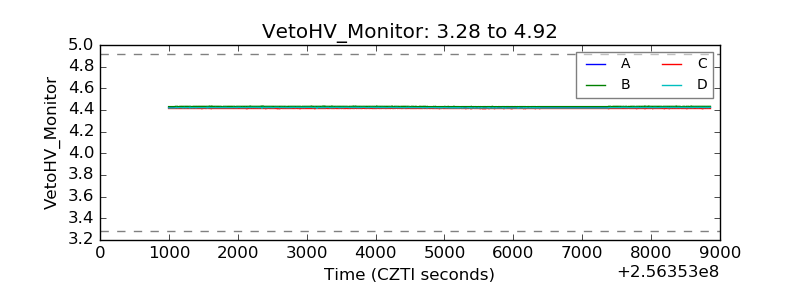 |
| Veto LLD | 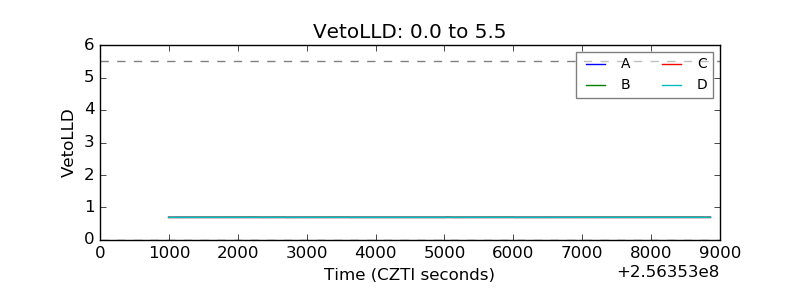 |
| Alpha Counter | 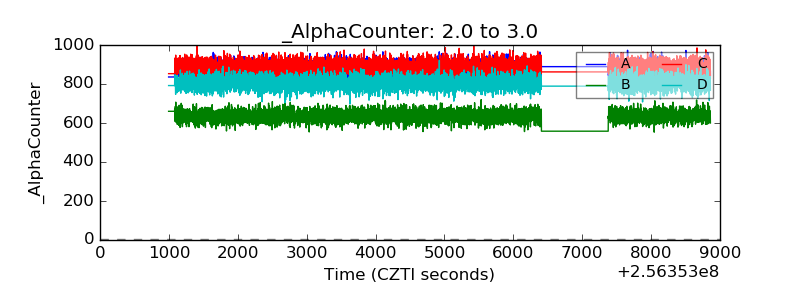 |
| _CPM_Rate | 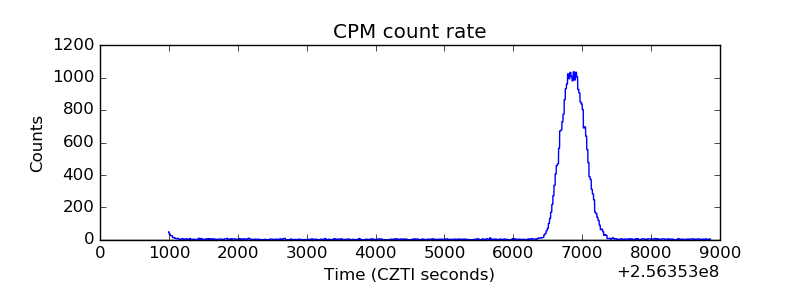 |
| CZT Counter | 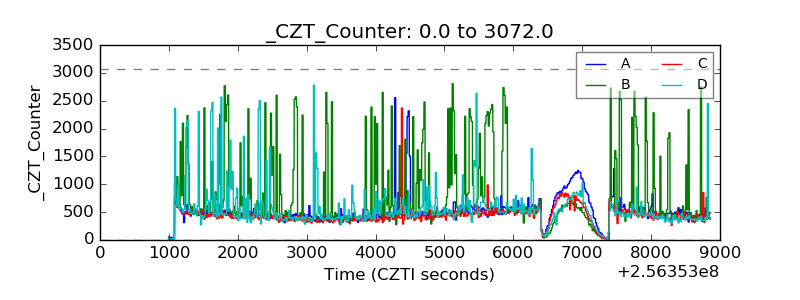 |
| +2.5 Volts monitor | 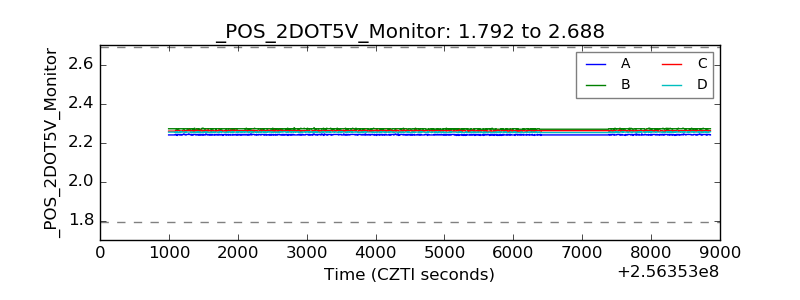 |
| +5 Volts monitor | 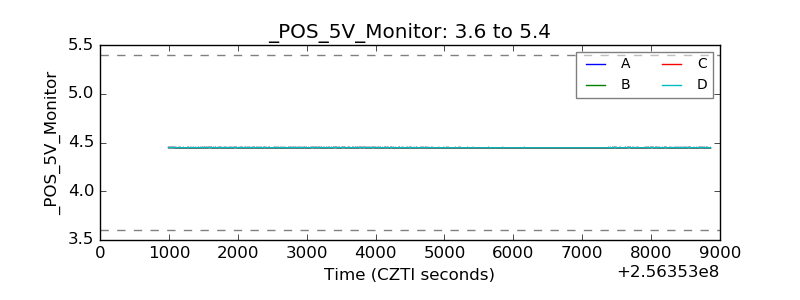 |
| _ROLL_ROT | 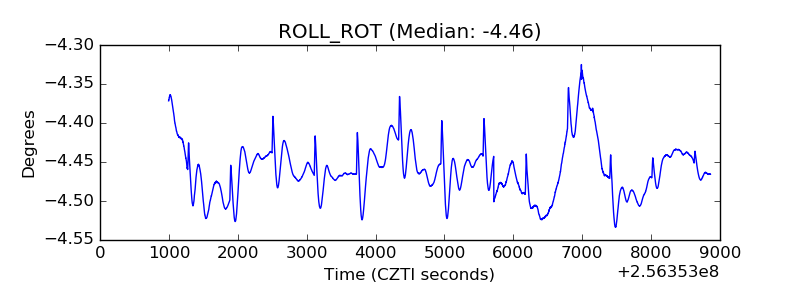 |
| _Roll_DEC | 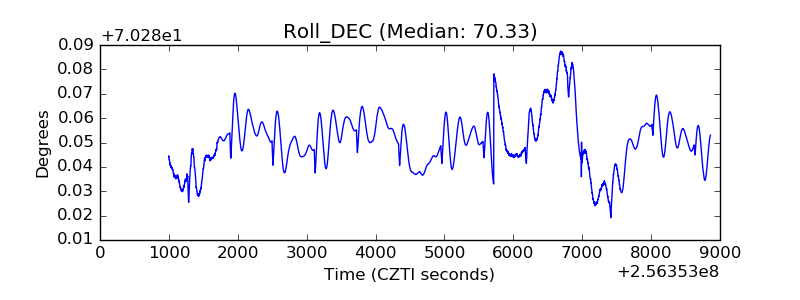 |
| _Roll_RA | 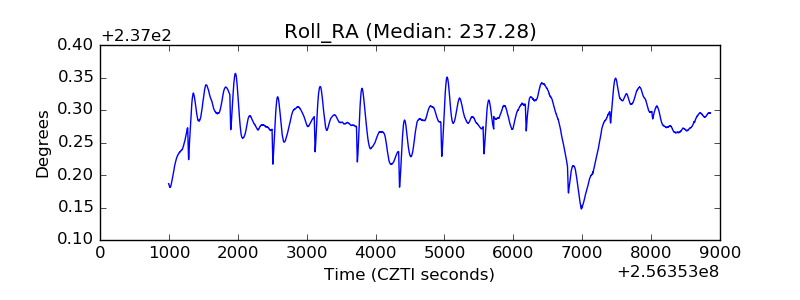 |
| Veto Counter | 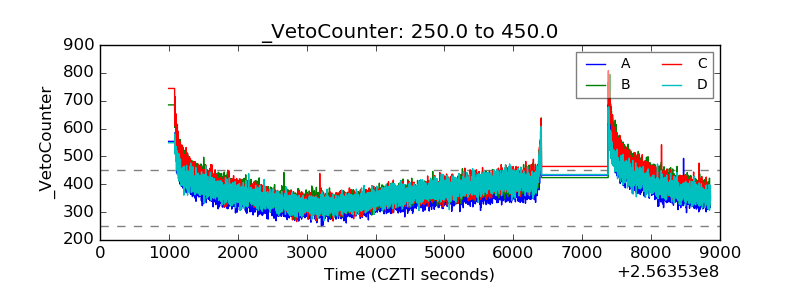 |