| Param | Original file | Final file |
|---|---|---|
| Filename | modeM0/AS1C03_001T01_9000001894_12894cztM0_level2.evt | modeM0/AS1C03_001T01_9000001894_12894cztM0_level2_quad_clean.evt |
| Size (bytes) | 408,219,840 | 100,704,960 |
| Size | 389.3 MB | 96.0 MB |
| Events in quadrant A | 2,626,393 | 687,255 |
| Events in quadrant B | 4,495,666 | 632,430 |
| Events in quadrant C | 2,429,481 | 684,283 |
| Events in quadrant D | 2,436,050 | 659,996 |
| Mode M0 | |||
|---|---|---|---|
| Quadrant | BADHDUFLAG | Total packets | Discarded packets |
| A | 0 | 11451 | 2 |
| B | 0 | 17016 | 2 |
| C | 0 | 11206 | 2 |
| D | 0 | 11360 | 2 |
| Mode SS | |||
|---|---|---|---|
| Quadrant | BADHDUFLAG | Total packets | Discarded packets |
| A | 0 | 112 | 0 |
| B | 0 | 112 | 0 |
| C | 0 | 112 | 0 |
| D | 0 | 112 | 0 |
| Mode M9 | |||
|---|---|---|---|
| Quadrant | BADHDUFLAG | Total packets | Discarded packets |
| A | 0 | 15 | 0 |
| B | 0 | 15 | 0 |
| C | 0 | 15 | 0 |
| D | 0 | 16 | 0 |
| Quadrant | Total seconds | Saturated seconds | Saturation percentage |
|---|---|---|---|
| A | 5513 | 24 | 0.435335% |
| B | 5513 | 827 | 15.000907% |
| C | 5513 | 7 | 0.126973% |
| D | 5513 | 15 | 0.272084% |
Noise dominated data is calculated using 1-second bins in cleaned event files. If a bin has >2000 counts, and if more than 50% of those come from <1% of pixels, then it is considered to be noise-dominated and hence unusable.
| Quadrant | # 1 sec bins | Bins with >0 counts | Bins with >2000 counts | High rate bins dominated by noise | Noise dominated (total time) | Noise dominated (detector-on time) | Marked lightcurve |
|---|---|---|---|---|---|---|---|
| A | 6614 | 5515 | 0 | 0 | 0.00% | 0.00% | 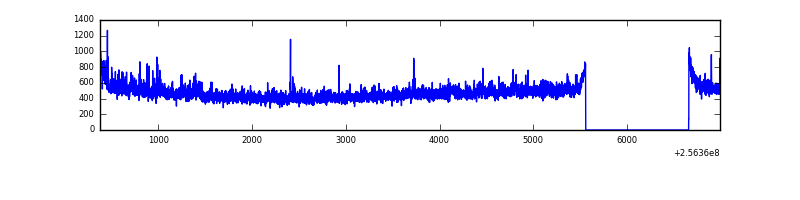 |
| B | 6614 | 5515 | 500 | 500 | 7.56% | 9.07% | 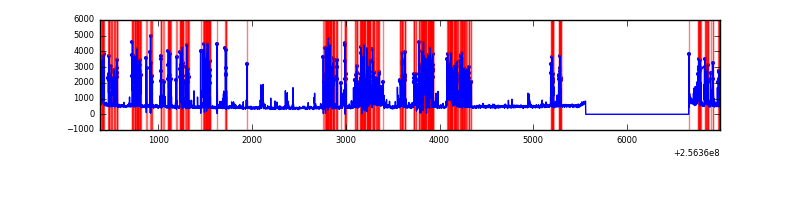 |
| C | 6614 | 5515 | 0 | 0 | 0.00% | 0.00% |  |
| D | 6614 | 5515 | 5 | 5 | 0.08% | 0.09% | 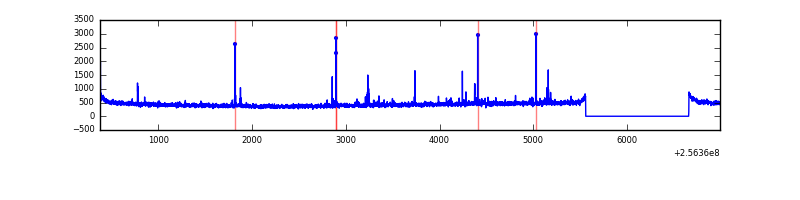 |
Top three noisy pixels from each quadrant. If the there are fewer than three noisy pixels in the level2.evt file, extra rows are filled as -1
| Pixel properties | Quadrant properties | ||||||
|---|---|---|---|---|---|---|---|
| Quadrant | DetID | PixID | Counts | Sigma | Mean | Median | Sigma |
| A | 1 | 162 | 59012 | 445.97 | 643 | 629 | 130.9 |
| A | 1 | 178 | 29191 | 218.17 | 643 | 629 | 130.9 |
| A | 1 | 161 | 24818 | 184.77 | 643 | 629 | 130.9 |
| B | 4 | 239 | 1795775 | 16055.37 | 590 | 575 | 111.8 |
| B | 0 | 85 | 142169 | 1266.35 | 590 | 575 | 111.8 |
| B | 3 | 64 | 127176 | 1132.26 | 590 | 575 | 111.8 |
| C | 13 | 61 | 4483 | 26.76 | 622 | 624 | 144.2 |
| C | 4 | 112 | 2350 | 11.97 | 622 | 624 | 144.2 |
| C | 3 | 202 | 1558 | 6.48 | 622 | 624 | 144.2 |
| D | 1 | 52 | 32630 | 216.38 | 617 | 597 | 148.0 |
| D | 2 | 234 | 19798 | 129.7 | 617 | 597 | 148.0 |
| D | 10 | 253 | 18200 | 118.91 | 617 | 597 | 148.0 |
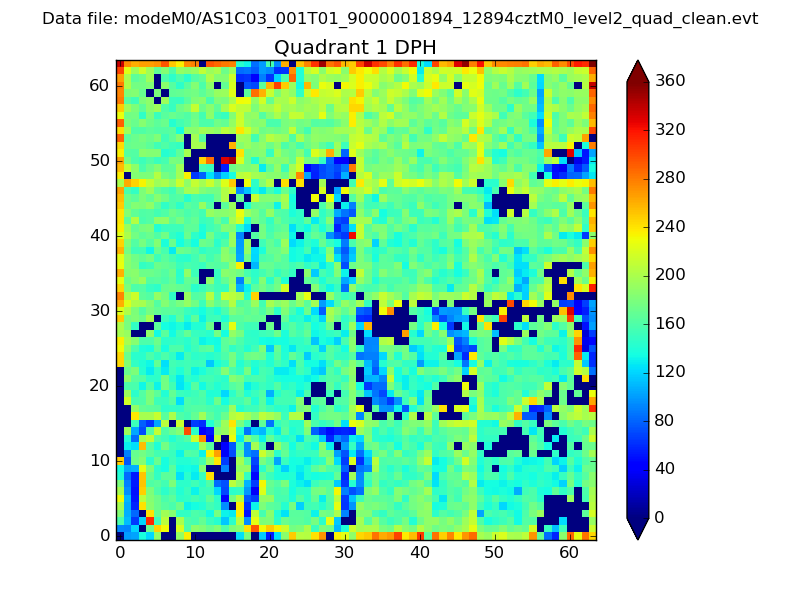
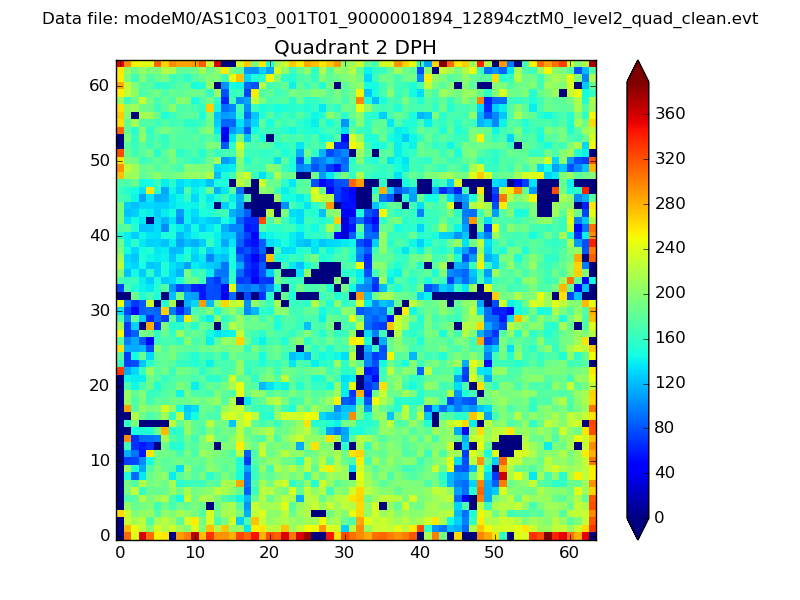
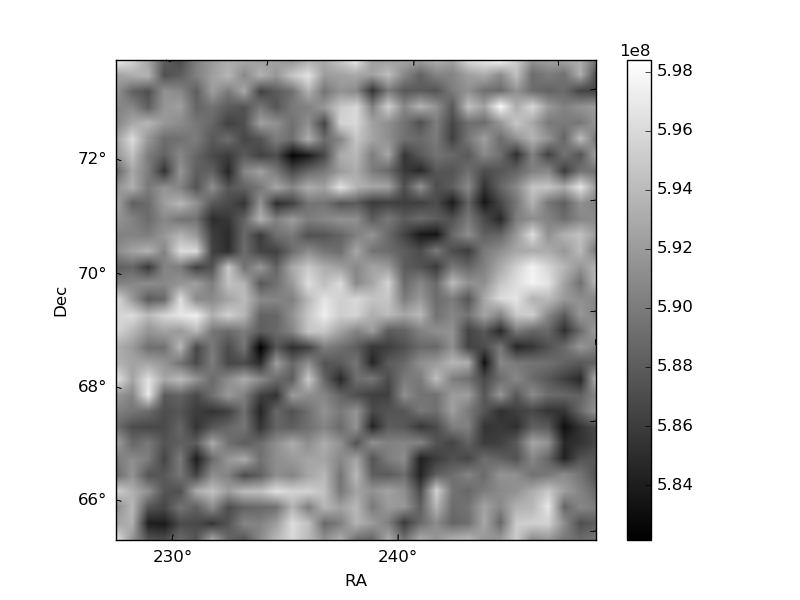
Histogram calculated using DETX and DETY for each event in the final _common_clean file
| Quadrant A | 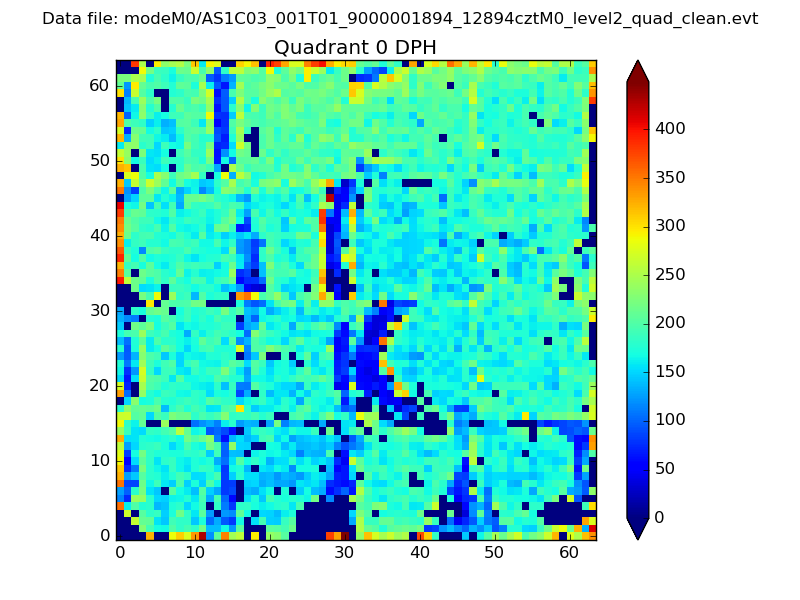 |
 |
Quadrant B |
|---|---|---|---|
| Quadrant D | 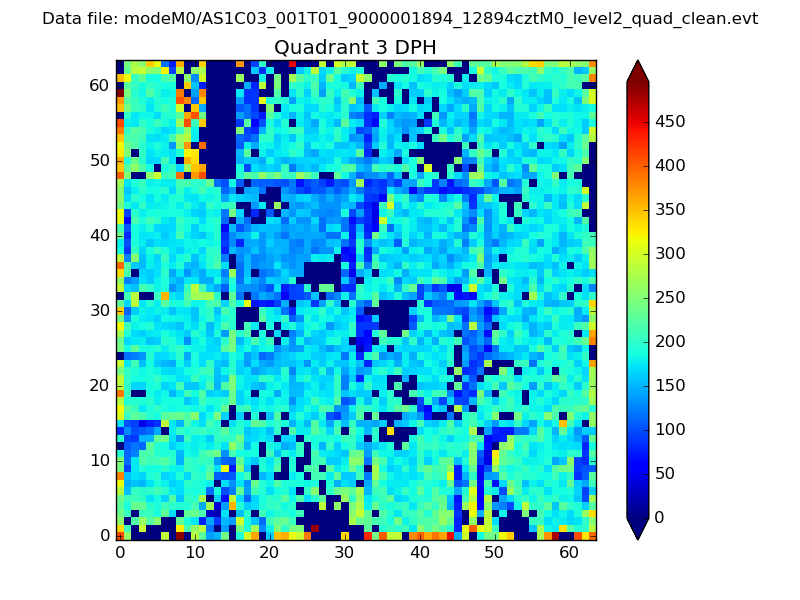 |
 |
Quadrant C |
| Plot type | Count rate plots | Images |
|---|---|---|
| Comparison with Poisson distribution Blue bars denote a histogram of data divided into 1 sec bins. Red curve is a Poisson curve with rate = median count rate of data. |
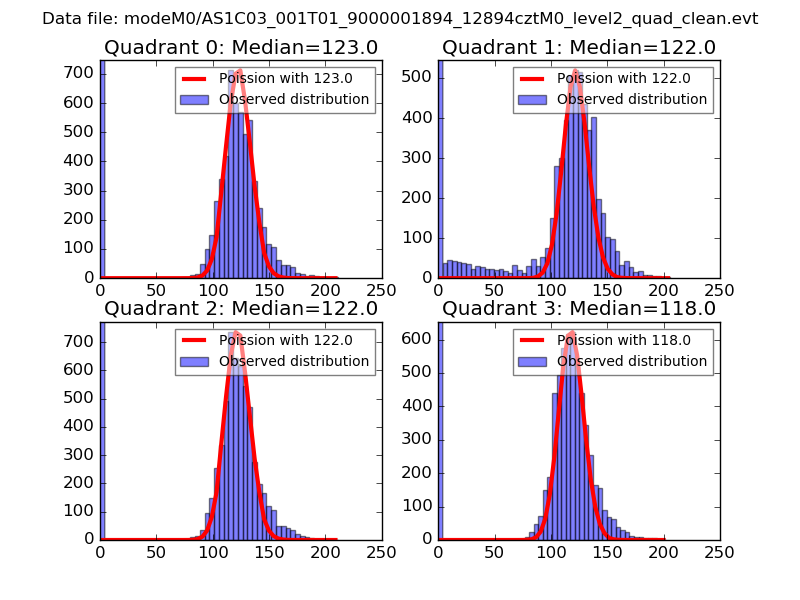 |
 |
| Quadrant-wise count rates Data is divided into 100 sec bins |
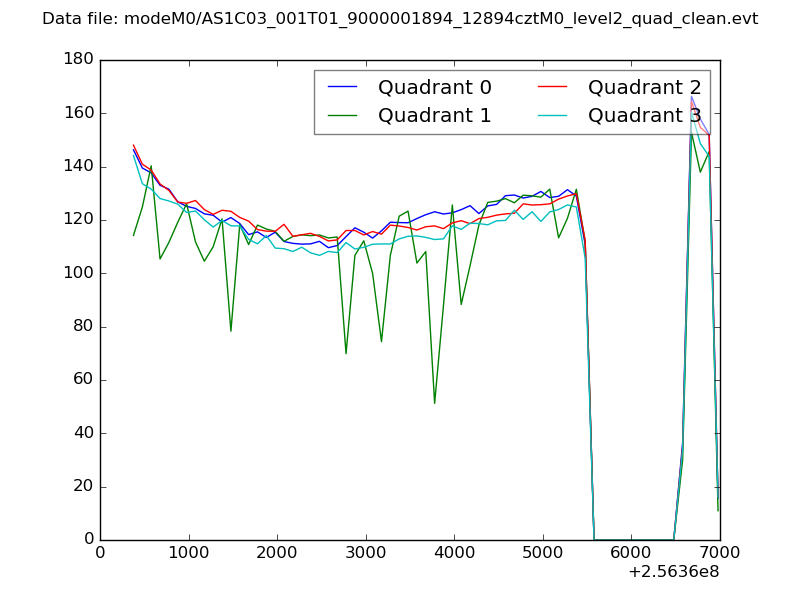 |
|
| Module-wise count rates for Quadrant A Data is divided into 100 sec bins |
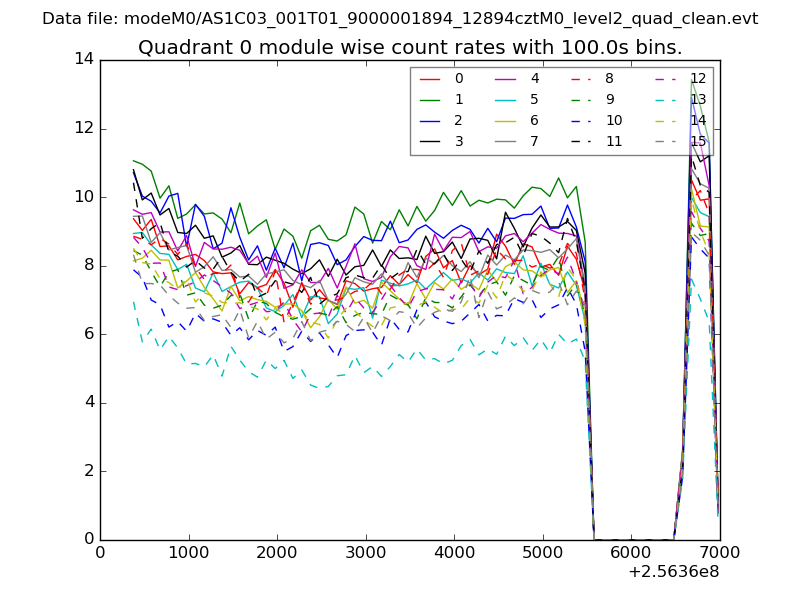 |
 |
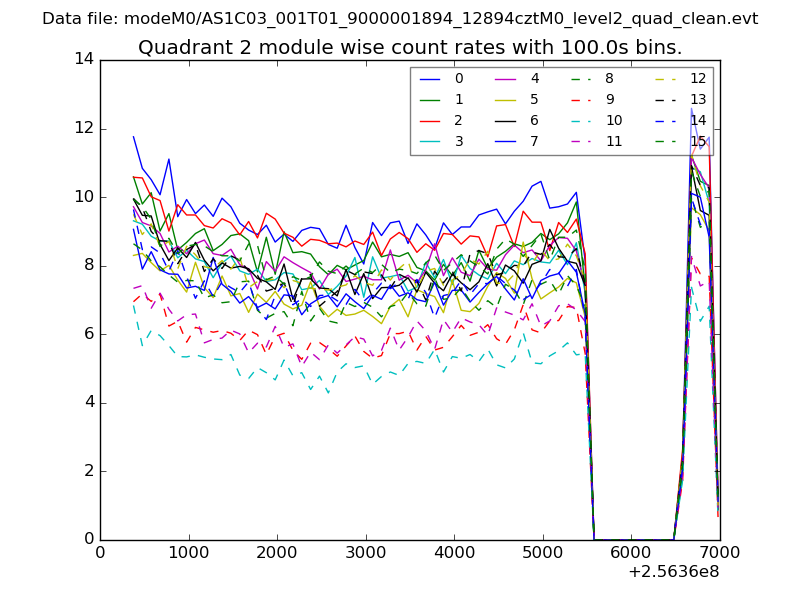
| Module-wise count rates for Quadrant B Data is divided into 100 sec bins |
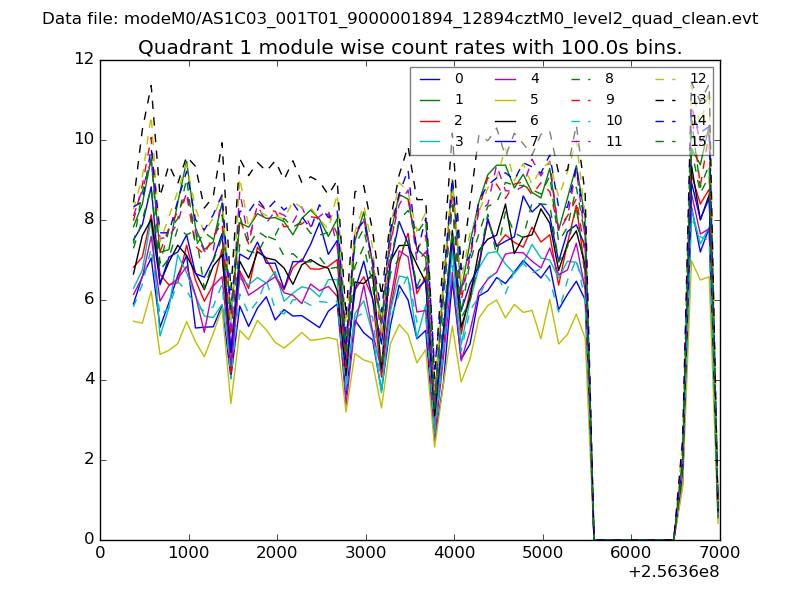 |
 |
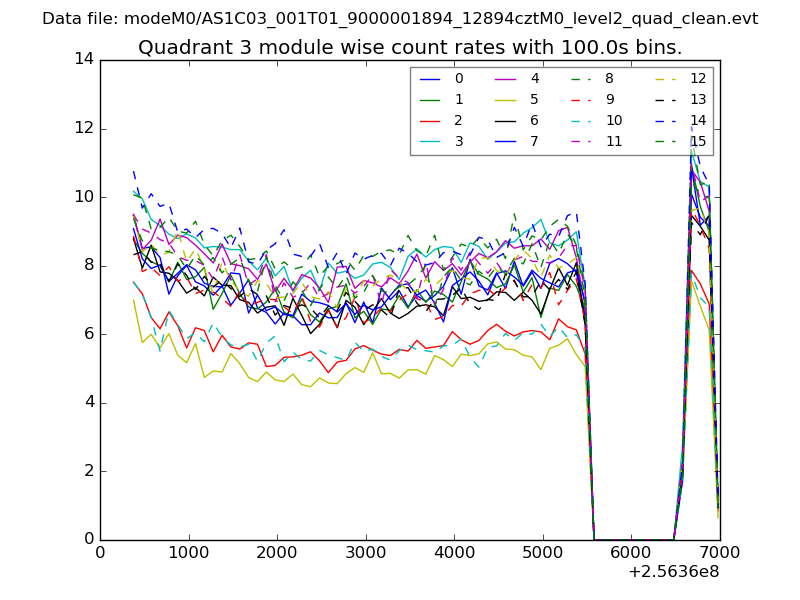
| Module-wise count rates for Quadrant C Data is divided into 100 sec bins |
 |
 |
| Module-wise count rates for Quadrant D Data is divided into 100 sec bins |
 |
 |
| Parameter | Plot |
|---|---|
| CZT HV Monitor | 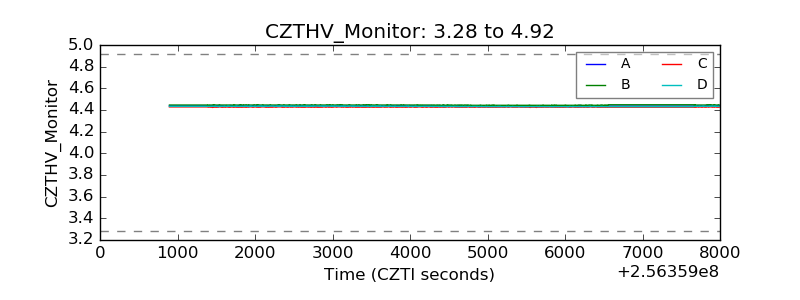 |
| D_VDD | 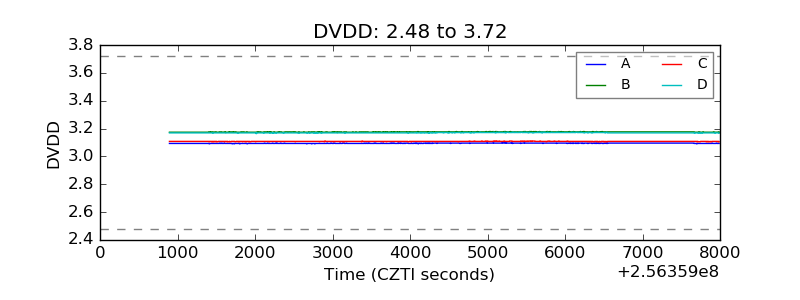 |
| Temperature 1 | 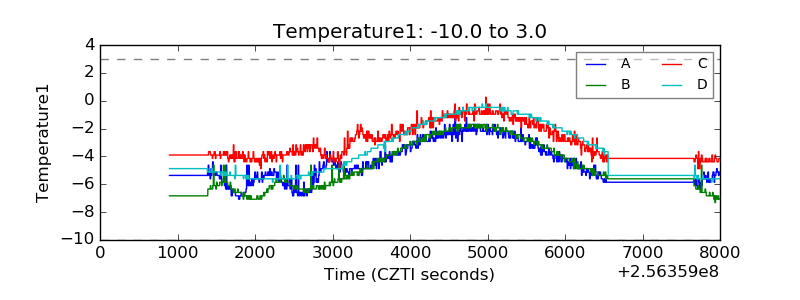 |
| Veto HV Monitor | 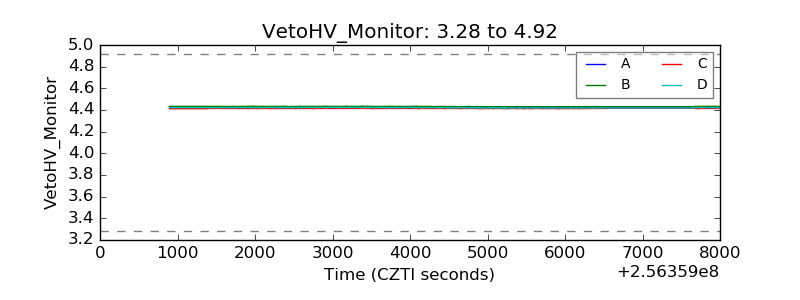 |
| Veto LLD | 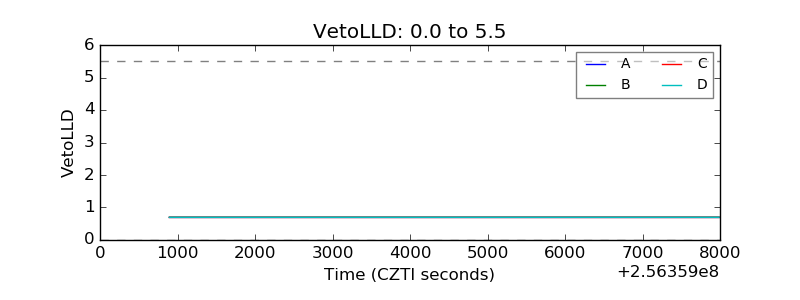 |
| Alpha Counter | 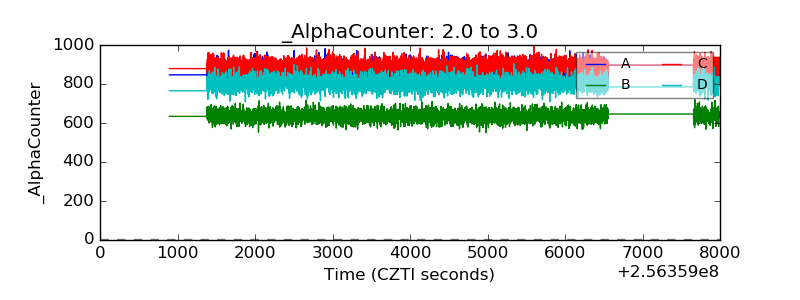 |
| _CPM_Rate | 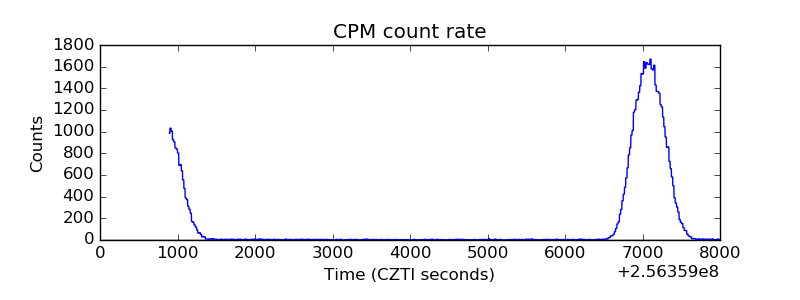 |
| CZT Counter | 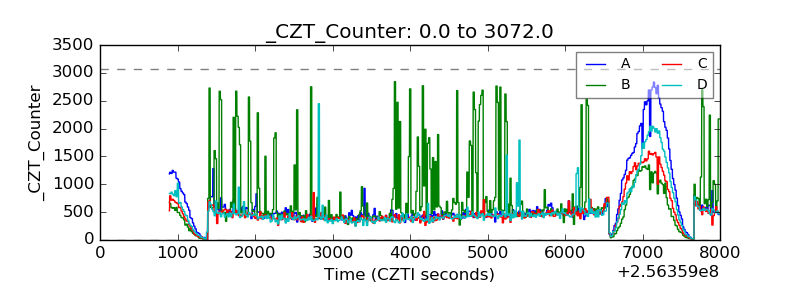 |
| +2.5 Volts monitor | 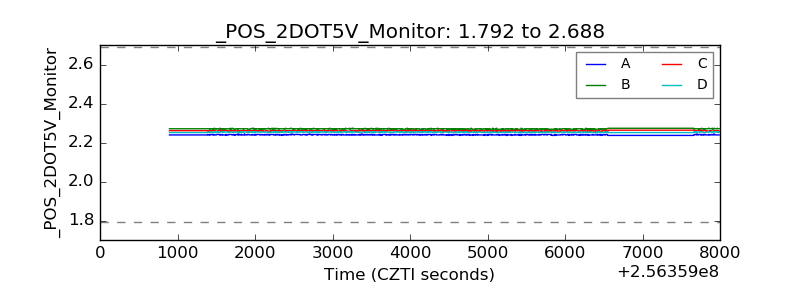 |
| +5 Volts monitor |  |
| _ROLL_ROT | 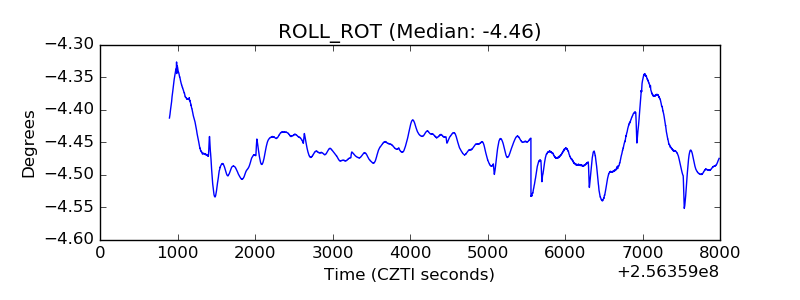 |
| _Roll_DEC | 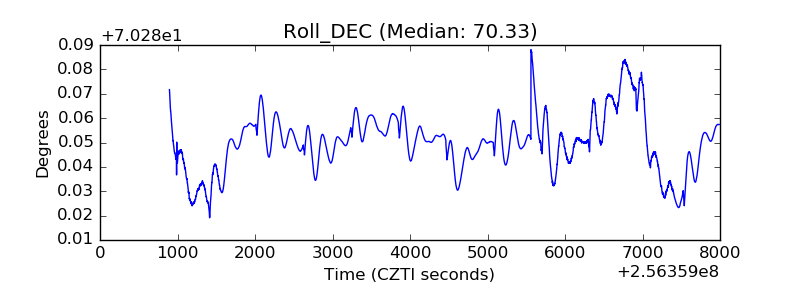 |
| _Roll_RA |  |
| Veto Counter | 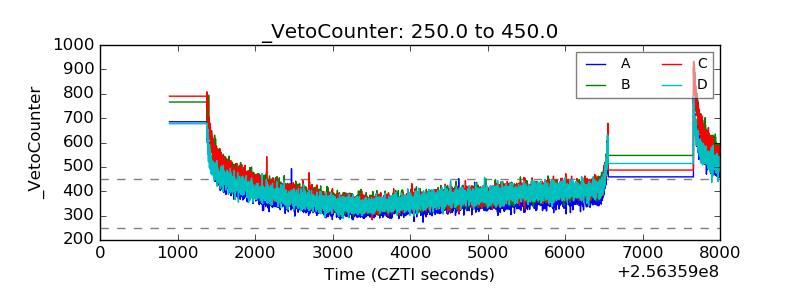 |