| Param | Original file | Final file |
|---|---|---|
| Filename | modeM0/AS1A04_116T01_9000001896cztM0_level2.fits | modeM0/AS1A04_116T01_9000001896cztM0_level2_quad_clean.evt |
| Size (bytes) | 1,596,519,360 | 1,830,240,000 |
| Size | 1.5 GB | 1.7 GB |
| Events in quadrant A | 9,962,778 | 11,949,876 |
| Events in quadrant B | 8,680,396 | 10,229,756 |
| Events in quadrant C | 9,825,552 | 11,504,854 |
| Events in quadrant D | 8,417,690 | 10,297,028 |
| Mode M9 | |||
|---|---|---|---|
| Quadrant | BADHDUFLAG | Total packets | Discarded packets |
| A | 0 | 277 | 0 |
| B | 0 | 277 | 0 |
| C | 0 | 277 | 0 |
| D | 0 | 277 | 0 |
| Mode SS | |||
|---|---|---|---|
| Quadrant | BADHDUFLAG | Total packets | Discarded packets |
| A | 0 | 3406 | 0 |
| B | 0 | 3406 | 0 |
| C | 0 | 3406 | 0 |
| D | 0 | 3406 | 0 |
| Mode M0 | |||
|---|---|---|---|
| Quadrant | BADHDUFLAG | Total packets | Discarded packets |
| A | 0 | 369454 | 0 |
| B | 0 | 493214 | 0 |
| C | 0 | 344696 | 0 |
| D | 0 | 428587 | 0 |
| Quadrant | Total seconds | Saturated seconds | Saturation percentage |
|---|---|---|---|
| A | 167147 | 2805 | 1.678164% |
| B | 167147 | 25267 | 15.116634% |
| C | 167147 | 1357 | 0.811860% |
| D | 167147 | 6811 | 4.074856% |
Noise dominated data is calculated using 1-second bins in cleaned event files. If a bin has >2000 counts, and if more than 50% of those come from <1% of pixels, then it is considered to be noise-dominated and hence unusable.
| Quadrant | # 1 sec bins | Bins with >0 counts | Bins with >2000 counts | High rate bins dominated by noise | Noise dominated (total time) | Noise dominated (detector-on time) | Marked lightcurve |
|---|---|---|---|---|---|---|---|
| A | 195043 | 167144 | 0 | 0 | 0.00% | 0.00% | 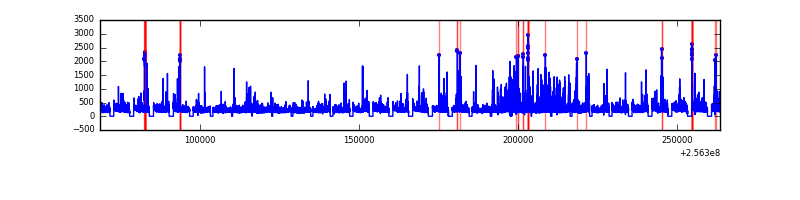 |
| B | 195043 | 161363 | 0 | 0 | 0.00% | 0.00% | 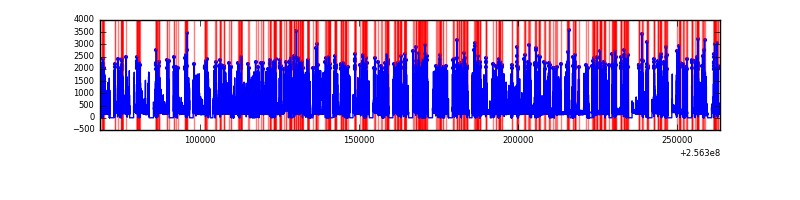 |
| C | 195043 | 167148 | 0 | 0 | 0.00% | 0.00% | 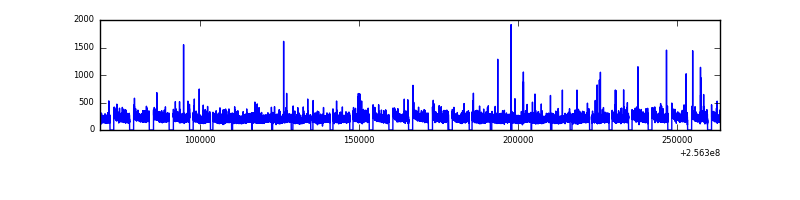 |
| D | 195043 | 167040 | 0 | 0 | 0.00% | 0.00% |  |
Top three noisy pixels from each quadrant. If the there are fewer than three noisy pixels in the level2.evt file, extra rows are filled as -1
| Pixel properties | Quadrant properties | ||||||
|---|---|---|---|---|---|---|---|
| Quadrant | DetID | PixID | Counts | Sigma | Mean | Median | Sigma |
| A | 0 | 29 | 9713 | 11.49 | 2599 | 2451 | 631.8 |
| A | 7 | 110 | 8085 | 8.92 | 2599 | 2451 | 631.8 |
| A | 0 | 30 | 7442 | 7.9 | 2599 | 2451 | 631.8 |
| B | 2 | 9 | 7461 | 11.92 | 2295 | 2203 | 441.2 |
| B | 14 | 254 | 5899 | 8.38 | 2295 | 2203 | 441.2 |
| B | 5 | 128 | 5667 | 7.85 | 2295 | 2203 | 441.2 |
| C | 1 | 80 | 7281 | 7.36 | 2594 | 2428 | 659.0 |
| C | 1 | 81 | 7226 | 7.28 | 2594 | 2428 | 659.0 |
| C | 12 | 241 | 6666 | 6.43 | 2594 | 2428 | 659.0 |
| D | 6 | 231 | 6051 | 6.08 | 2403 | 2188 | 635.3 |
| D | 10 | 189 | 6011 | 6.02 | 2403 | 2188 | 635.3 |
| D | 6 | 38 | 5862 | 5.78 | 2403 | 2188 | 635.3 |
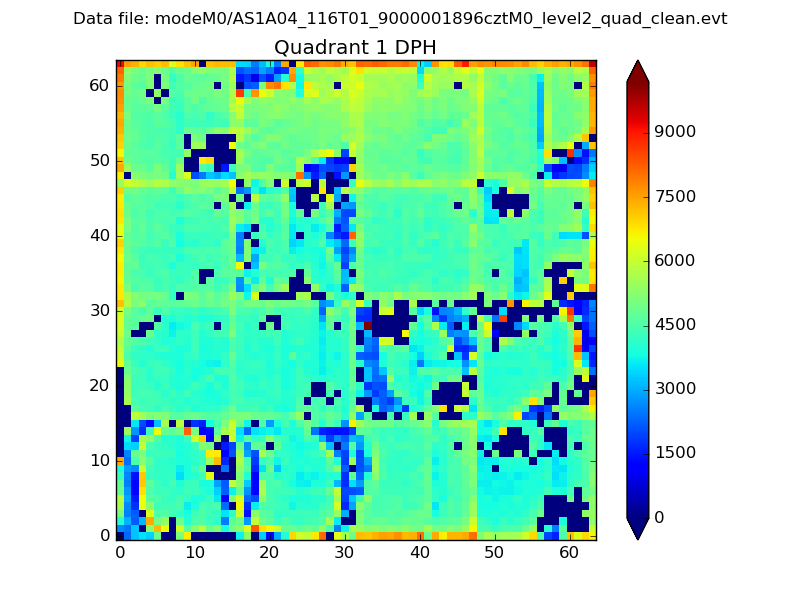
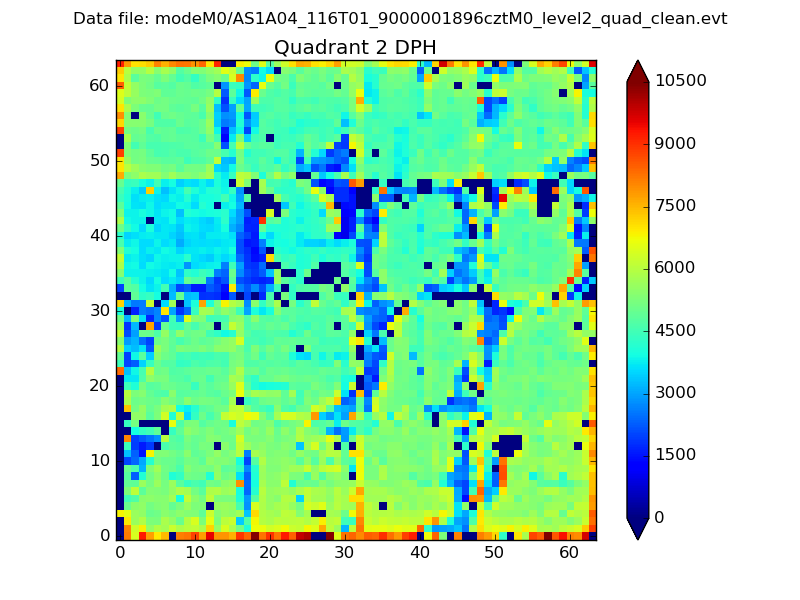
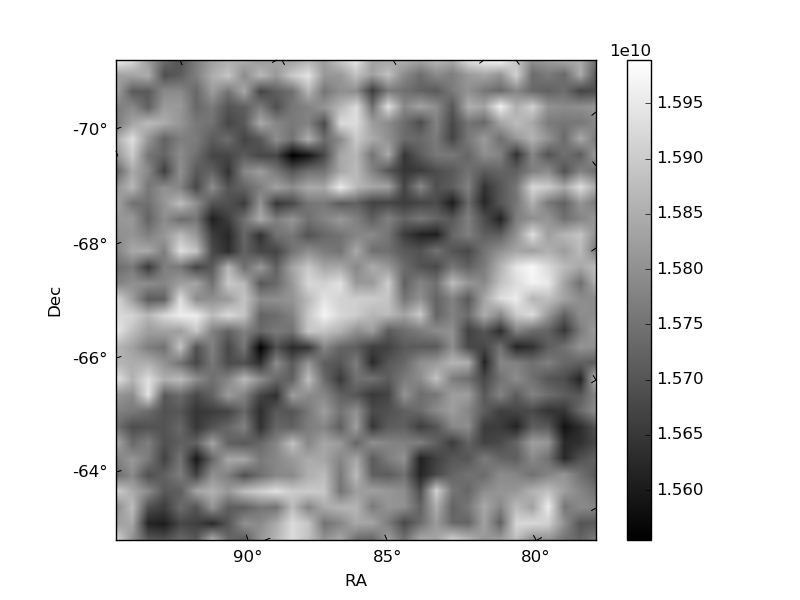
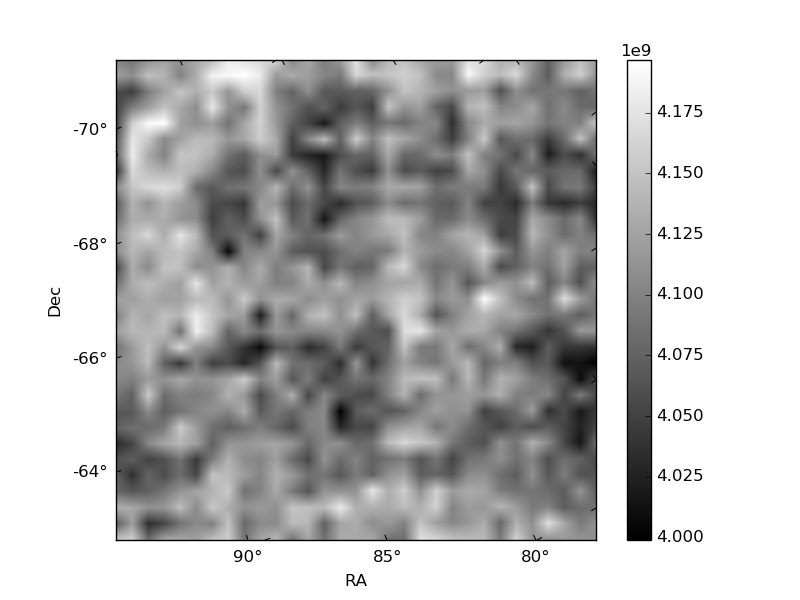
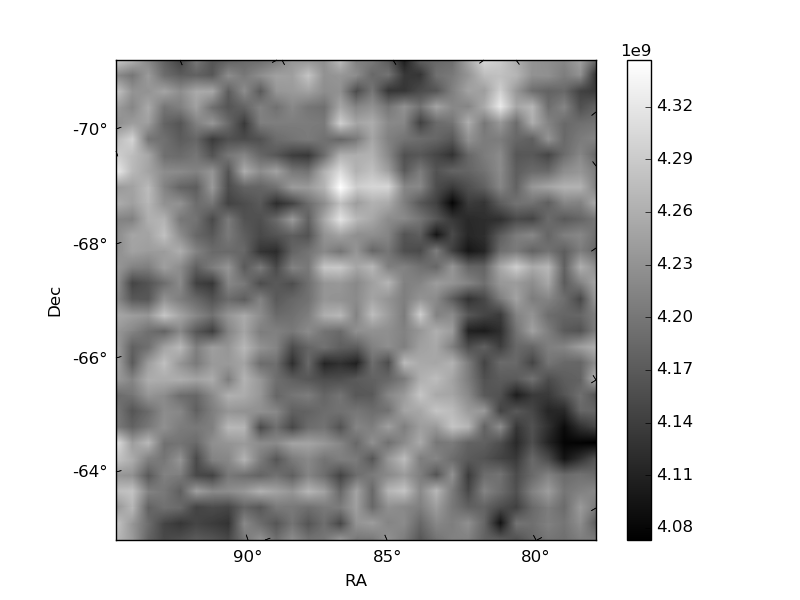
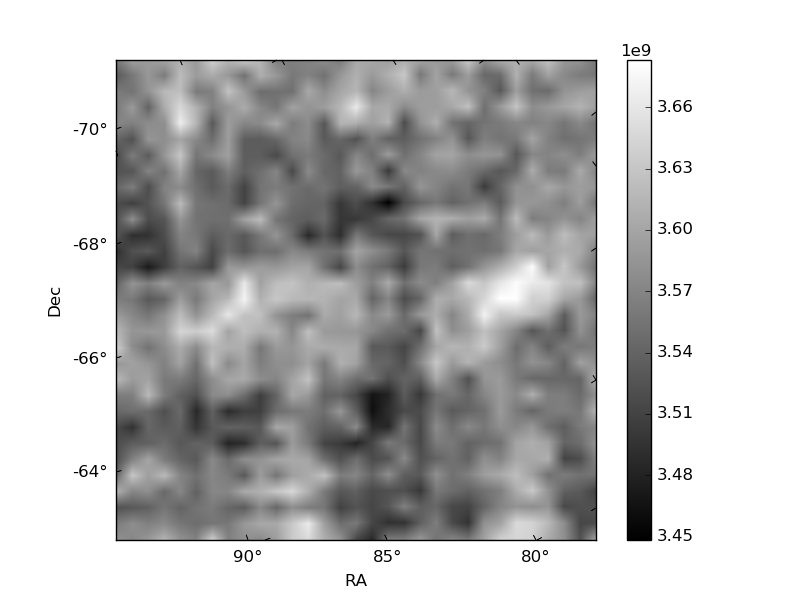
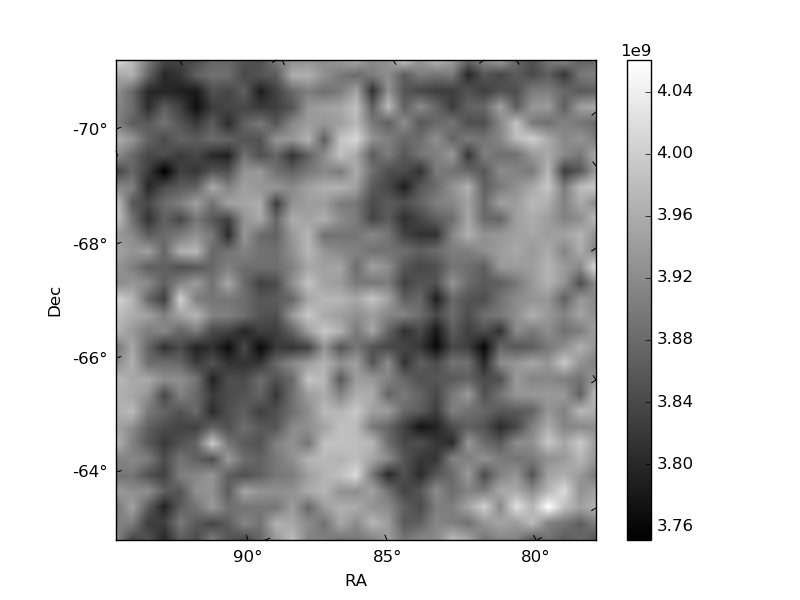
Histogram calculated using DETX and DETY for each event in the final _common_clean file
| Quadrant A | 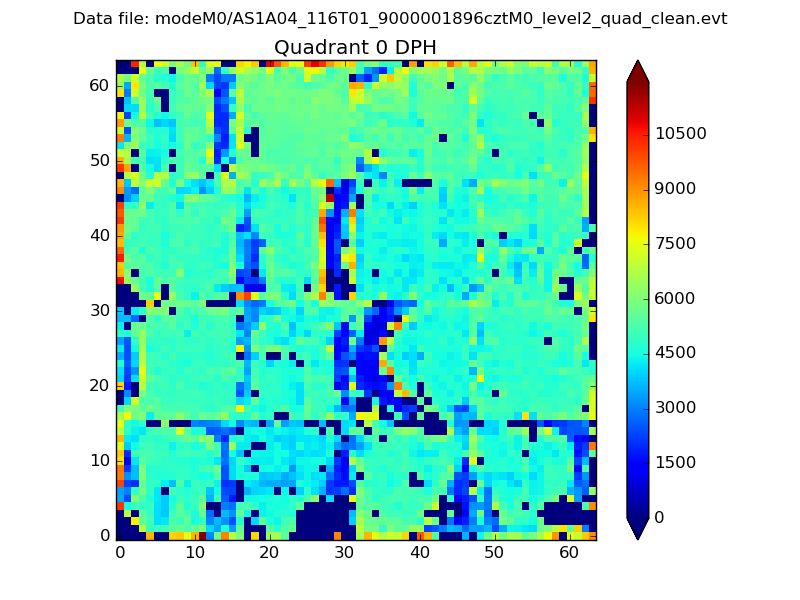 |
 |
Quadrant B |
|---|---|---|---|
| Quadrant D | 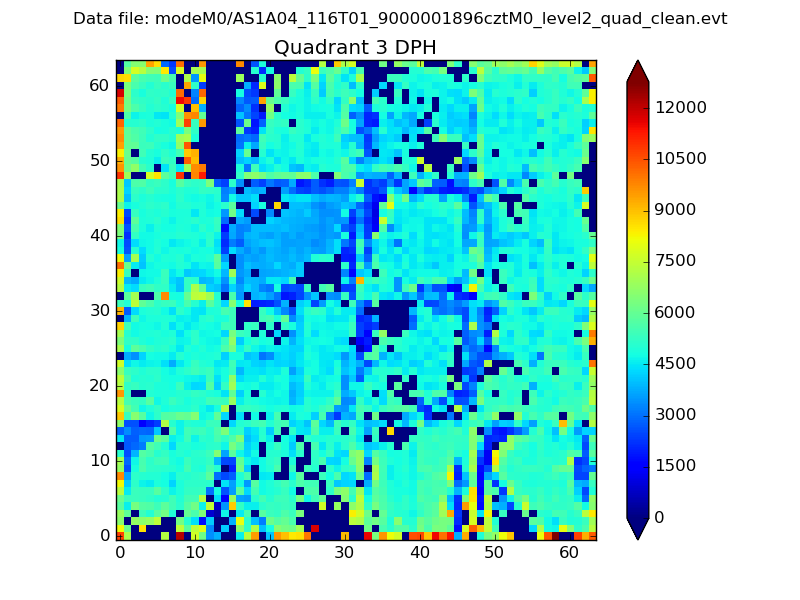 |
 |
Quadrant C |
| Plot type | Count rate plots | Images |
|---|---|---|
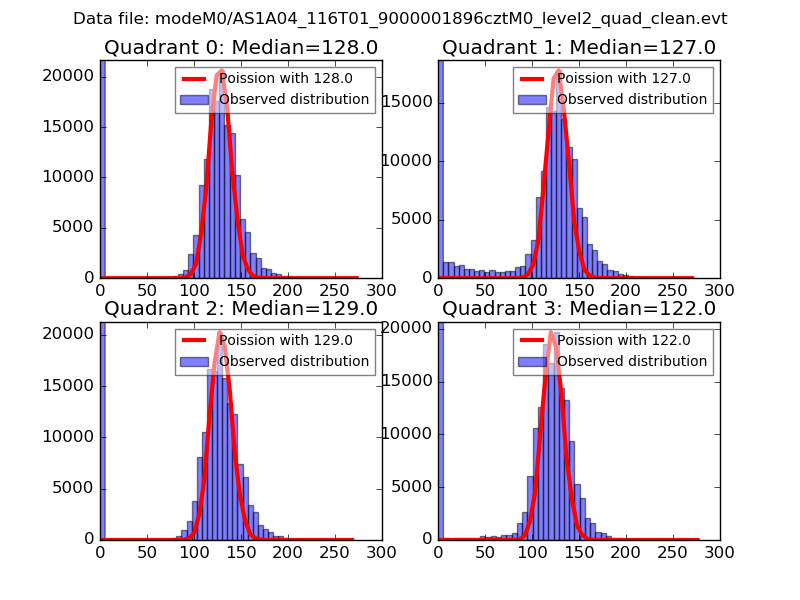
| Comparison with Poisson distribution Blue bars denote a histogram of data divided into 1 sec bins. Red curve is a Poisson curve with rate = median count rate of data. |
 |
 |
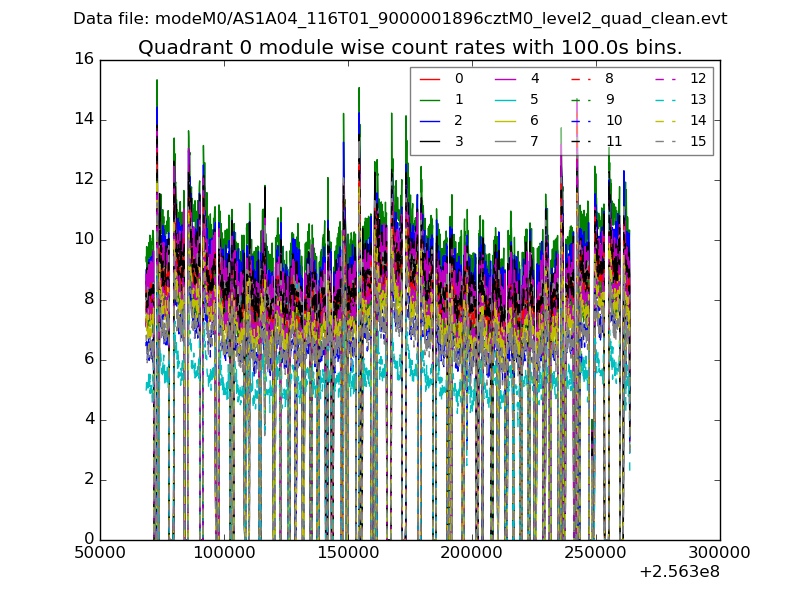
| Quadrant-wise count rates Data is divided into 100 sec bins |
 |
|
| Module-wise count rates for Quadrant A Data is divided into 100 sec bins |
 |
 |
| Module-wise count rates for Quadrant B Data is divided into 100 sec bins |
 |
 |
| Module-wise count rates for Quadrant C Data is divided into 100 sec bins |
 |
 |
| Module-wise count rates for Quadrant D Data is divided into 100 sec bins |
 |
 |
| Parameter | Plot |
|---|---|
| CZT HV Monitor |  |
| D_VDD | 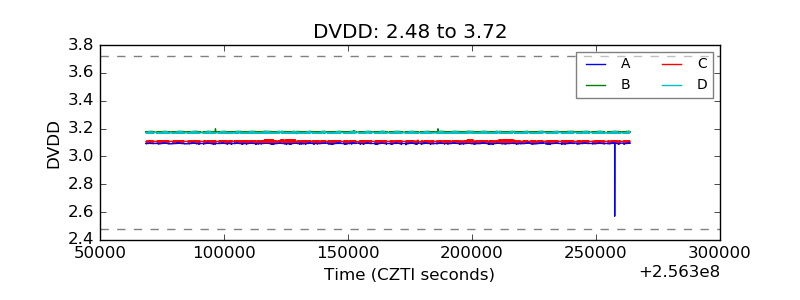 |
| Temperature 1 |  |
| Veto HV Monitor |  |
| Veto LLD | 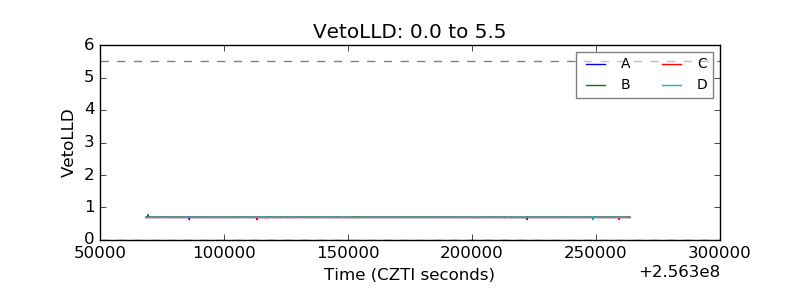 |
| Alpha Counter | 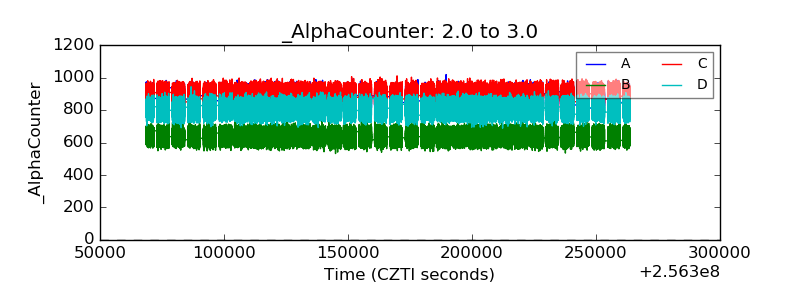 |
| _CPM_Rate | 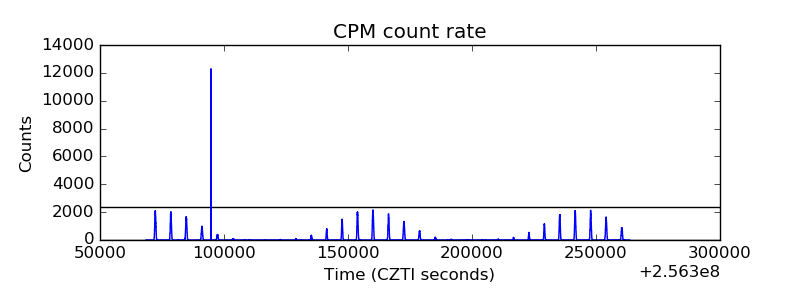 |
| CZT Counter | 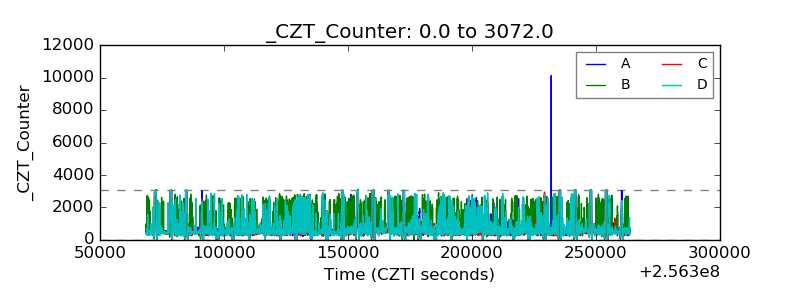 |
| +2.5 Volts monitor |  |
| +5 Volts monitor |  |
| _ROLL_ROT | 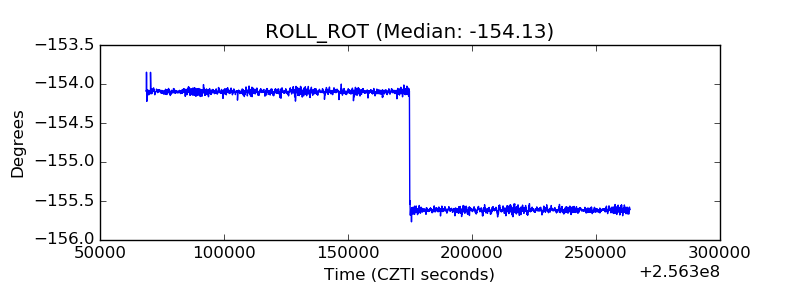 |
| _Roll_DEC | 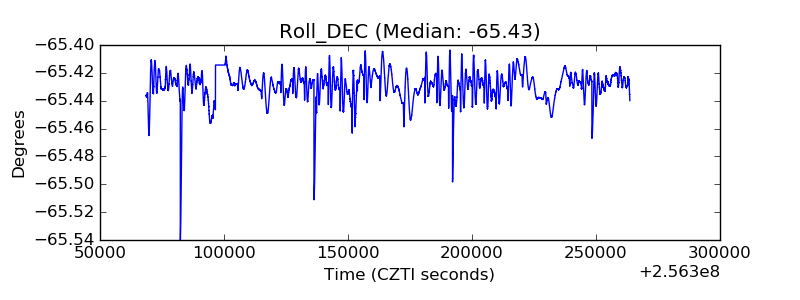 |
| _Roll_RA | 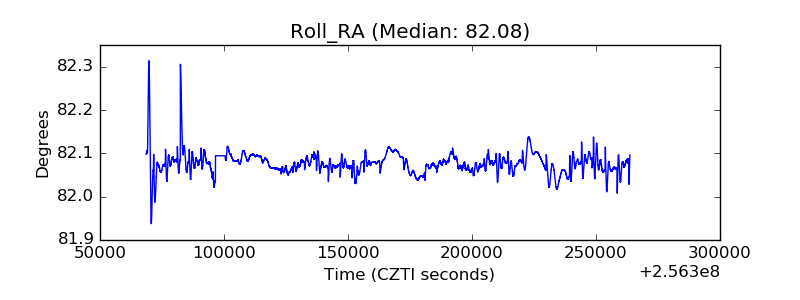 |
| Veto Counter |  |