| Param | Original file | Final file |
|---|---|---|
| Filename | modeM0/AS1A04_116T01_9000001896_12894cztM0_level2.evt | modeM0/AS1A04_116T01_9000001896_12894cztM0_level2_quad_clean.evt |
| Size (bytes) | 329,644,800 | 74,534,400 |
| Size | 314.4 MB | 71.1 MB |
| Events in quadrant A | 2,279,241 | 499,293 |
| Events in quadrant B | 3,117,611 | 465,559 |
| Events in quadrant C | 2,100,182 | 499,737 |
| Events in quadrant D | 2,182,198 | 478,865 |
| Mode M9 | |||
|---|---|---|---|
| Quadrant | BADHDUFLAG | Total packets | Discarded packets |
| A | 0 | 12 | 0 |
| B | 0 | 12 | 0 |
| C | 0 | 12 | 0 |
| D | 0 | 12 | 0 |
| Mode SS | |||
|---|---|---|---|
| Quadrant | BADHDUFLAG | Total packets | Discarded packets |
| A | 0 | 90 | 0 |
| B | 0 | 90 | 0 |
| C | 0 | 90 | 0 |
| D | 0 | 90 | 0 |
| Mode M0 | |||
|---|---|---|---|
| Quadrant | BADHDUFLAG | Total packets | Discarded packets |
| A | 0 | 9614 | 2 |
| B | 0 | 12170 | 1 |
| C | 0 | 9436 | 1 |
| D | 0 | 9679 | 1 |
| Quadrant | Total seconds | Saturated seconds | Saturation percentage |
|---|---|---|---|
| A | 4461 | 57 | 1.277740% |
| B | 4461 | 480 | 10.759919% |
| C | 4461 | 49 | 1.098408% |
| D | 4461 | 61 | 1.367406% |
Noise dominated data is calculated using 1-second bins in cleaned event files. If a bin has >2000 counts, and if more than 50% of those come from <1% of pixels, then it is considered to be noise-dominated and hence unusable.
| Quadrant | # 1 sec bins | Bins with >0 counts | Bins with >2000 counts | High rate bins dominated by noise | Noise dominated (total time) | Noise dominated (detector-on time) | Marked lightcurve |
|---|---|---|---|---|---|---|---|
| A | 5666 | 4462 | 0 | 0 | 0.00% | 0.00% | 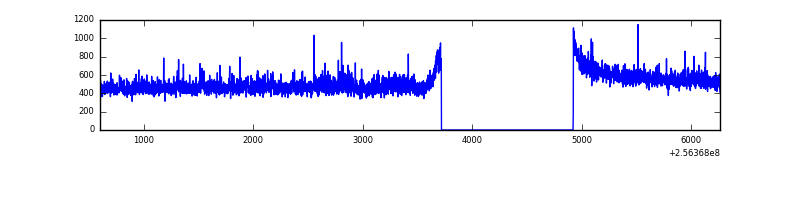 |
| B | 5666 | 4462 | 205 | 205 | 3.62% | 4.59% | 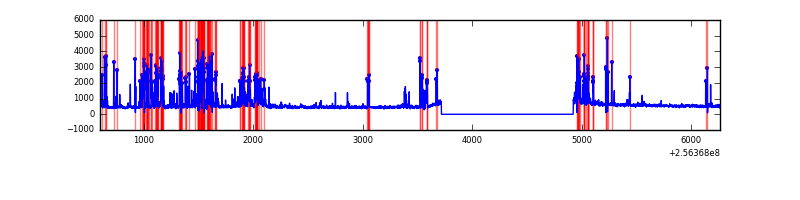 |
| C | 5666 | 4462 | 0 | 0 | 0.00% | 0.00% |  |
| D | 5666 | 4462 | 13 | 13 | 0.23% | 0.29% | 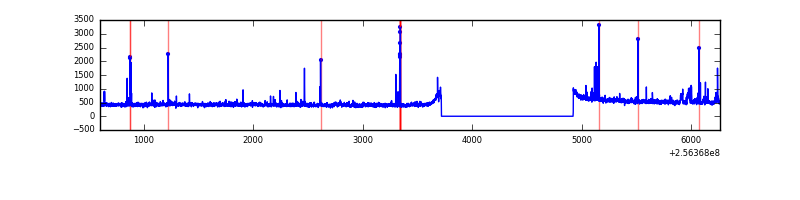 |
Top three noisy pixels from each quadrant. If the there are fewer than three noisy pixels in the level2.evt file, extra rows are filled as -1
| Pixel properties | Quadrant properties | ||||||
|---|---|---|---|---|---|---|---|
| Quadrant | DetID | PixID | Counts | Sigma | Mean | Median | Sigma |
| A | 1 | 162 | 46099 | 401.52 | 560 | 548 | 113.4 |
| A | 1 | 178 | 24240 | 208.84 | 560 | 548 | 113.4 |
| A | 1 | 161 | 20666 | 177.34 | 560 | 548 | 113.4 |
| B | 4 | 239 | 907993 | 9333.7 | 523 | 510 | 97.2 |
| B | 3 | 64 | 68612 | 700.45 | 523 | 510 | 97.2 |
| B | 3 | 209 | 29879 | 302.07 | 523 | 510 | 97.2 |
| C | 13 | 61 | 4002 | 27.85 | 537 | 539 | 124.3 |
| C | 4 | 112 | 2467 | 15.51 | 537 | 539 | 124.3 |
| C | 3 | 202 | 1334 | 6.39 | 537 | 539 | 124.3 |
| D | 1 | 52 | 83123 | 642.98 | 537 | 519 | 128.5 |
| D | 2 | 136 | 45039 | 346.54 | 537 | 519 | 128.5 |
| D | 2 | 234 | 17567 | 132.7 | 537 | 519 | 128.5 |
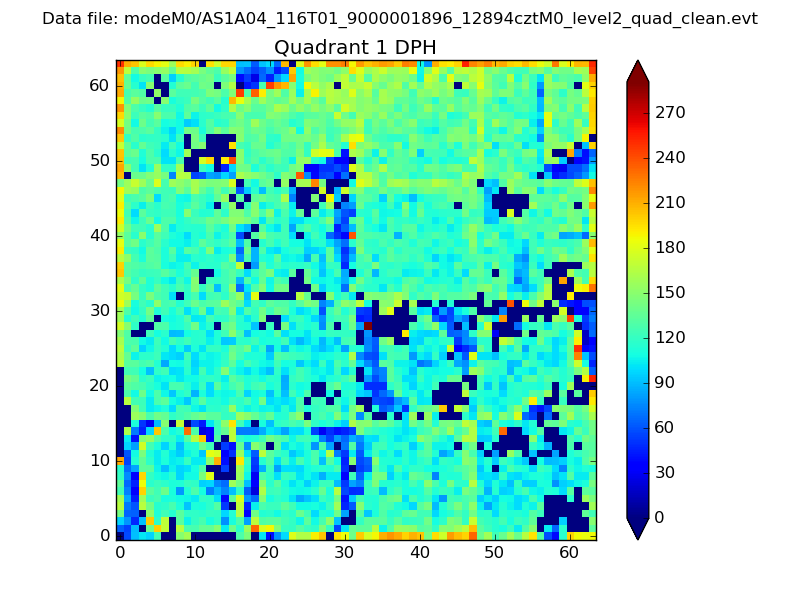
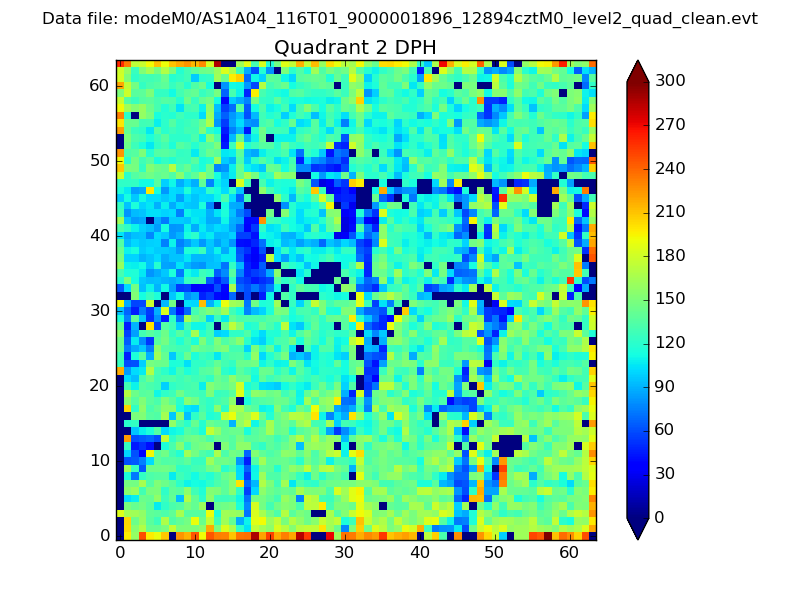
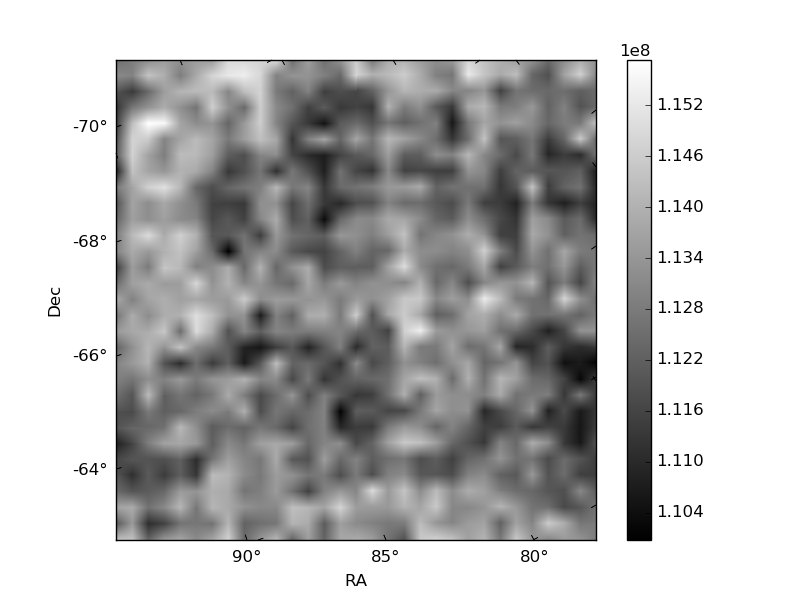
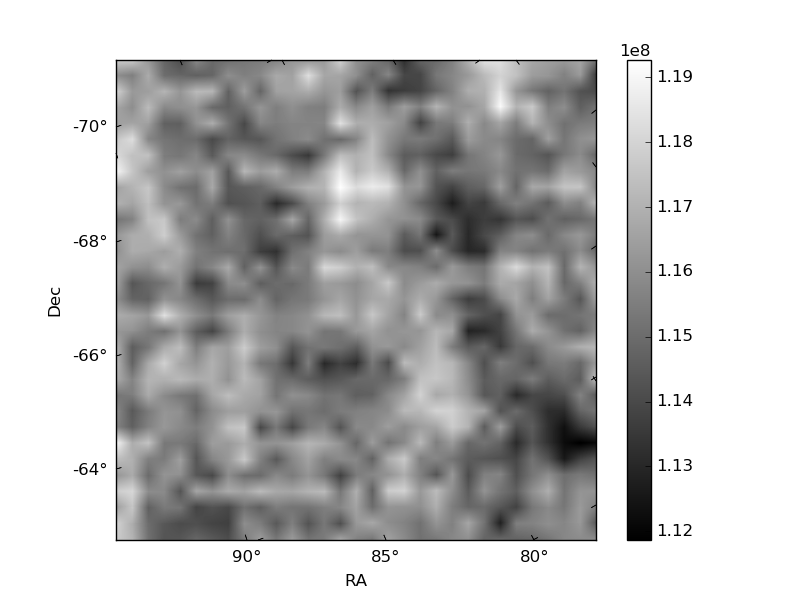
Histogram calculated using DETX and DETY for each event in the final _common_clean file
| Quadrant A |  |
 |
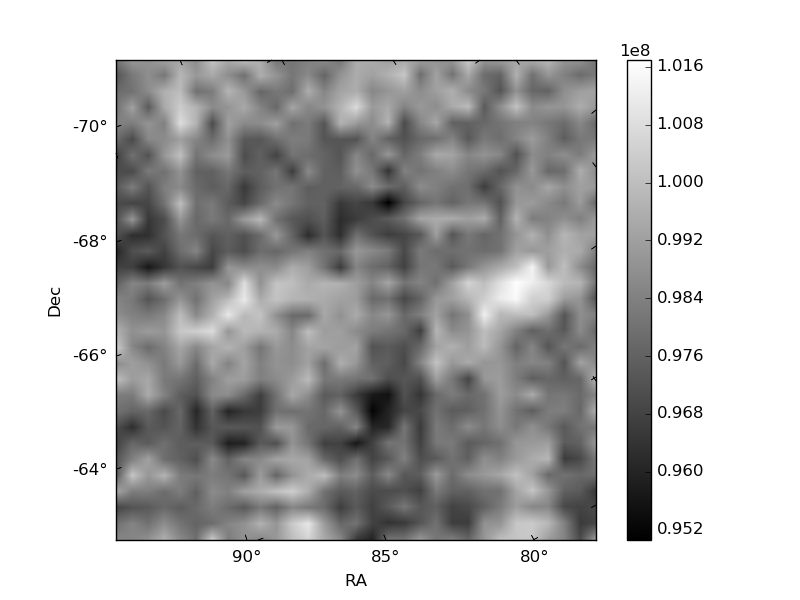
Quadrant B |
|---|---|---|---|
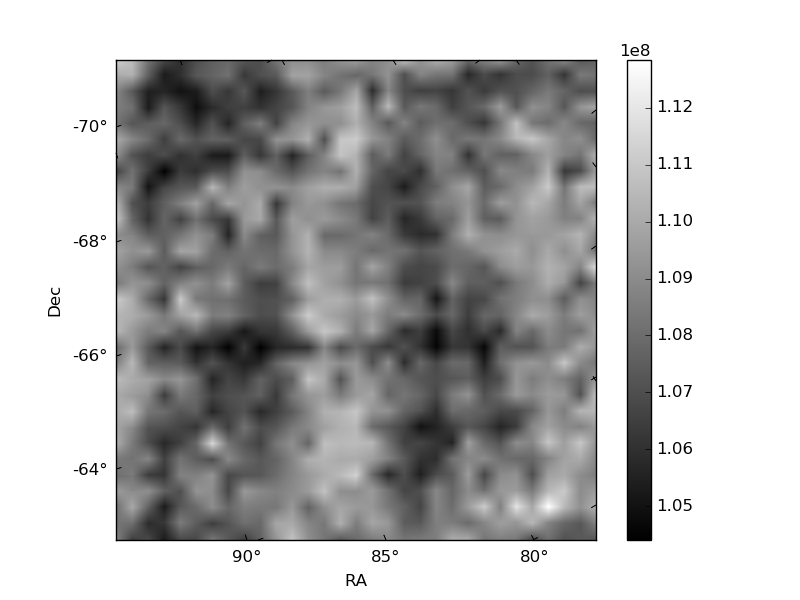
| Quadrant D | 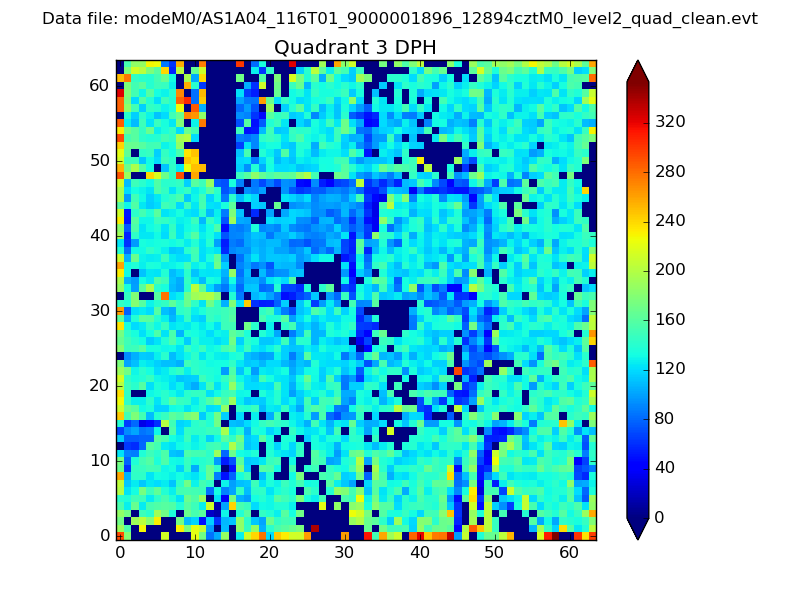 |
 |
Quadrant C |
| Plot type | Count rate plots | Images |
|---|---|---|
| Comparison with Poisson distribution Blue bars denote a histogram of data divided into 1 sec bins. Red curve is a Poisson curve with rate = median count rate of data. |
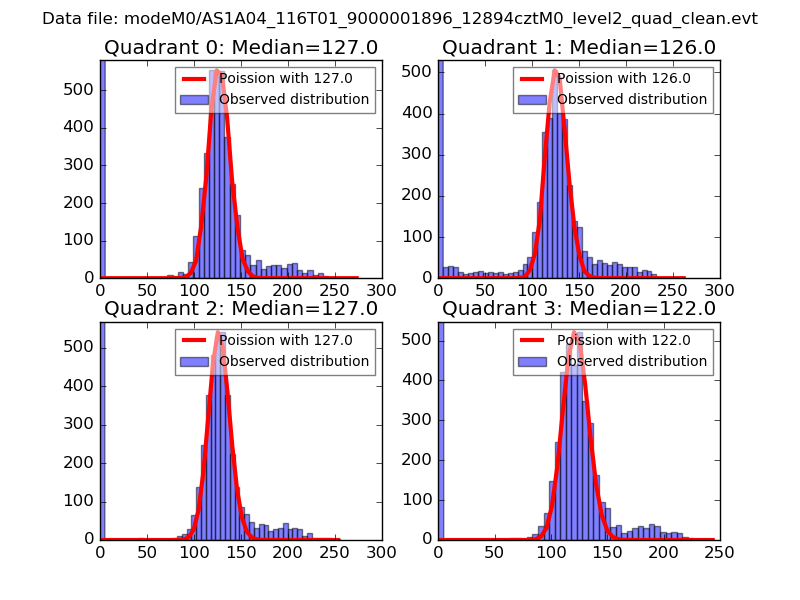 |
 |
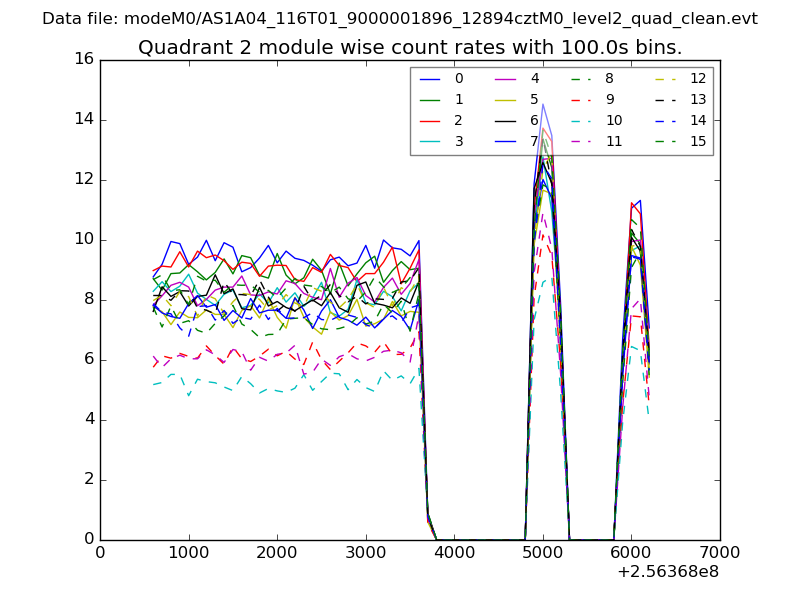
| Quadrant-wise count rates Data is divided into 100 sec bins |
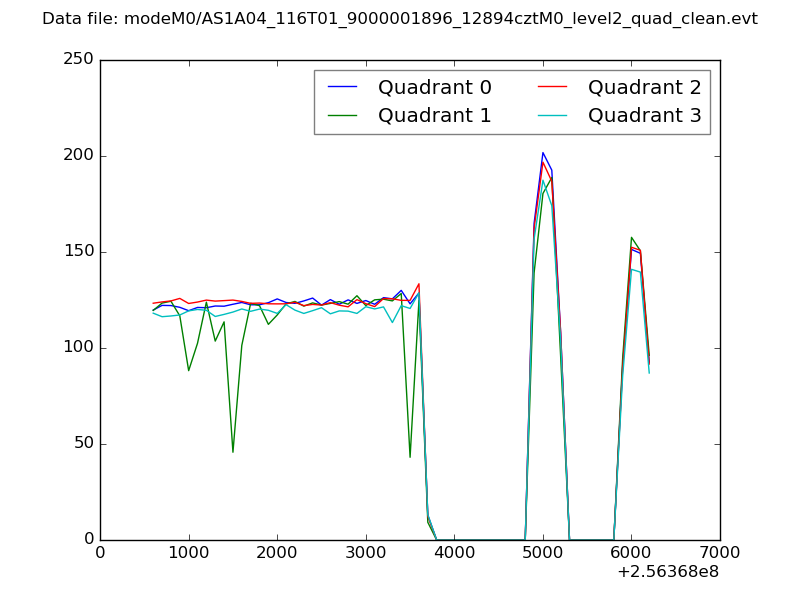 |
|
| Module-wise count rates for Quadrant A Data is divided into 100 sec bins |
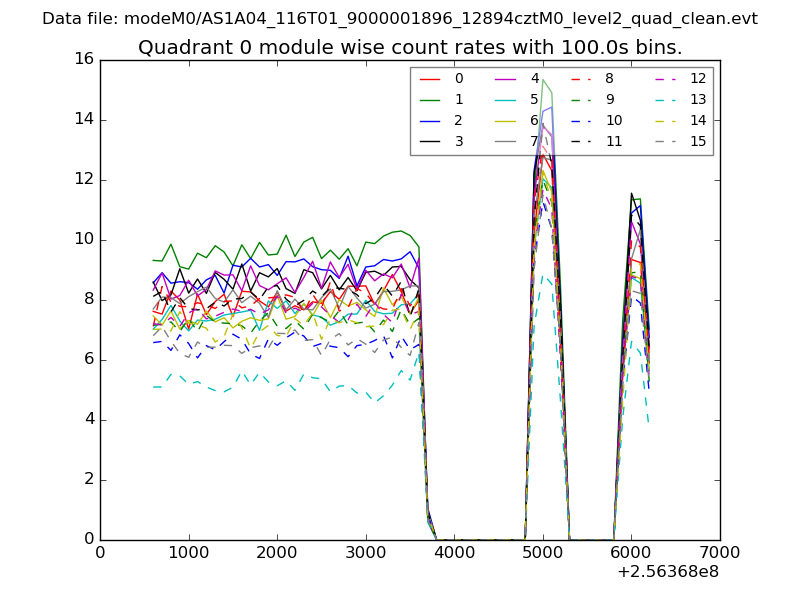 |
 |
| Module-wise count rates for Quadrant B Data is divided into 100 sec bins |
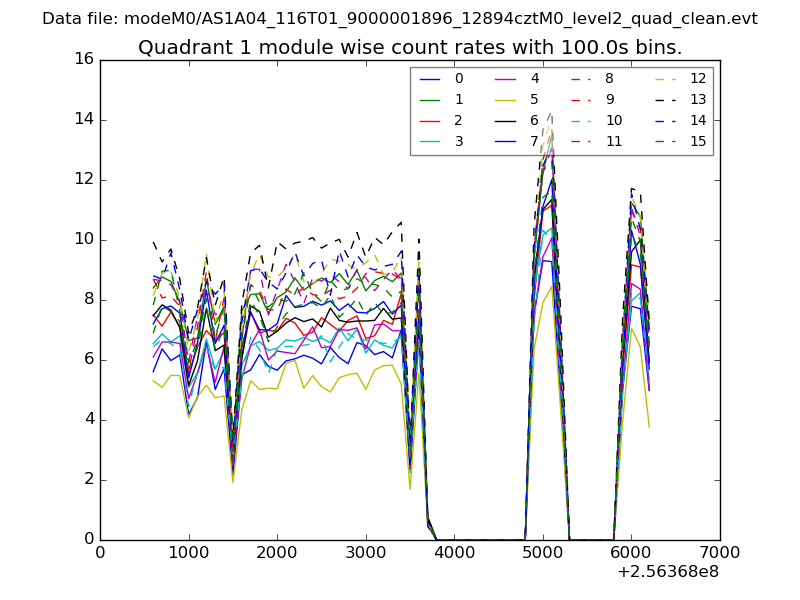 |
 |
| Module-wise count rates for Quadrant C Data is divided into 100 sec bins |
 |
 |
| Module-wise count rates for Quadrant D Data is divided into 100 sec bins |
 |
 |
| Parameter | Plot |
|---|---|
| CZT HV Monitor | 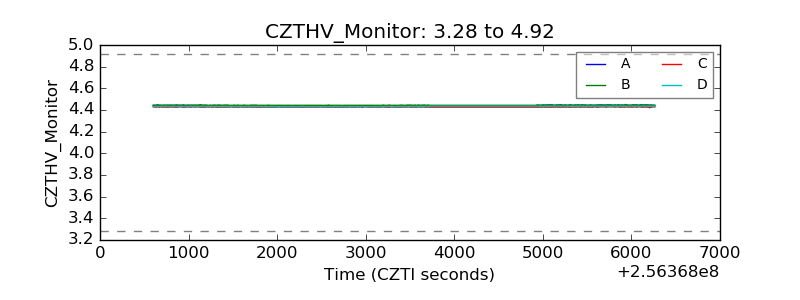 |
| D_VDD | 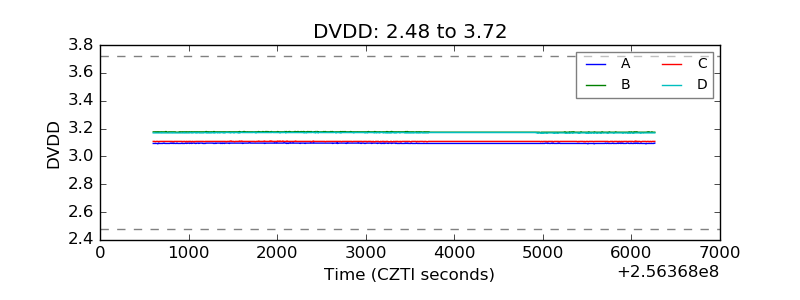 |
| Temperature 1 | 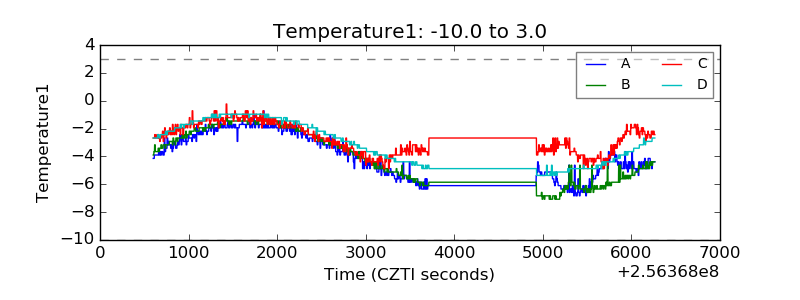 |
| Veto HV Monitor | 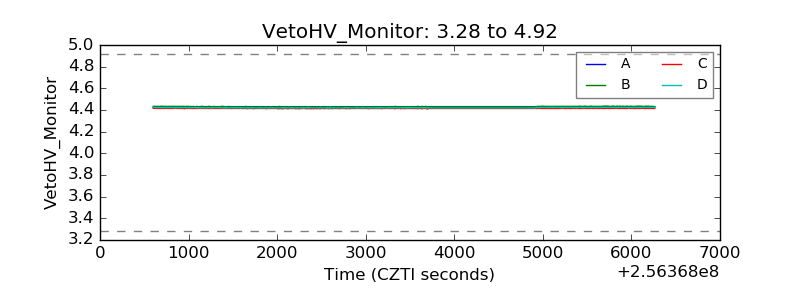 |
| Veto LLD | 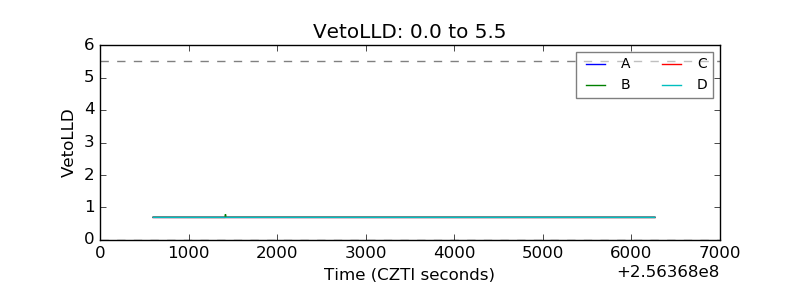 |
| Alpha Counter | 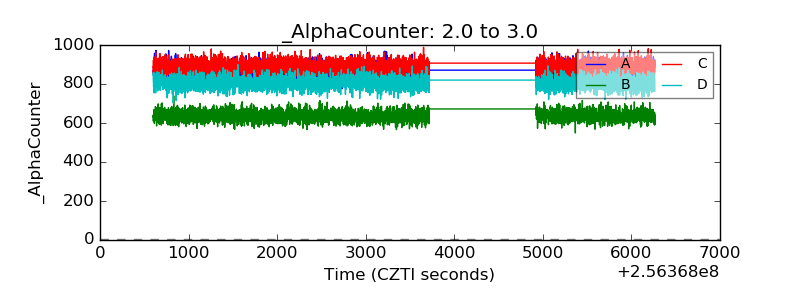 |
| _CPM_Rate | 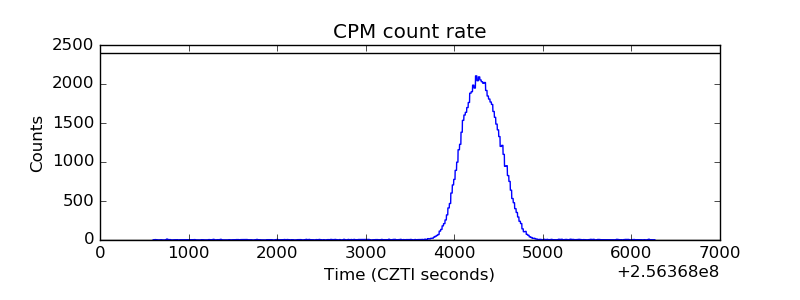 |
| CZT Counter | 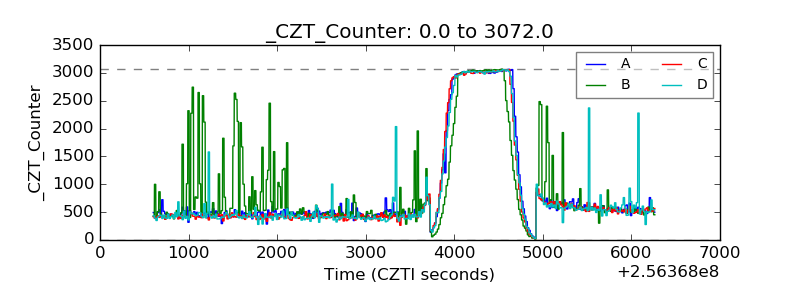 |
| +2.5 Volts monitor |  |
| +5 Volts monitor |  |
| _ROLL_ROT | 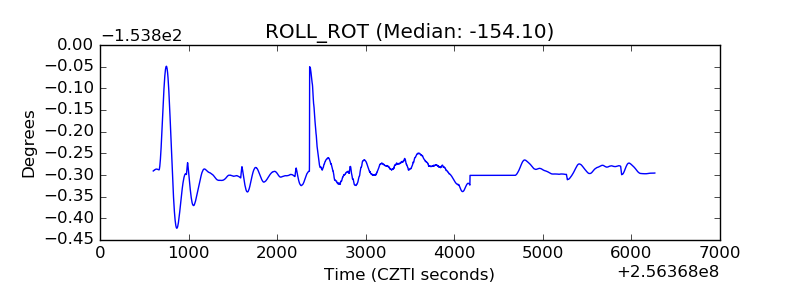 |
| _Roll_DEC | 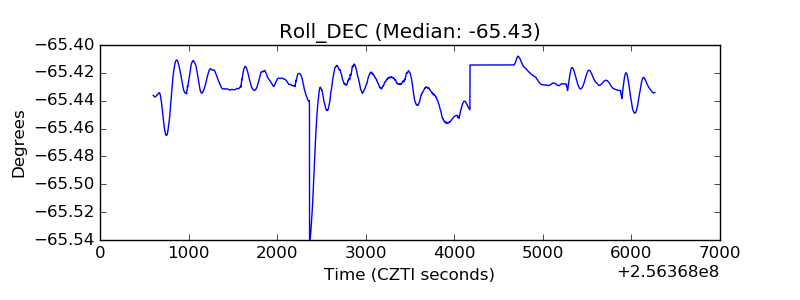 |
| _Roll_RA | 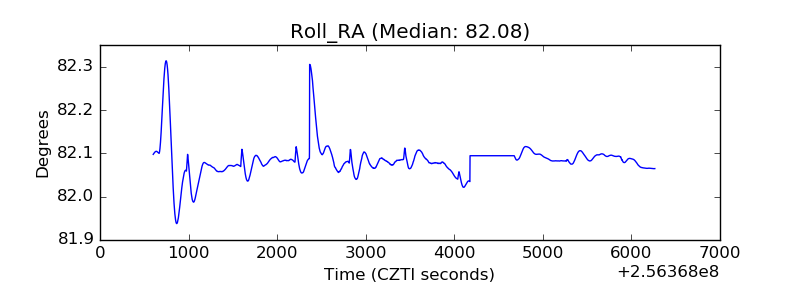 |
| Veto Counter | 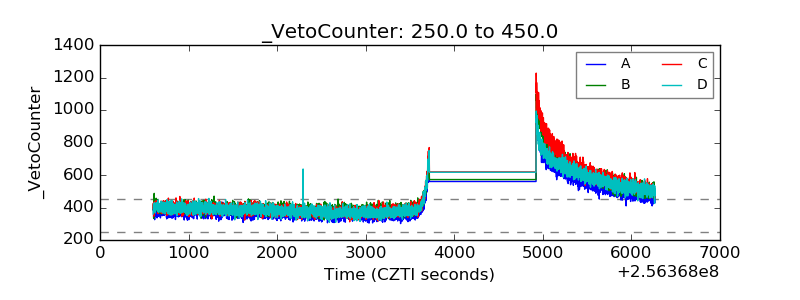 |