| Param | Original file | Final file |
|---|---|---|
| Filename | modeM0/AS1A04_116T01_9000001896_12896cztM0_level2.evt | modeM0/AS1A04_116T01_9000001896_12896cztM0_level2_quad_clean.evt |
| Size (bytes) | 500,088,960 | 117,023,040 |
| Size | 476.9 MB | 111.6 MB |
| Events in quadrant A | 3,478,421 | 798,516 |
| Events in quadrant B | 4,583,933 | 752,677 |
| Events in quadrant C | 3,184,775 | 795,999 |
| Events in quadrant D | 3,474,923 | 761,883 |
| Mode M9 | |||
|---|---|---|---|
| Quadrant | BADHDUFLAG | Total packets | Discarded packets |
| A | 0 | 13 | 0 |
| B | 0 | 13 | 0 |
| C | 0 | 13 | 0 |
| D | 0 | 13 | 0 |
| Mode SS | |||
|---|---|---|---|
| Quadrant | BADHDUFLAG | Total packets | Discarded packets |
| A | 0 | 128 | 0 |
| B | 0 | 128 | 0 |
| C | 0 | 128 | 0 |
| D | 0 | 128 | 0 |
| Mode M0 | |||
|---|---|---|---|
| Quadrant | BADHDUFLAG | Total packets | Discarded packets |
| A | 0 | 14332 | 3 |
| B | 0 | 17708 | 2 |
| C | 0 | 13556 | 2 |
| D | 0 | 14396 | 2 |
| Quadrant | Total seconds | Saturated seconds | Saturation percentage |
|---|---|---|---|
| A | 6228 | 130 | 2.087347% |
| B | 6228 | 666 | 10.693642% |
| C | 6228 | 89 | 1.429030% |
| D | 6228 | 155 | 2.488760% |
Noise dominated data is calculated using 1-second bins in cleaned event files. If a bin has >2000 counts, and if more than 50% of those come from <1% of pixels, then it is considered to be noise-dominated and hence unusable.
| Quadrant | # 1 sec bins | Bins with >0 counts | Bins with >2000 counts | High rate bins dominated by noise | Noise dominated (total time) | Noise dominated (detector-on time) | Marked lightcurve |
|---|---|---|---|---|---|---|---|
| A | 7560 | 6231 | 24 | 24 | 0.32% | 0.39% | 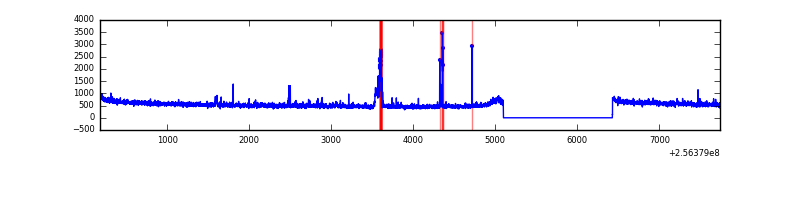 |
| B | 7560 | 6231 | 329 | 329 | 4.35% | 5.28% | 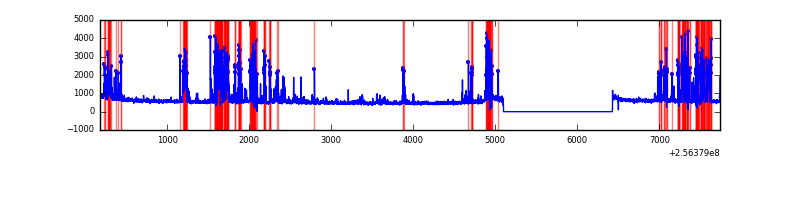 |
| C | 7560 | 6231 | 0 | 0 | 0.00% | 0.00% | 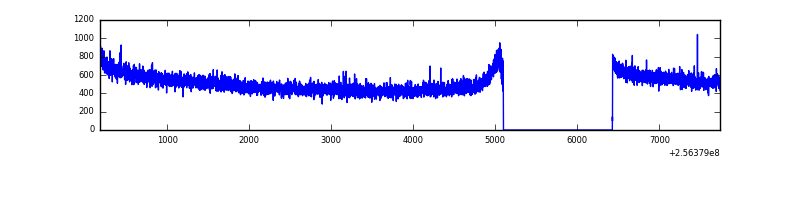 |
| D | 7560 | 6231 | 70 | 70 | 0.93% | 1.12% | 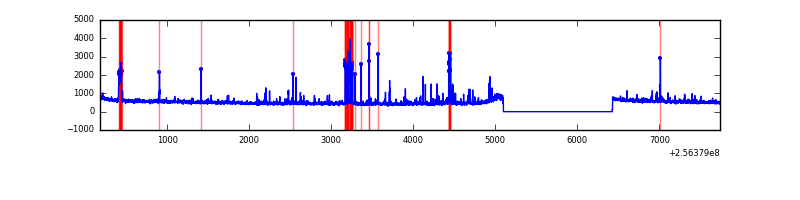 |
Top three noisy pixels from each quadrant. If the there are fewer than three noisy pixels in the level2.evt file, extra rows are filled as -1
| Pixel properties | Quadrant properties | ||||||
|---|---|---|---|---|---|---|---|
| Quadrant | DetID | PixID | Counts | Sigma | Mean | Median | Sigma |
| A | 15 | 174 | 139044 | 821.4 | 842 | 828 | 168.3 |
| A | 8 | 15 | 34130 | 197.91 | 842 | 828 | 168.3 |
| A | 1 | 162 | 27144 | 156.39 | 842 | 828 | 168.3 |
| B | 4 | 239 | 1264340 | 8699.14 | 793 | 776 | 145.3 |
| B | 0 | 85 | 78217 | 533.15 | 793 | 776 | 145.3 |
| B | 0 | 197 | 42768 | 289.1 | 793 | 776 | 145.3 |
| C | 4 | 112 | 14439 | 74.78 | 813 | 818 | 182.1 |
| C | 13 | 61 | 5947 | 28.16 | 813 | 818 | 182.1 |
| C | 3 | 202 | 2123 | 7.16 | 813 | 818 | 182.1 |
| D | 1 | 52 | 233775 | 1223.7 | 812 | 789 | 190.4 |
| D | 10 | 253 | 73686 | 382.87 | 812 | 789 | 190.4 |
| D | 2 | 14 | 56831 | 294.35 | 812 | 789 | 190.4 |
Histogram calculated using DETX and DETY for each event in the final _common_clean file
| Quadrant A | 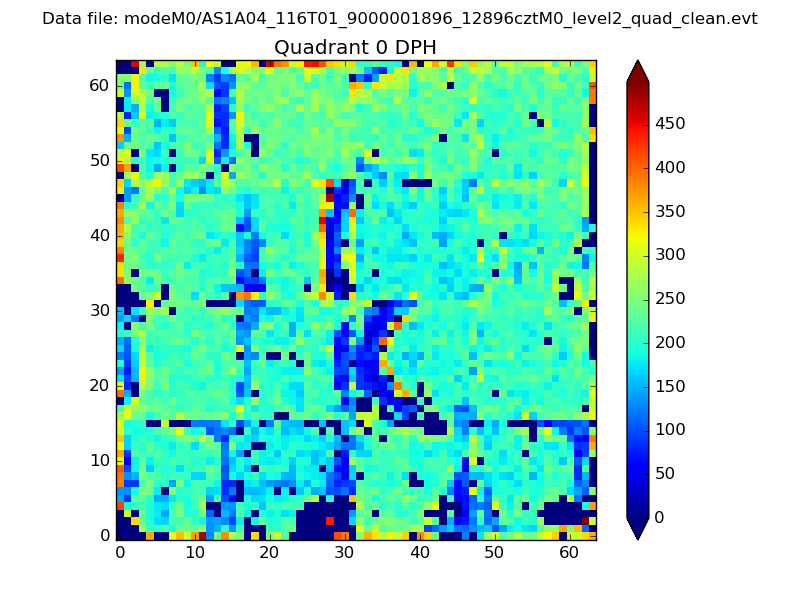 |
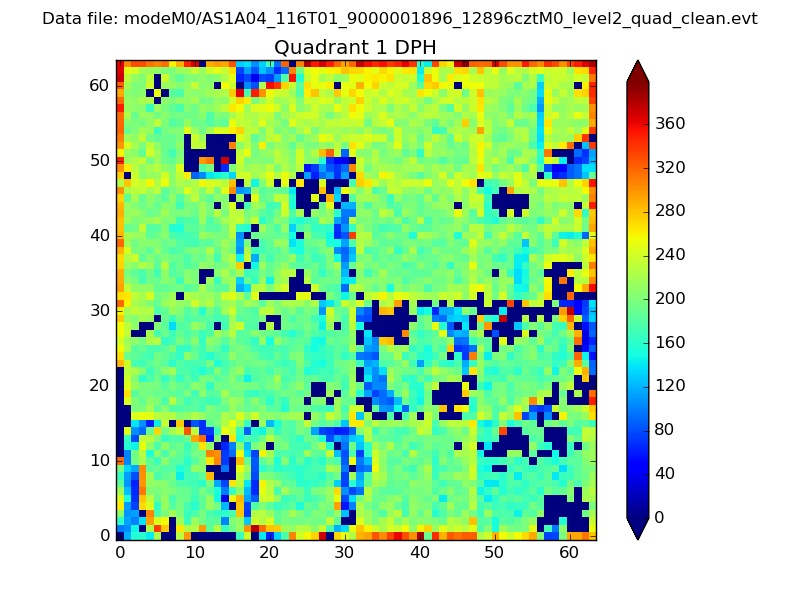 |
Quadrant B |
|---|---|---|---|
| Quadrant D | 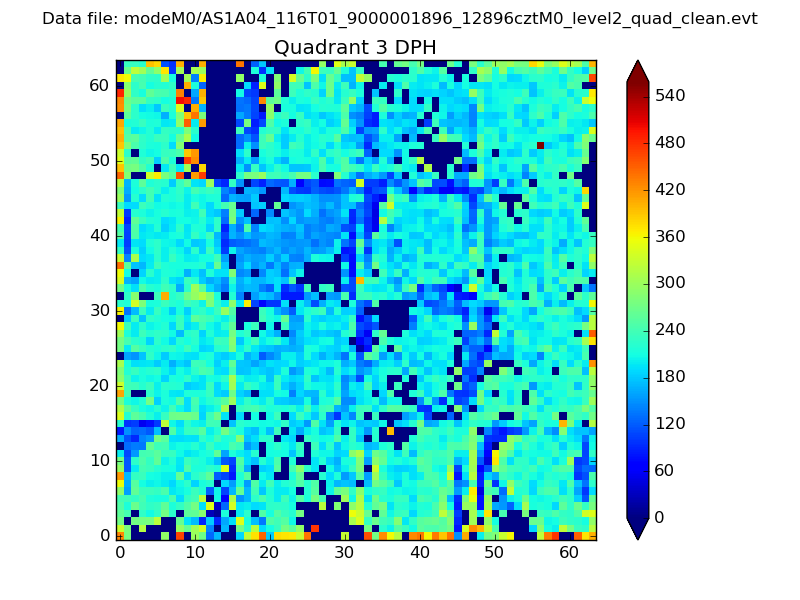 |
 |
Quadrant C |
| Plot type | Count rate plots | Images |
|---|---|---|
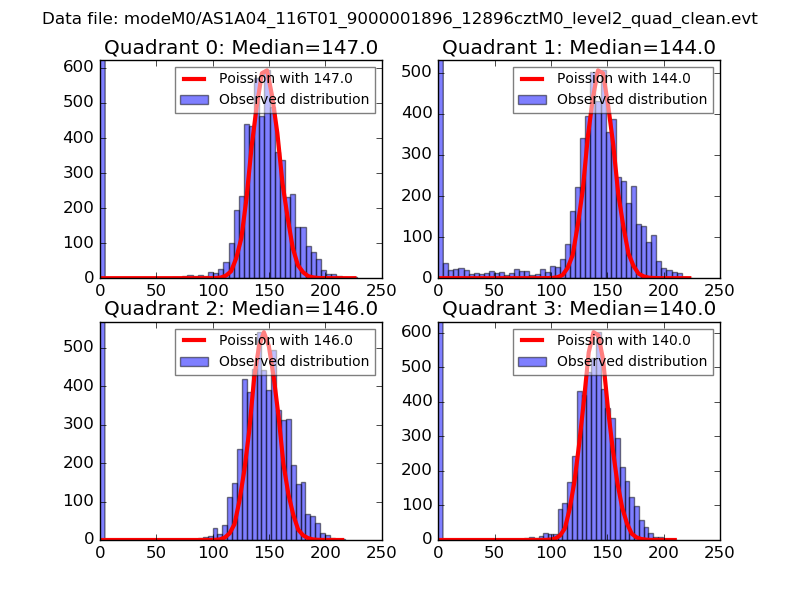
| Comparison with Poisson distribution Blue bars denote a histogram of data divided into 1 sec bins. Red curve is a Poisson curve with rate = median count rate of data. |
 |
 |
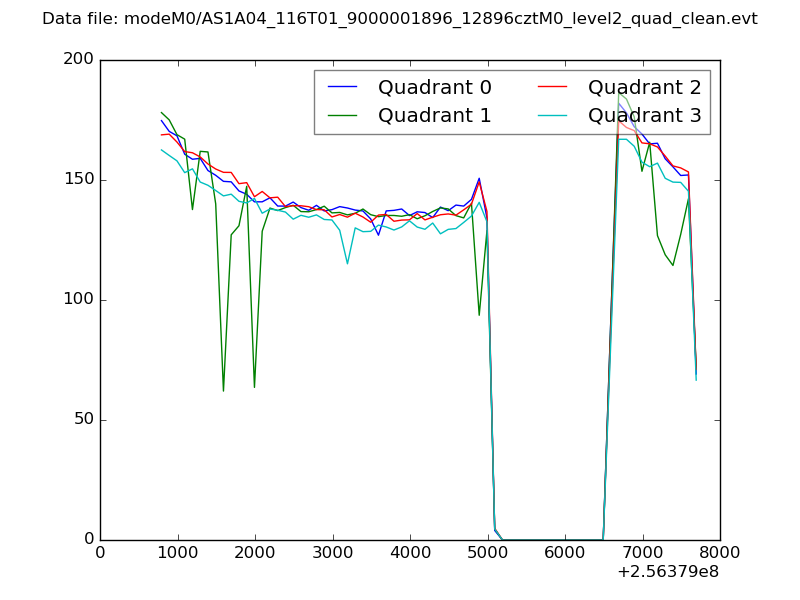
| Quadrant-wise count rates Data is divided into 100 sec bins |
 |
|
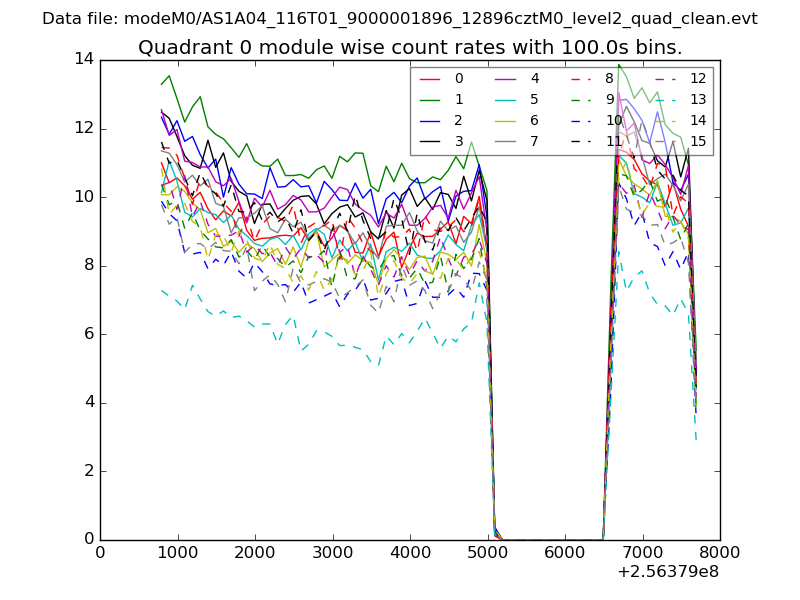
| Module-wise count rates for Quadrant A Data is divided into 100 sec bins |
 |
 |
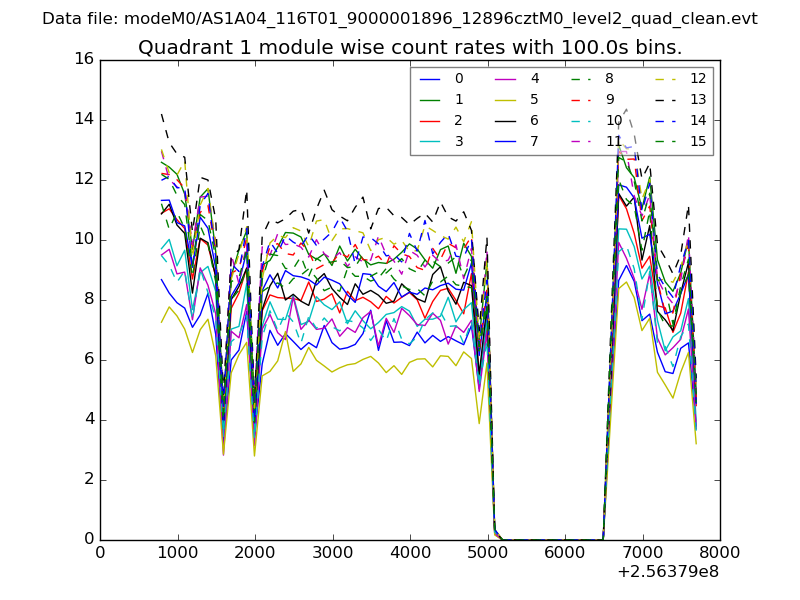
| Module-wise count rates for Quadrant B Data is divided into 100 sec bins |
 |
 |
| Module-wise count rates for Quadrant C Data is divided into 100 sec bins |
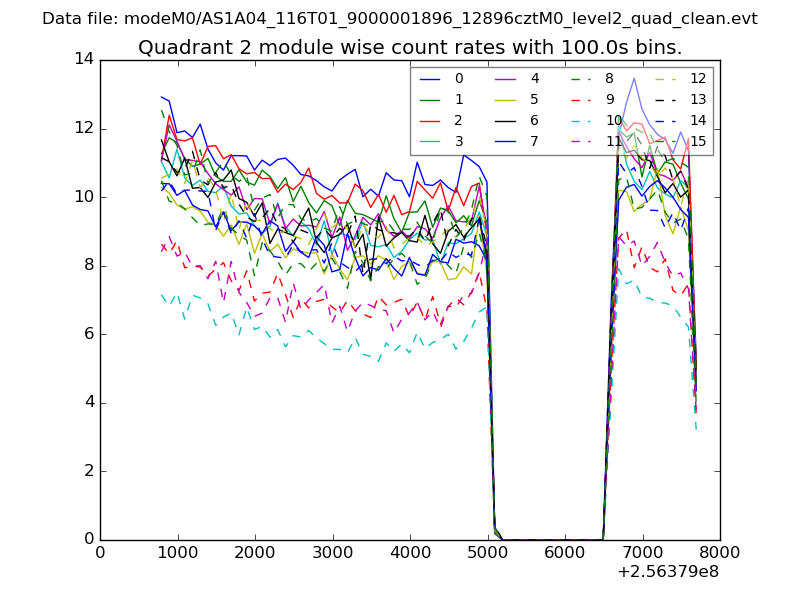 |
 |
| Module-wise count rates for Quadrant D Data is divided into 100 sec bins |
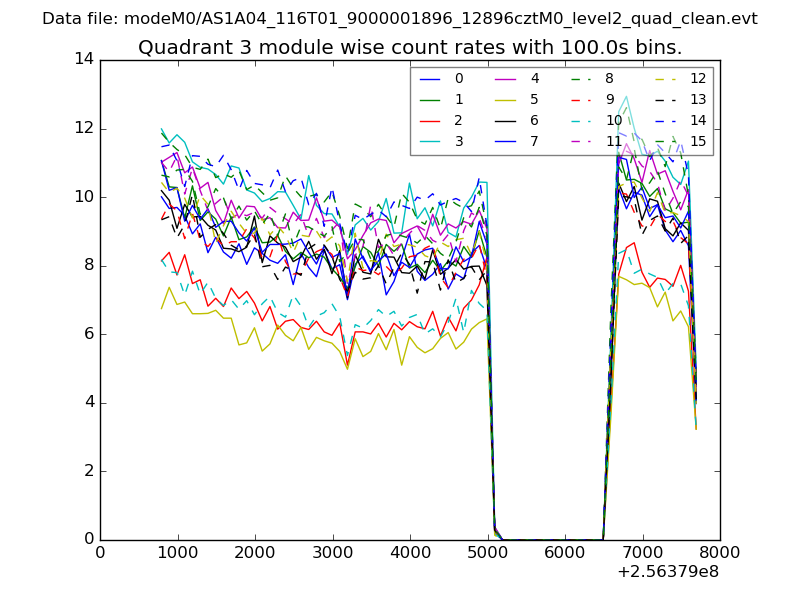 |
 |
| Parameter | Plot |
|---|---|
| CZT HV Monitor | 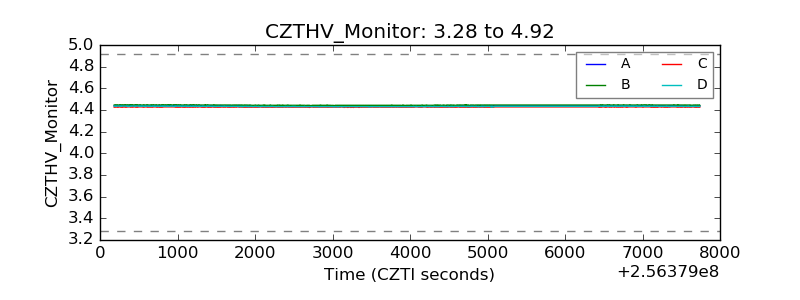 |
| D_VDD | 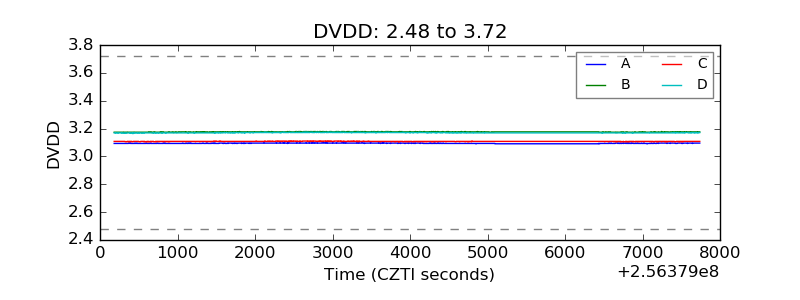 |
| Temperature 1 | 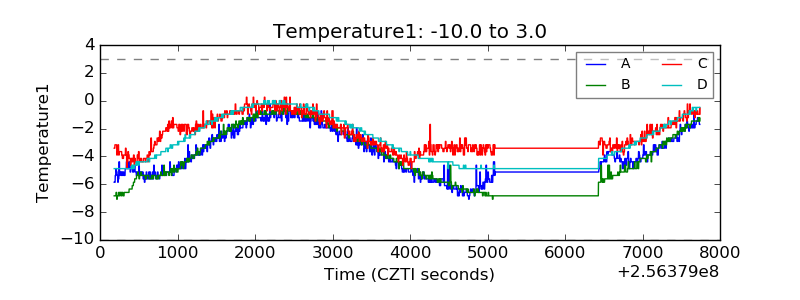 |
| Veto HV Monitor | 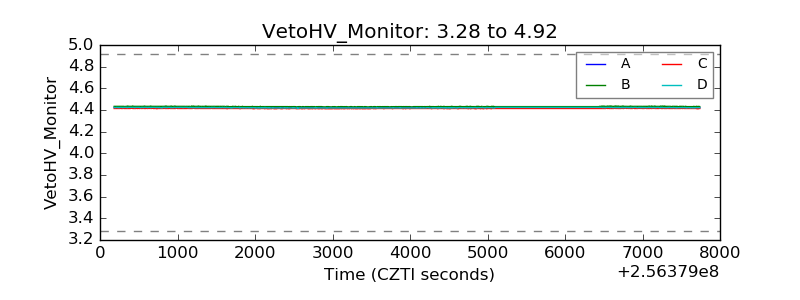 |
| Veto LLD | 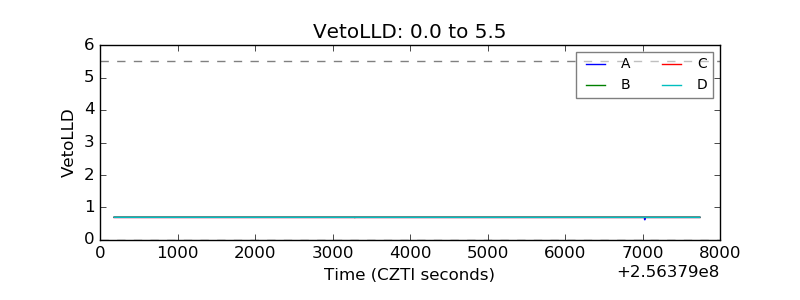 |
| Alpha Counter | 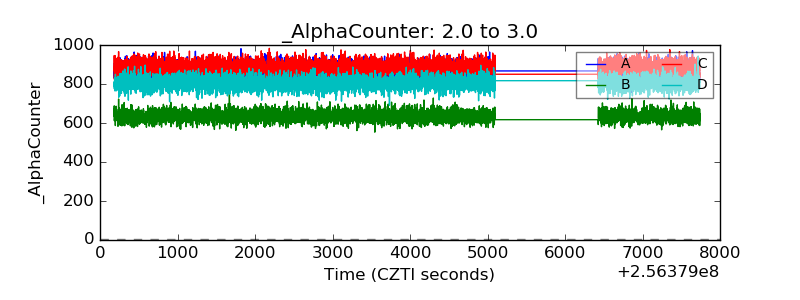 |
| _CPM_Rate | 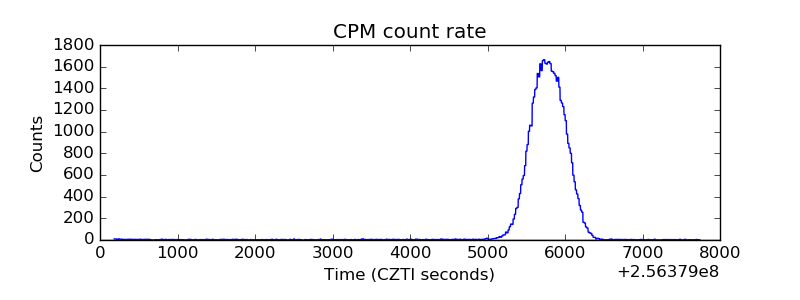 |
| CZT Counter | 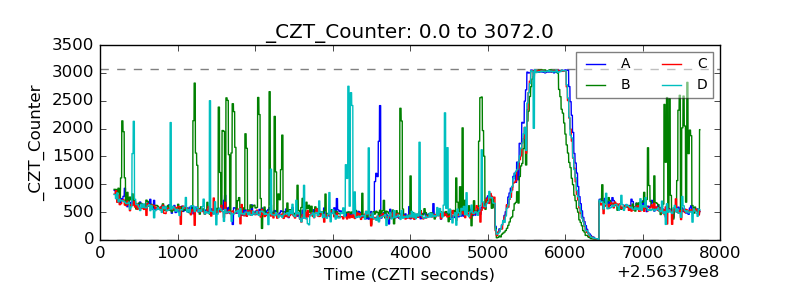 |
| +2.5 Volts monitor |  |
| +5 Volts monitor |  |
| _ROLL_ROT | 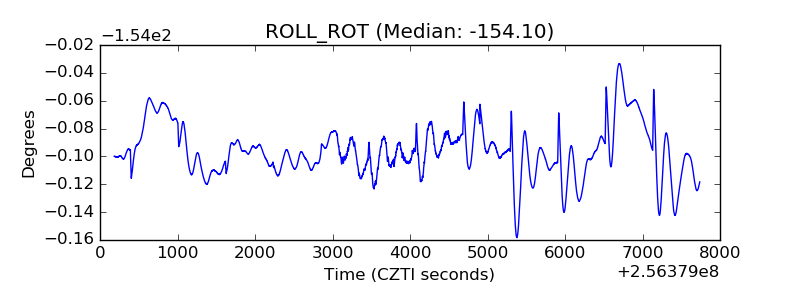 |
| _Roll_DEC | 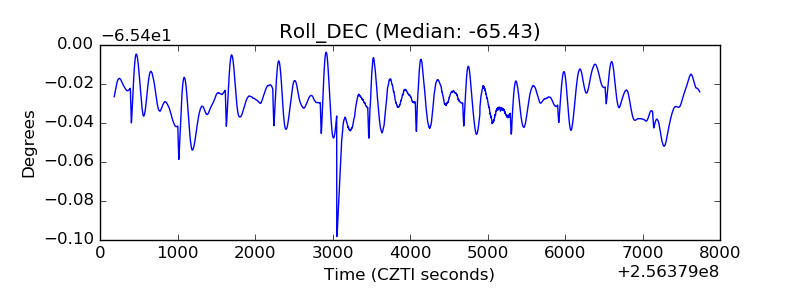 |
| _Roll_RA |  |
| Veto Counter | 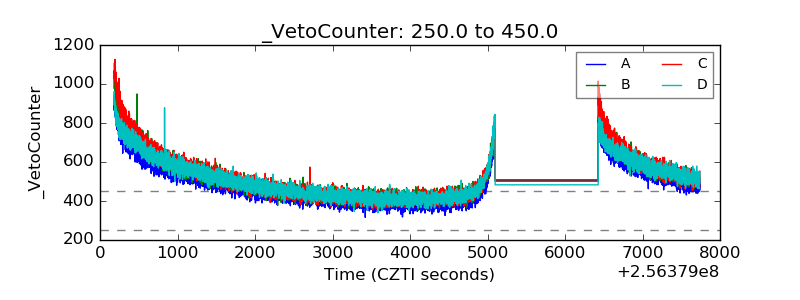 |