| Param | Original file | Final file |
|---|---|---|
| Filename | modeM0/AS1A04_116T01_9000001896_12897cztM0_level2.evt | modeM0/AS1A04_116T01_9000001896_12897cztM0_level2_quad_clean.evt |
| Size (bytes) | 512,020,800 | 134,233,920 |
| Size | 488.3 MB | 128.0 MB |
| Events in quadrant A | 3,486,193 | 927,815 |
| Events in quadrant B | 4,842,030 | 879,165 |
| Events in quadrant C | 3,224,041 | 921,009 |
| Events in quadrant D | 3,508,584 | 879,628 |
| Mode M9 | |||
|---|---|---|---|
| Quadrant | BADHDUFLAG | Total packets | Discarded packets |
| A | 0 | 13 | 0 |
| B | 0 | 13 | 0 |
| C | 0 | 13 | 0 |
| D | 0 | 14 | 0 |
| Mode SS | |||
|---|---|---|---|
| Quadrant | BADHDUFLAG | Total packets | Discarded packets |
| A | 0 | 134 | 0 |
| B | 0 | 134 | 0 |
| C | 0 | 134 | 0 |
| D | 0 | 134 | 0 |
| Mode M0 | |||
|---|---|---|---|
| Quadrant | BADHDUFLAG | Total packets | Discarded packets |
| A | 0 | 14560 | 3 |
| B | 0 | 18602 | 2 |
| C | 0 | 13857 | 2 |
| D | 0 | 14773 | 2 |
| Quadrant | Total seconds | Saturated seconds | Saturation percentage |
|---|---|---|---|
| A | 6562 | 62 | 0.944834% |
| B | 6562 | 689 | 10.499848% |
| C | 6562 | 59 | 0.899116% |
| D | 6562 | 128 | 1.950625% |
Noise dominated data is calculated using 1-second bins in cleaned event files. If a bin has >2000 counts, and if more than 50% of those come from <1% of pixels, then it is considered to be noise-dominated and hence unusable.
| Quadrant | # 1 sec bins | Bins with >0 counts | Bins with >2000 counts | High rate bins dominated by noise | Noise dominated (total time) | Noise dominated (detector-on time) | Marked lightcurve |
|---|---|---|---|---|---|---|---|
| A | 7918 | 6564 | 0 | 0 | 0.00% | 0.00% | 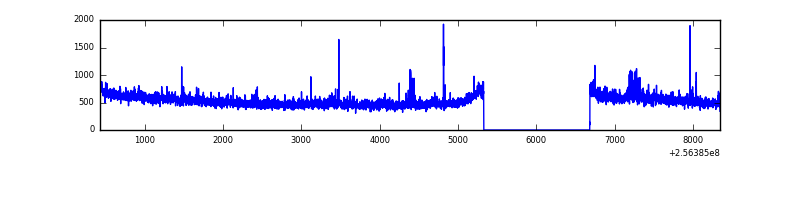 |
| B | 7918 | 6563 | 349 | 349 | 4.41% | 5.32% | 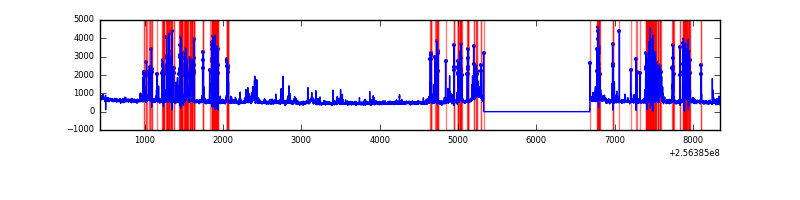 |
| C | 7918 | 6564 | 0 | 0 | 0.00% | 0.00% | 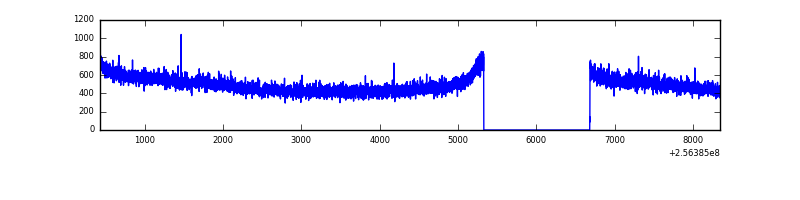 |
| D | 7918 | 6564 | 77 | 77 | 0.97% | 1.17% | 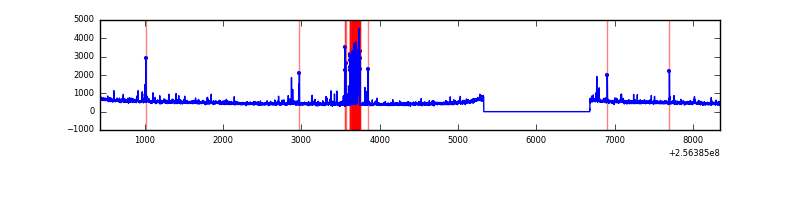 |
Top three noisy pixels from each quadrant. If the there are fewer than three noisy pixels in the level2.evt file, extra rows are filled as -1
| Pixel properties | Quadrant properties | ||||||
|---|---|---|---|---|---|---|---|
| Quadrant | DetID | PixID | Counts | Sigma | Mean | Median | Sigma |
| A | 1 | 162 | 42759 | 246.53 | 855 | 840 | 170.0 |
| A | 15 | 222 | 31540 | 180.55 | 855 | 840 | 170.0 |
| A | 13 | 248 | 29628 | 169.3 | 855 | 840 | 170.0 |
| B | 4 | 239 | 1434599 | 9795.4 | 800 | 782 | 146.4 |
| B | 3 | 209 | 94073 | 637.34 | 800 | 782 | 146.4 |
| B | 0 | 85 | 58326 | 393.12 | 800 | 782 | 146.4 |
| C | 4 | 112 | 20397 | 105.88 | 821 | 826 | 184.8 |
| C | 13 | 61 | 6055 | 28.29 | 821 | 826 | 184.8 |
| C | 12 | 4 | 2345 | 8.22 | 821 | 826 | 184.8 |
| D | 1 | 52 | 277305 | 1440.54 | 820 | 798 | 191.9 |
| D | 2 | 234 | 26943 | 136.21 | 820 | 798 | 191.9 |
| D | 10 | 253 | 26396 | 133.36 | 820 | 798 | 191.9 |
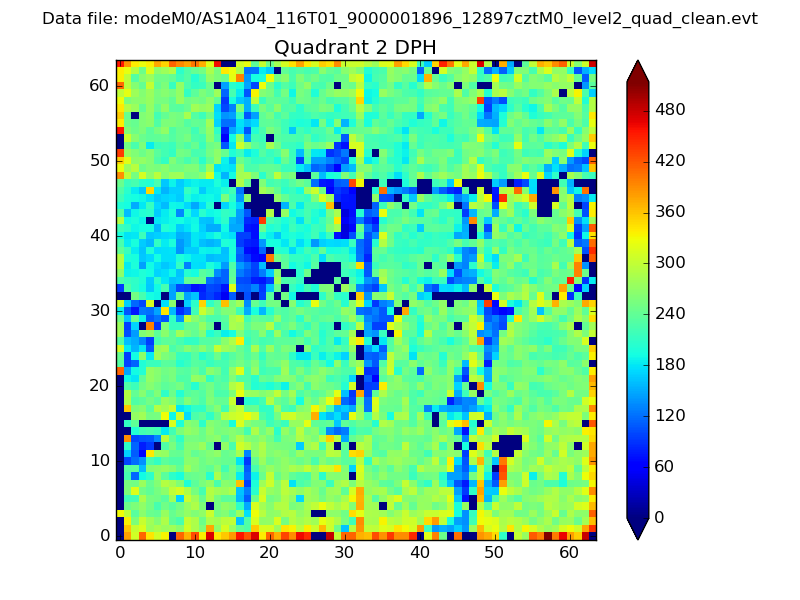
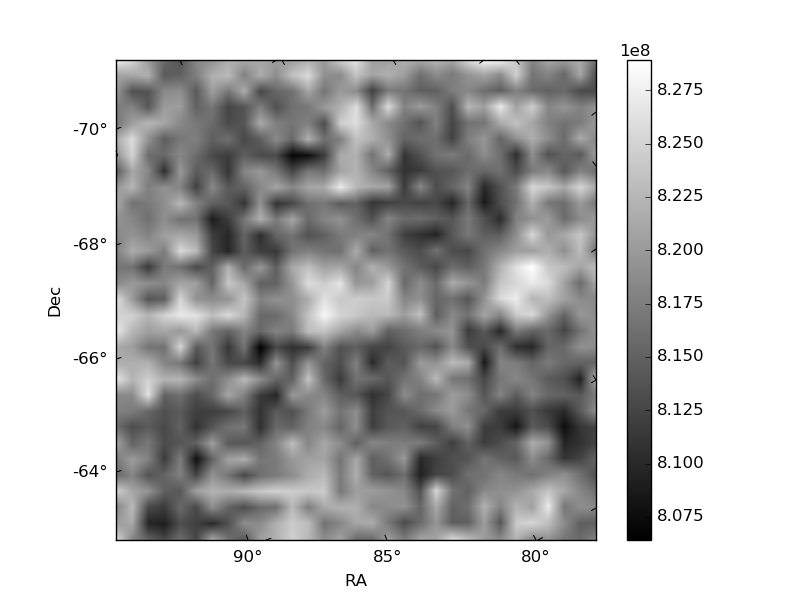
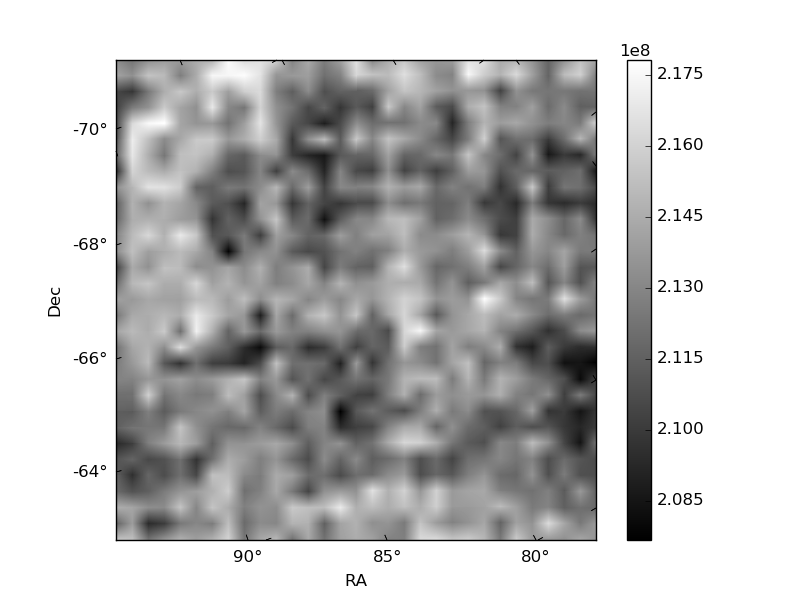
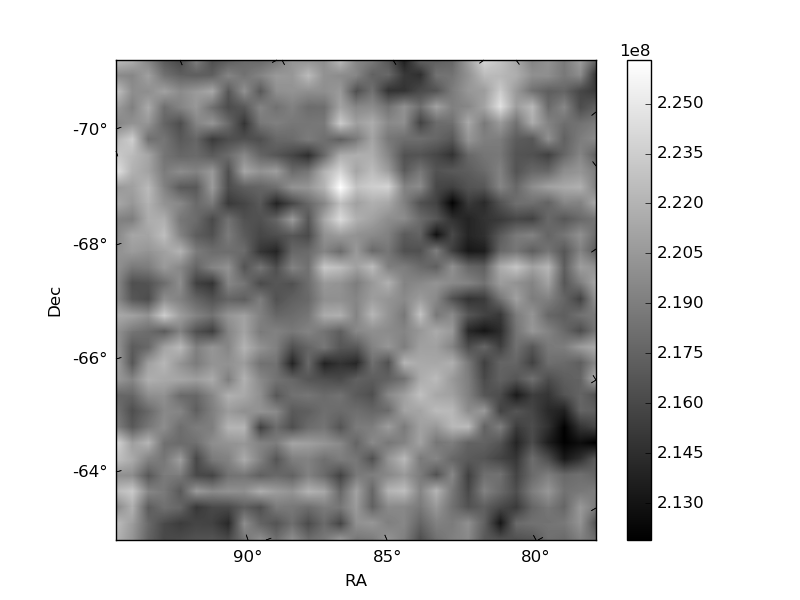
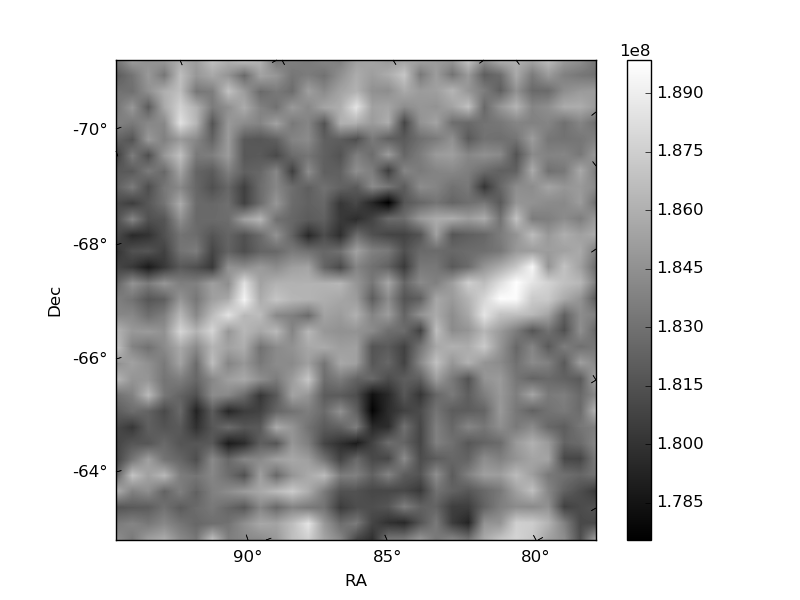
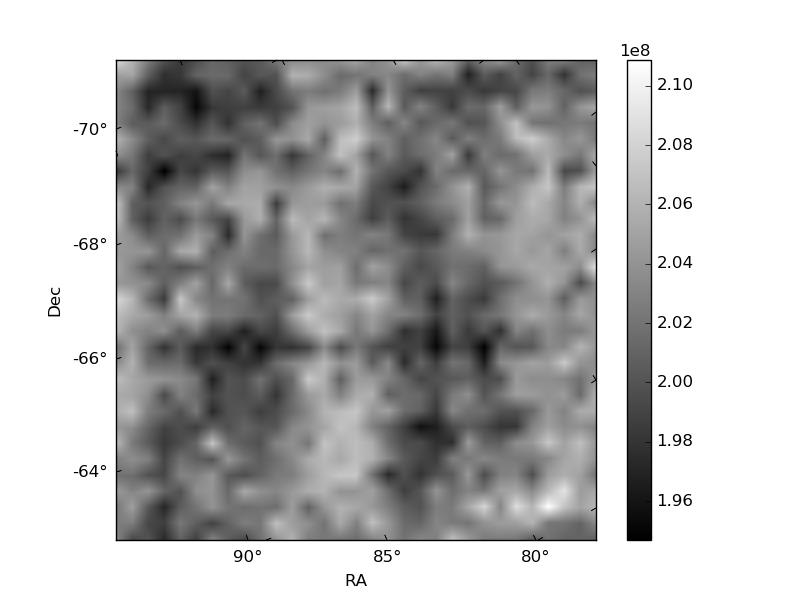
Histogram calculated using DETX and DETY for each event in the final _common_clean file
| Quadrant A | 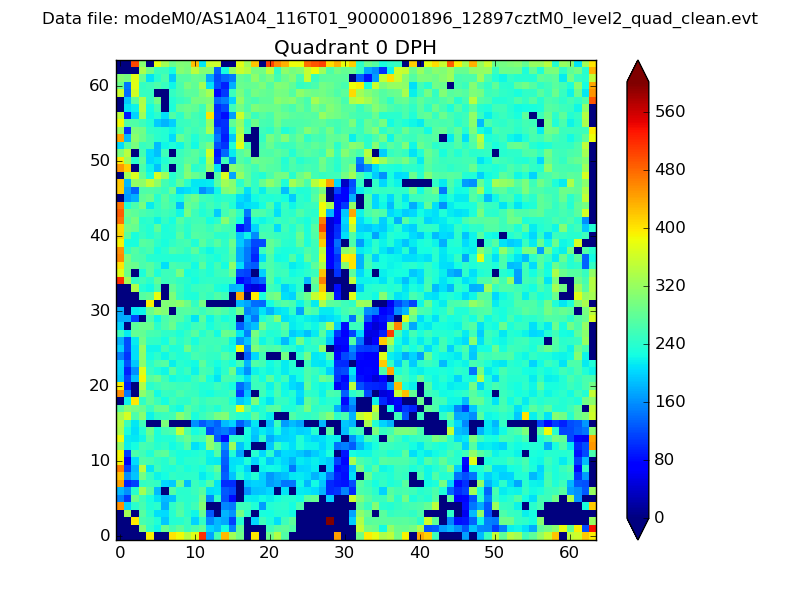 |
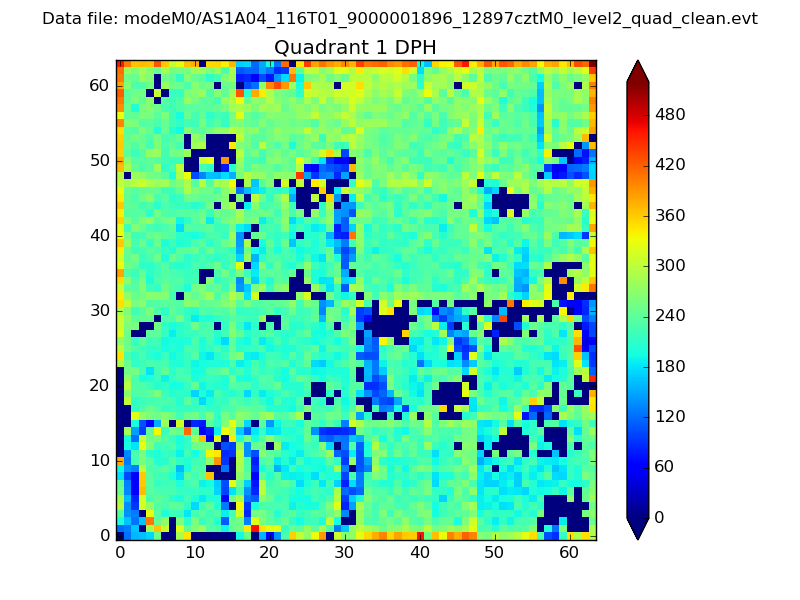 |
Quadrant B |
|---|---|---|---|
| Quadrant D | 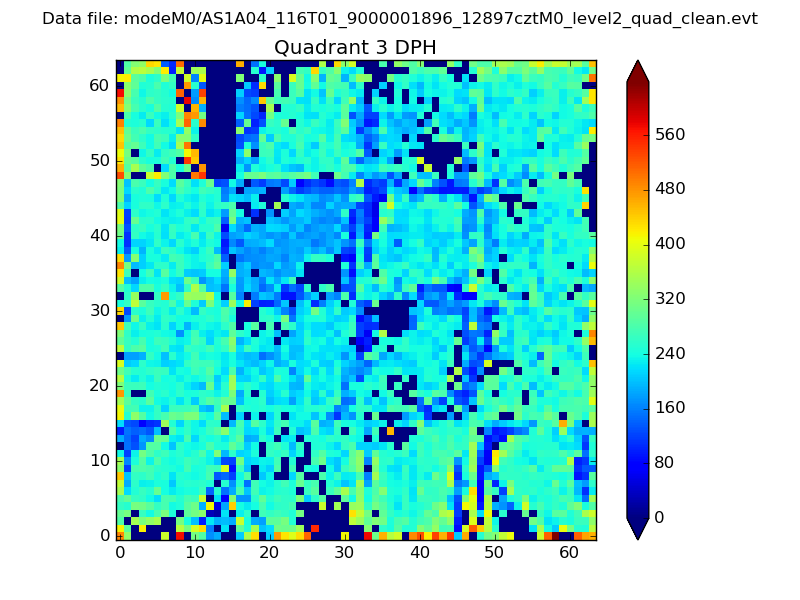 |
 |
Quadrant C |
| Plot type | Count rate plots | Images |
|---|---|---|
| Comparison with Poisson distribution Blue bars denote a histogram of data divided into 1 sec bins. Red curve is a Poisson curve with rate = median count rate of data. |
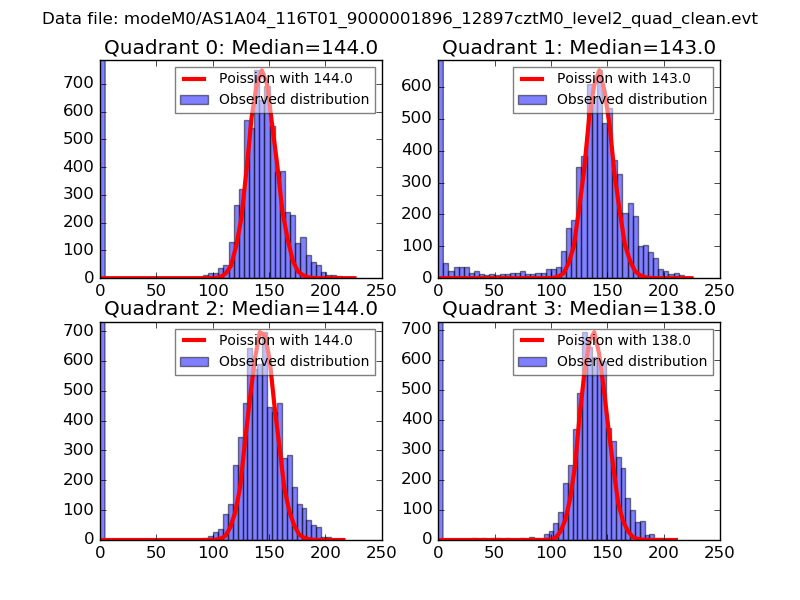 |
 |
| Quadrant-wise count rates Data is divided into 100 sec bins |
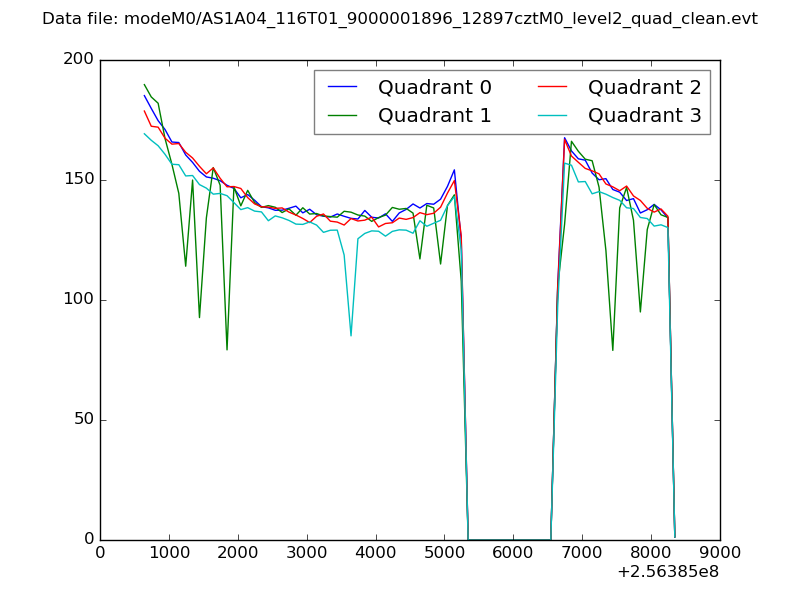 |
|
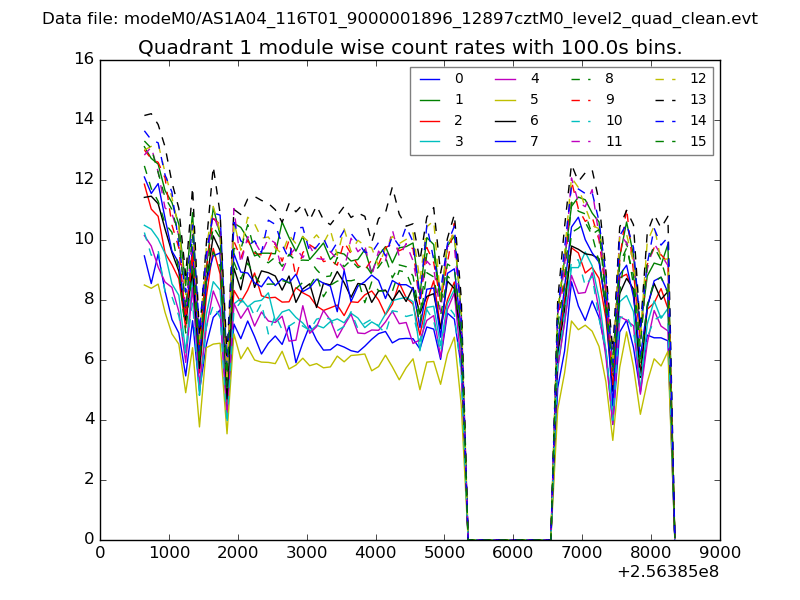
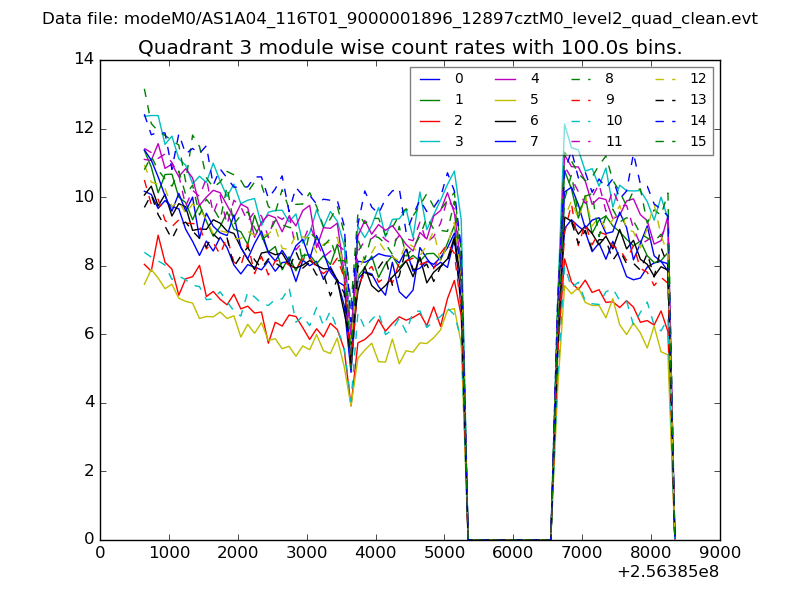
| Module-wise count rates for Quadrant A Data is divided into 100 sec bins |
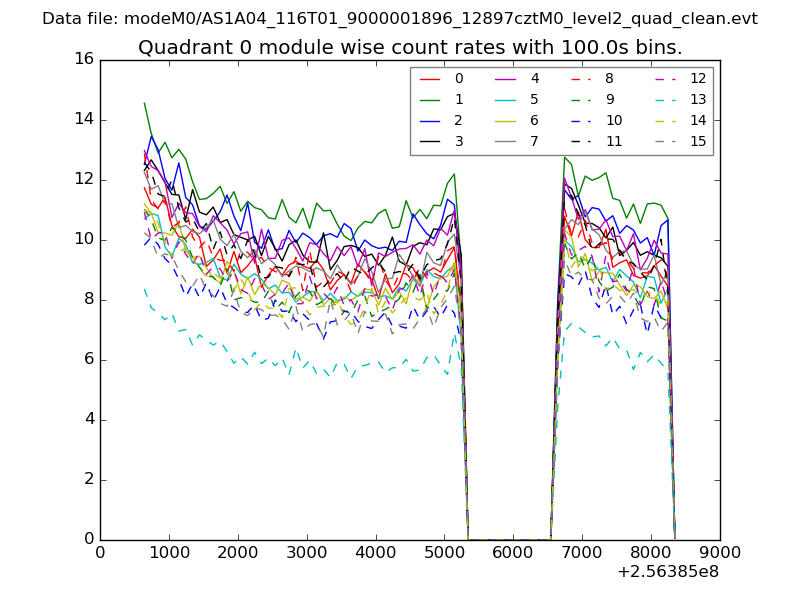 |
 |
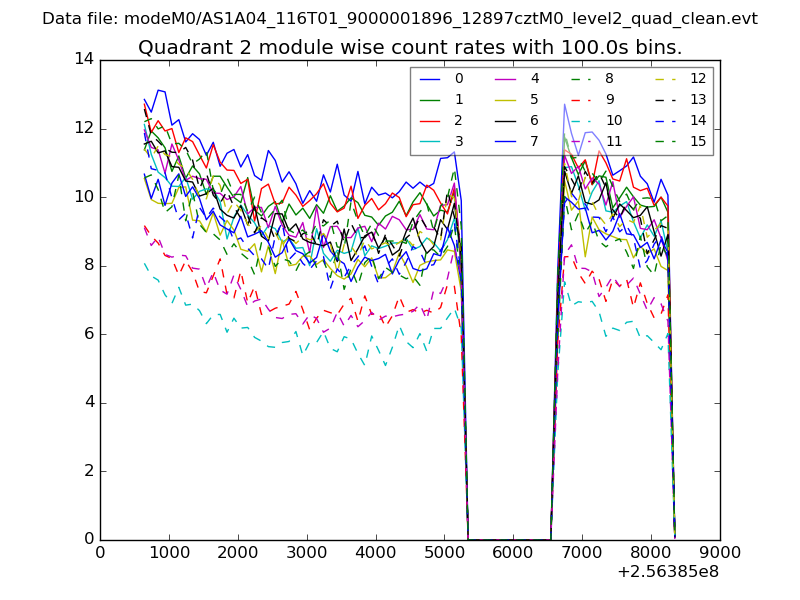
| Module-wise count rates for Quadrant B Data is divided into 100 sec bins |
 |
 |
| Module-wise count rates for Quadrant C Data is divided into 100 sec bins |
 |
 |
| Module-wise count rates for Quadrant D Data is divided into 100 sec bins |
 |
 |
| Parameter | Plot |
|---|---|
| CZT HV Monitor | 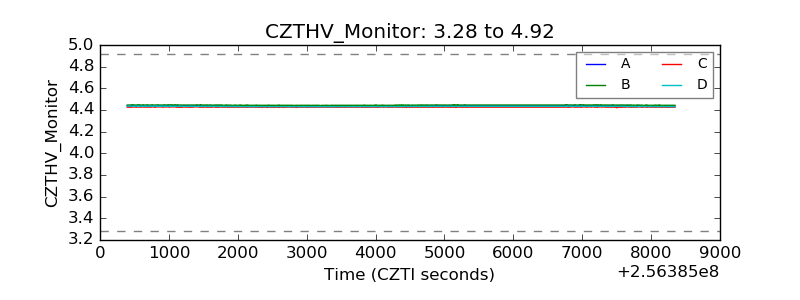 |
| D_VDD | 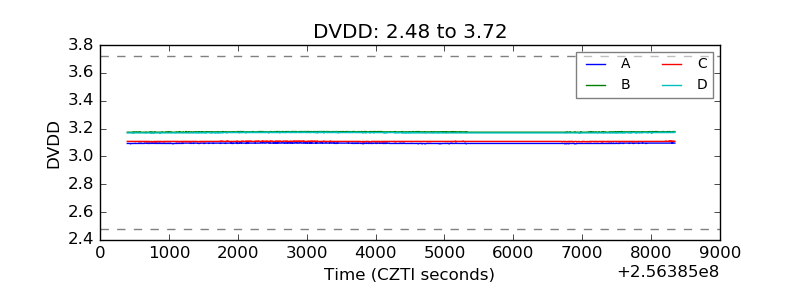 |
| Temperature 1 | 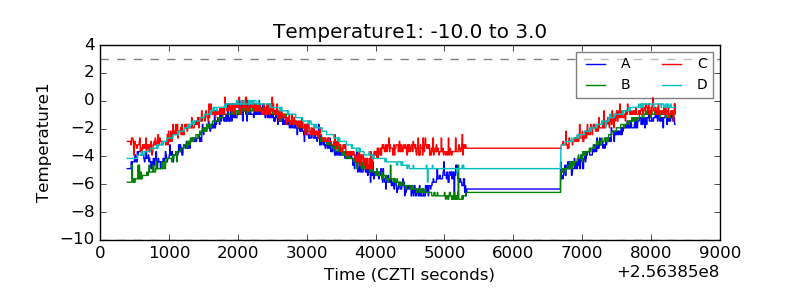 |
| Veto HV Monitor | 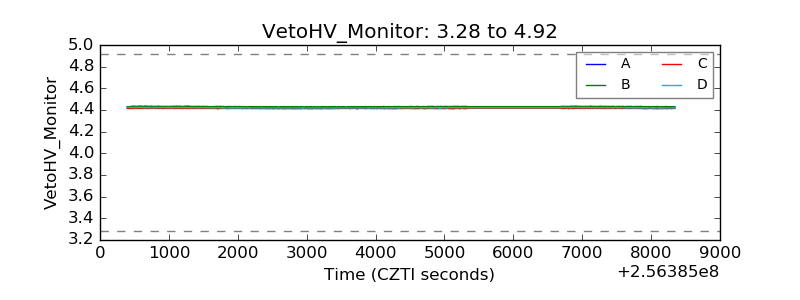 |
| Veto LLD | 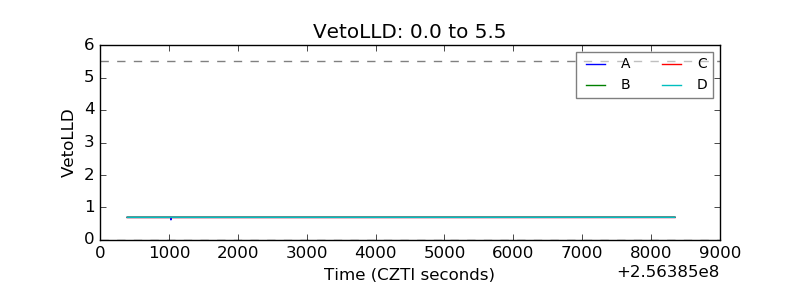 |
| Alpha Counter | 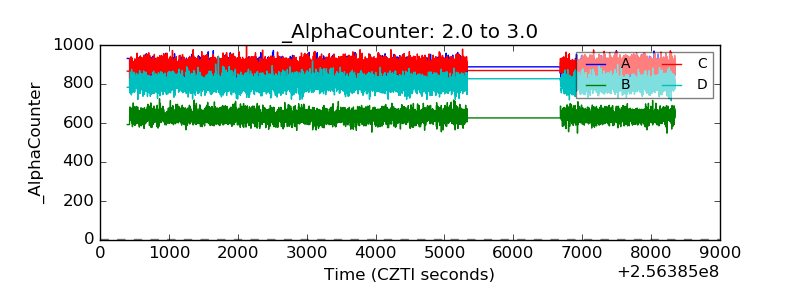 |
| _CPM_Rate | 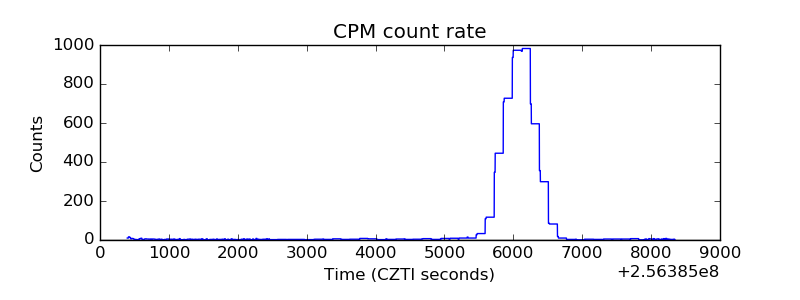 |
| CZT Counter | 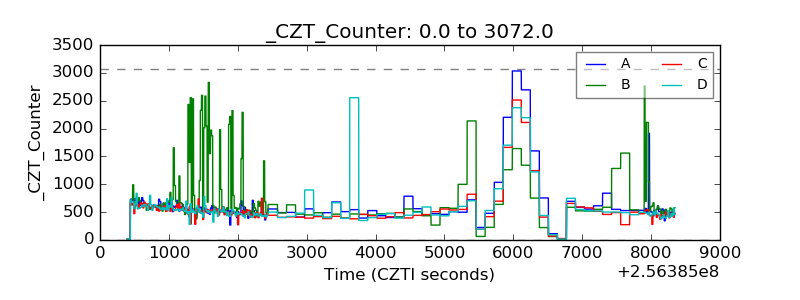 |
| +2.5 Volts monitor |  |
| +5 Volts monitor |  |
| _ROLL_ROT | 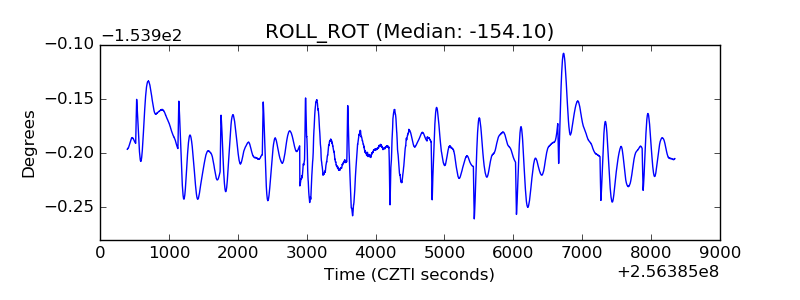 |
| _Roll_DEC | 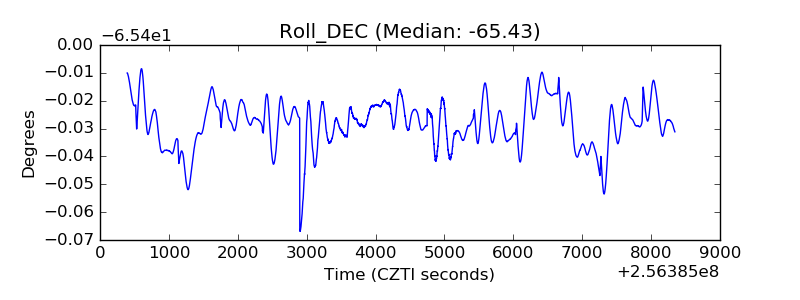 |
| _Roll_RA | 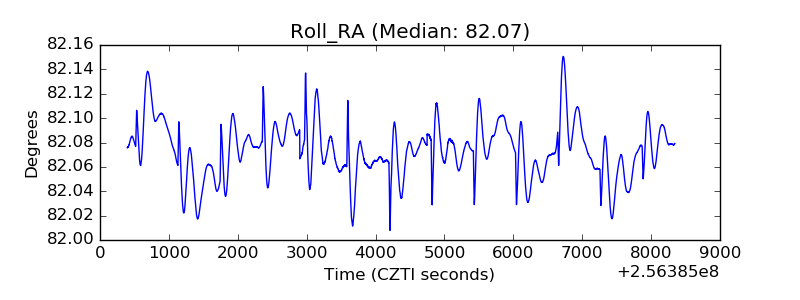 |
| Veto Counter | 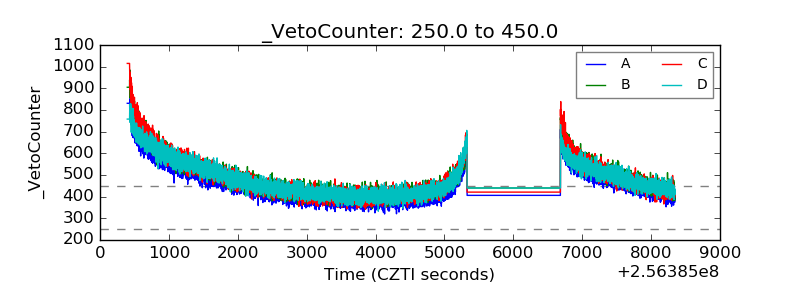 |