| Param | Original file | Final file |
|---|---|---|
| Filename | modeM0/AS1A04_116T01_9000001896_12900cztM0_level2.evt | modeM0/AS1A04_116T01_9000001896_12900cztM0_level2_quad_clean.evt |
| Size (bytes) | 566,881,920 | 115,588,800 |
| Size | 540.6 MB | 110.2 MB |
| Events in quadrant A | 3,463,666 | 782,315 |
| Events in quadrant B | 4,884,527 | 738,489 |
| Events in quadrant C | 3,096,820 | 778,349 |
| Events in quadrant D | 5,242,929 | 708,450 |
| Mode M9 | |||
|---|---|---|---|
| Quadrant | BADHDUFLAG | Total packets | Discarded packets |
| A | 0 | 4 | 0 |
| B | 0 | 4 | 0 |
| C | 0 | 4 | 0 |
| D | 0 | 4 | 0 |
| Mode SS | |||
|---|---|---|---|
| Quadrant | BADHDUFLAG | Total packets | Discarded packets |
| A | 0 | 142 | 0 |
| B | 0 | 142 | 0 |
| C | 0 | 142 | 0 |
| D | 0 | 142 | 0 |
| Mode M0 | |||
|---|---|---|---|
| Quadrant | BADHDUFLAG | Total packets | Discarded packets |
| A | 0 | 14772 | 2 |
| B | 0 | 19144 | 1 |
| C | 0 | 14390 | 1 |
| D | 0 | 20506 | 1 |
| Quadrant | Total seconds | Saturated seconds | Saturation percentage |
|---|---|---|---|
| A | 7081 | 32 | 0.451914% |
| B | 7081 | 625 | 8.826437% |
| C | 7081 | 5 | 0.070611% |
| D | 7081 | 584 | 8.247423% |
Noise dominated data is calculated using 1-second bins in cleaned event files. If a bin has >2000 counts, and if more than 50% of those come from <1% of pixels, then it is considered to be noise-dominated and hence unusable.
| Quadrant | # 1 sec bins | Bins with >0 counts | Bins with >2000 counts | High rate bins dominated by noise | Noise dominated (total time) | Noise dominated (detector-on time) | Marked lightcurve |
|---|---|---|---|---|---|---|---|
| A | 7412 | 7083 | 1 | 1 | 0.01% | 0.01% | 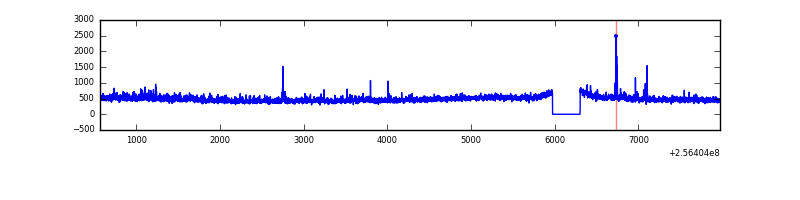 |
| B | 7412 | 7083 | 334 | 334 | 4.51% | 4.72% | 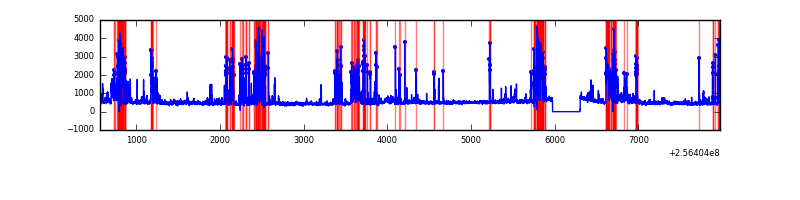 |
| C | 7412 | 7083 | 0 | 0 | 0.00% | 0.00% | 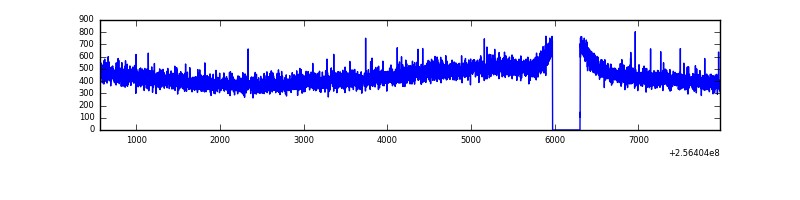 |
| D | 7412 | 7083 | 522 | 522 | 7.04% | 7.37% | 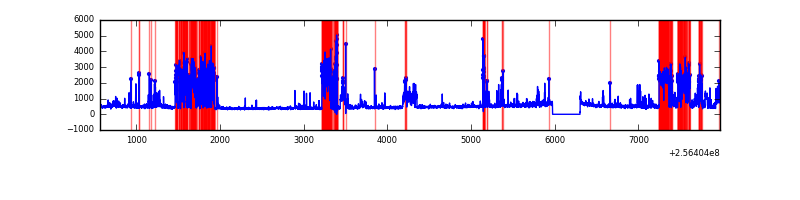 |
Top three noisy pixels from each quadrant. If the there are fewer than three noisy pixels in the level2.evt file, extra rows are filled as -1
| Pixel properties | Quadrant properties | ||||||
|---|---|---|---|---|---|---|---|
| Quadrant | DetID | PixID | Counts | Sigma | Mean | Median | Sigma |
| A | 1 | 162 | 84981 | 497.95 | 827 | 811 | 169.0 |
| A | 8 | 15 | 54988 | 320.51 | 827 | 811 | 169.0 |
| A | 1 | 178 | 44689 | 259.58 | 827 | 811 | 169.0 |
| B | 4 | 239 | 1348148 | 9131.5 | 785 | 765 | 147.6 |
| B | 0 | 85 | 315395 | 2132.31 | 785 | 765 | 147.6 |
| B | 3 | 209 | 70601 | 473.29 | 785 | 765 | 147.6 |
| C | 13 | 61 | 5940 | 28.24 | 793 | 796 | 182.1 |
| C | 8 | 222 | 2238 | 7.92 | 793 | 796 | 182.1 |
| C | 3 | 202 | 1956 | 6.37 | 793 | 796 | 182.1 |
| D | 1 | 52 | 936420 | 5110.72 | 765 | 743 | 183.1 |
| D | 4 | 95 | 594945 | 3245.56 | 765 | 743 | 183.1 |
| D | 9 | 85 | 521066 | 2842.03 | 765 | 743 | 183.1 |
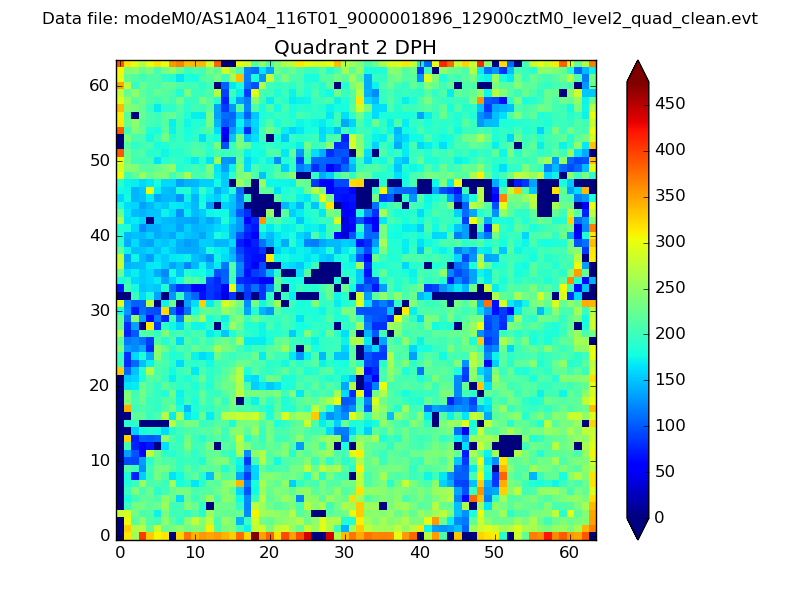
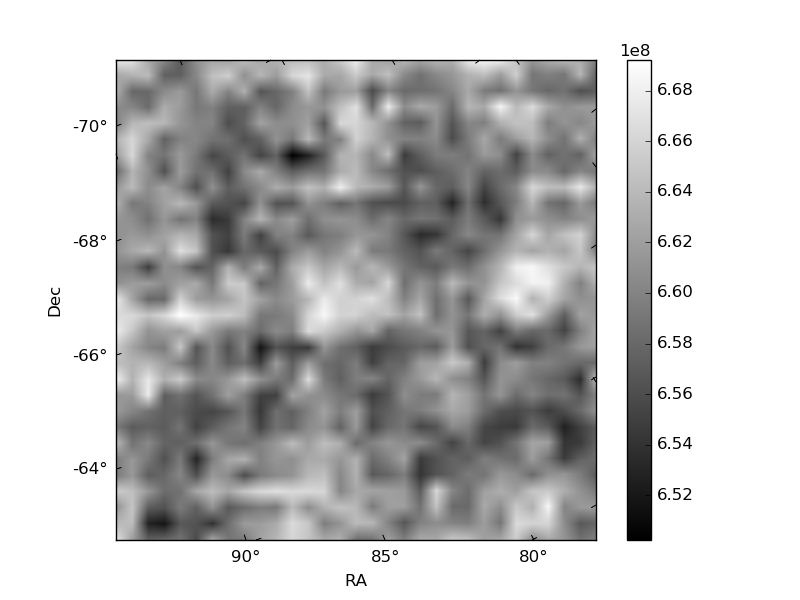
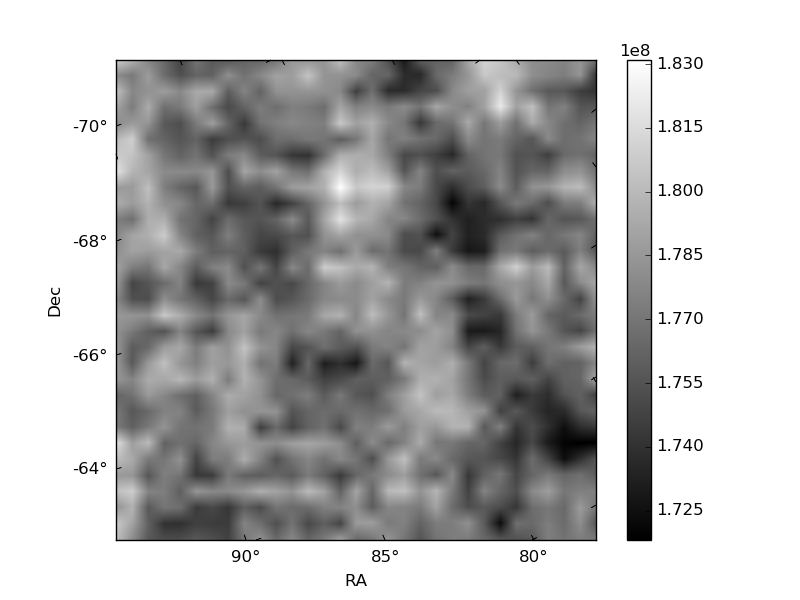
Histogram calculated using DETX and DETY for each event in the final _common_clean file
| Quadrant A | 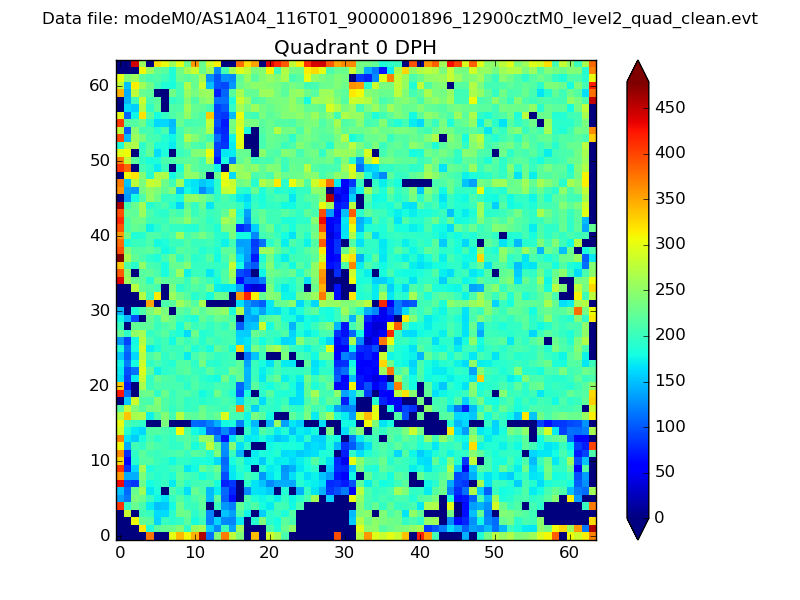 |
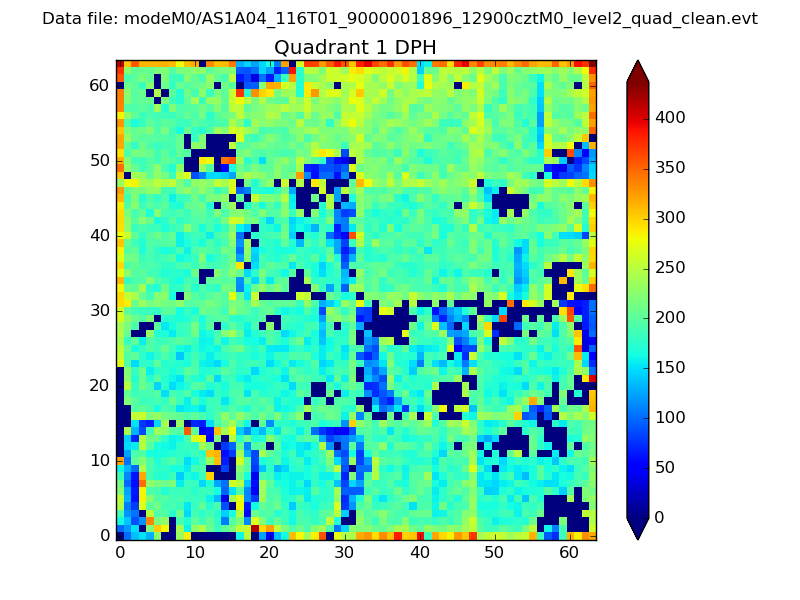 |
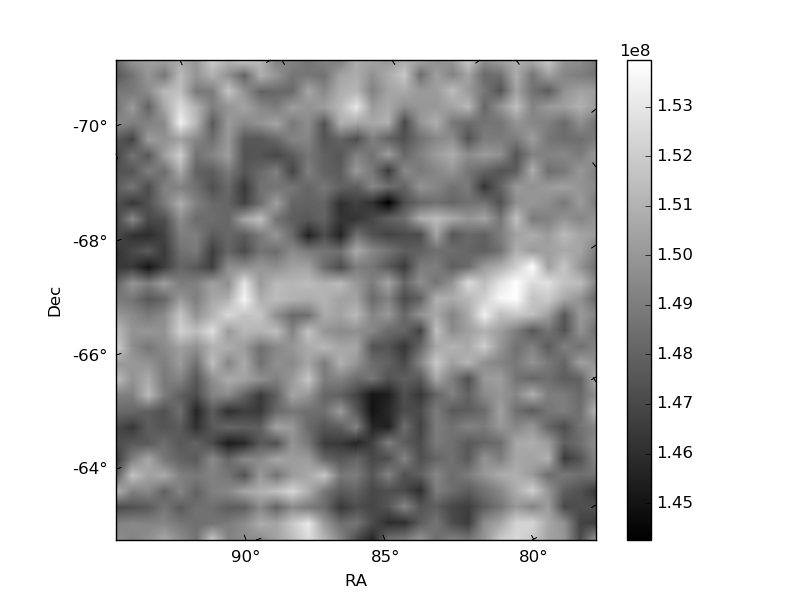
Quadrant B |
|---|---|---|---|
| Quadrant D | 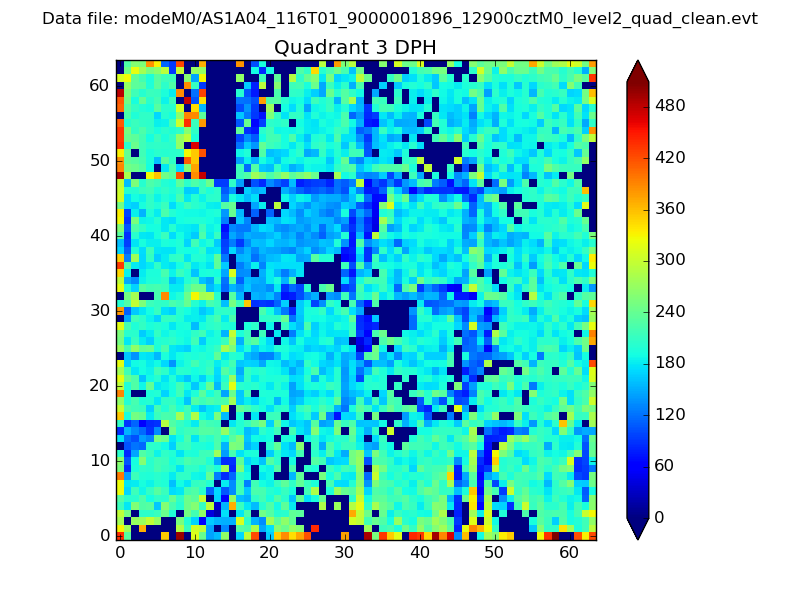 |
 |
Quadrant C |
| Plot type | Count rate plots | Images |
|---|---|---|
| Comparison with Poisson distribution Blue bars denote a histogram of data divided into 1 sec bins. Red curve is a Poisson curve with rate = median count rate of data. |
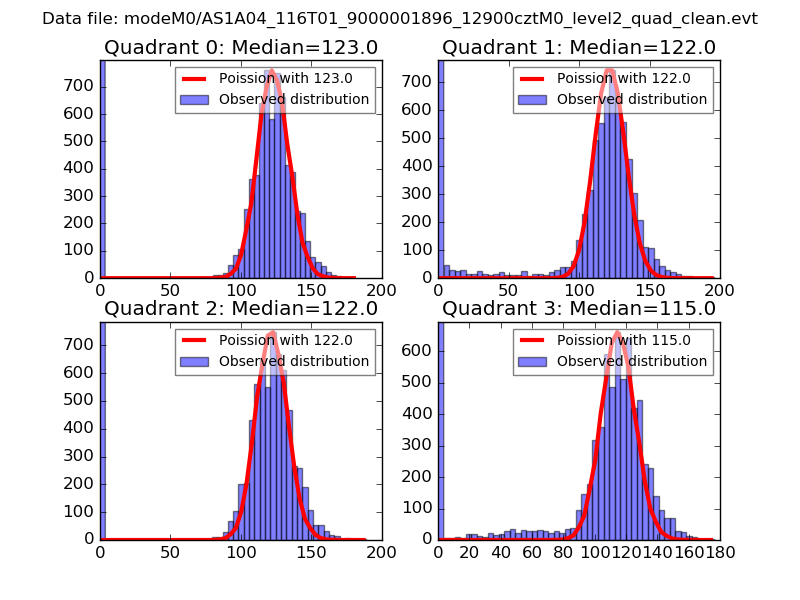 |
 |
| Quadrant-wise count rates Data is divided into 100 sec bins |
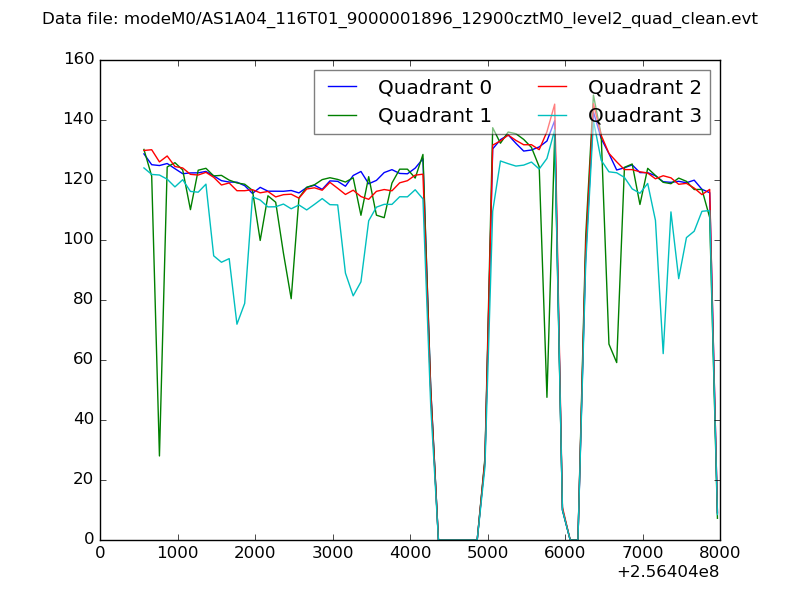 |
|
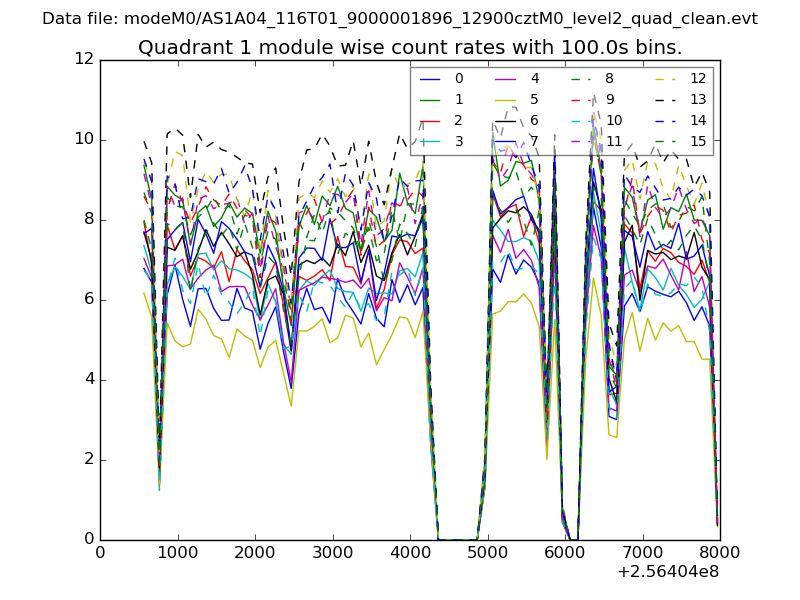
| Module-wise count rates for Quadrant A Data is divided into 100 sec bins |
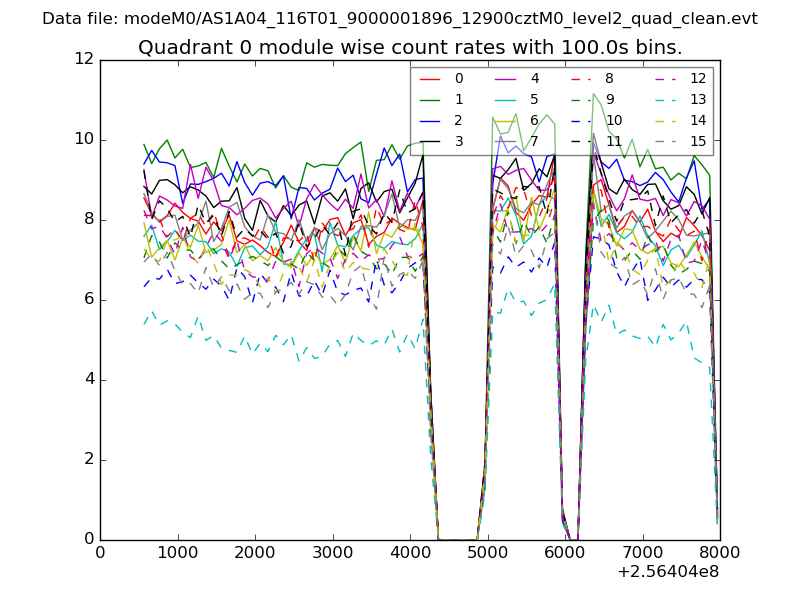 |
 |
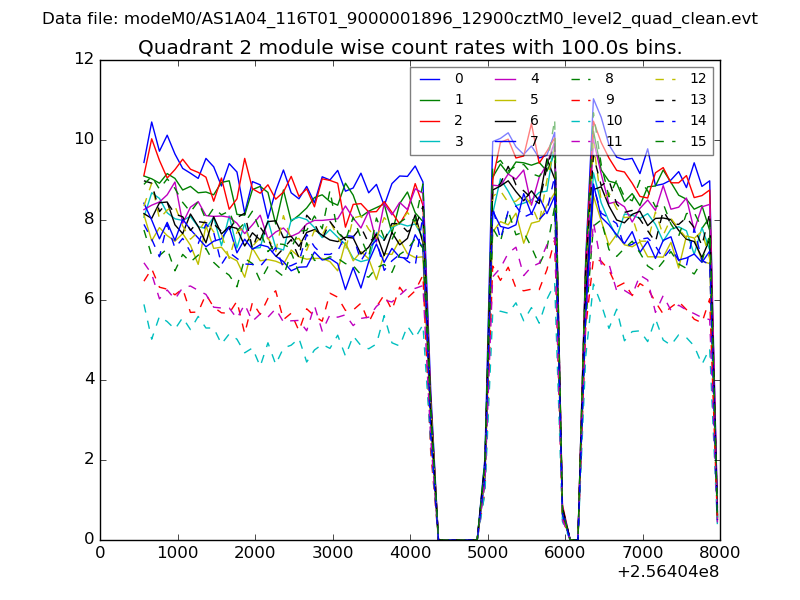
| Module-wise count rates for Quadrant B Data is divided into 100 sec bins |
 |
 |
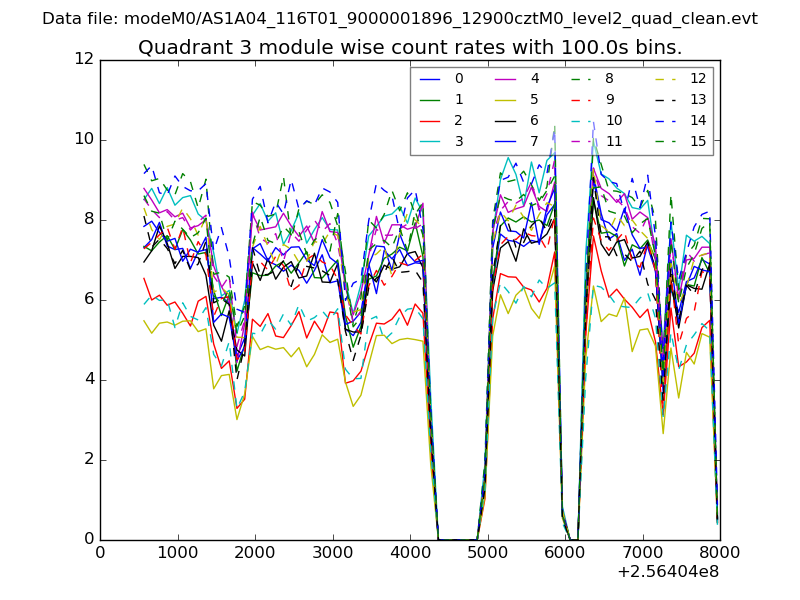
| Module-wise count rates for Quadrant C Data is divided into 100 sec bins |
 |
 |
| Module-wise count rates for Quadrant D Data is divided into 100 sec bins |
 |
 |
| Parameter | Plot |
|---|---|
| CZT HV Monitor | 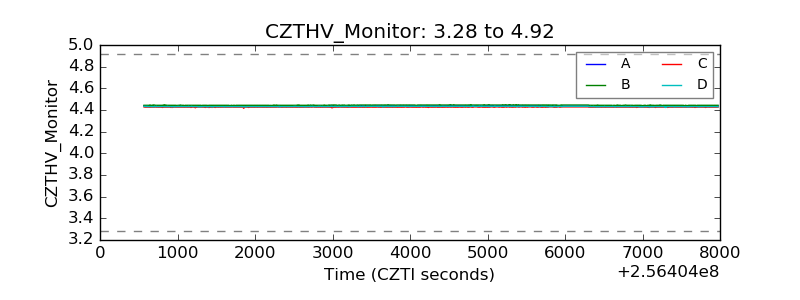 |
| D_VDD | 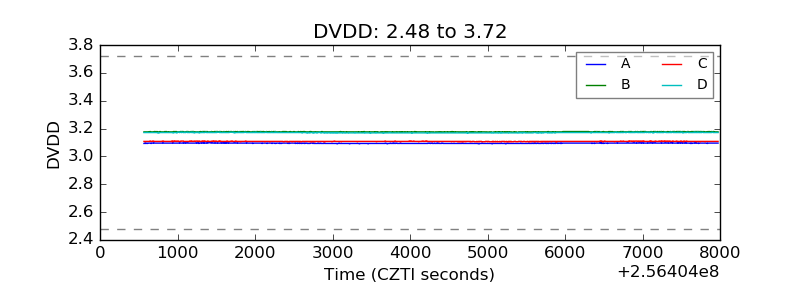 |
| Temperature 1 | 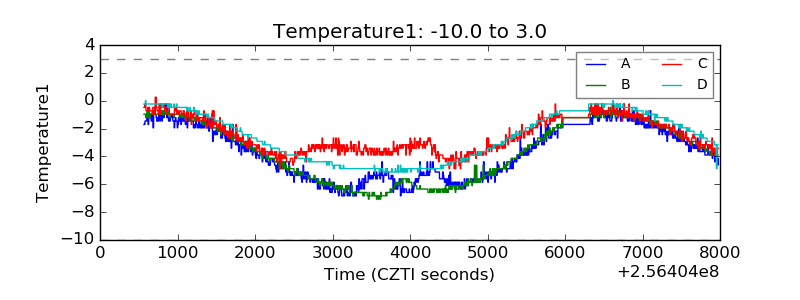 |
| Veto HV Monitor | 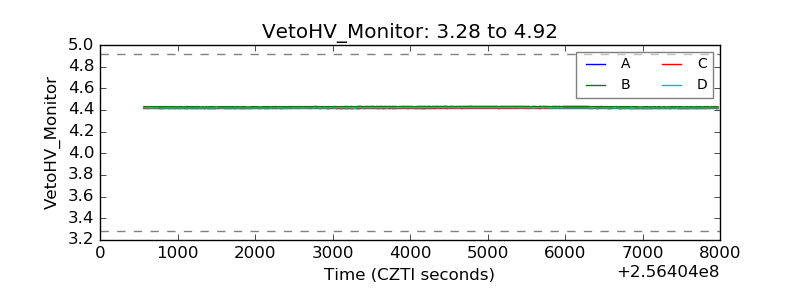 |
| Veto LLD | 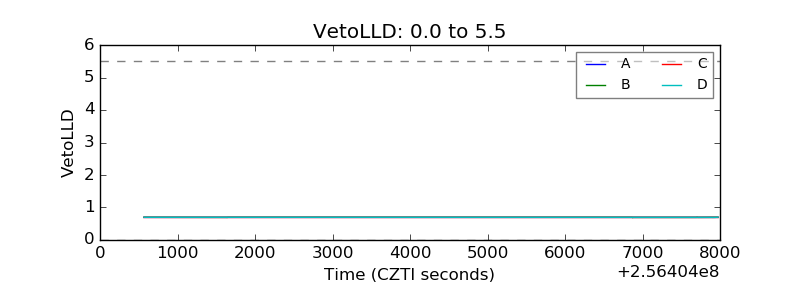 |
| Alpha Counter | 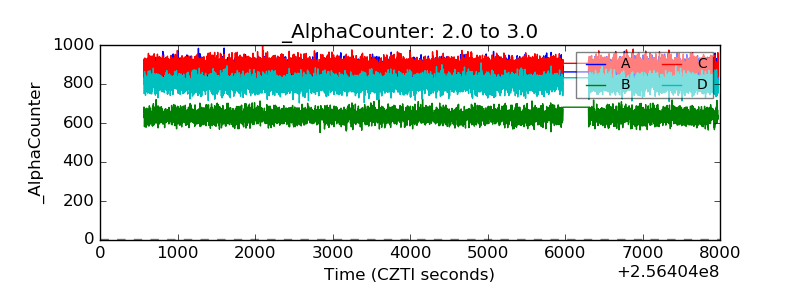 |
| _CPM_Rate | 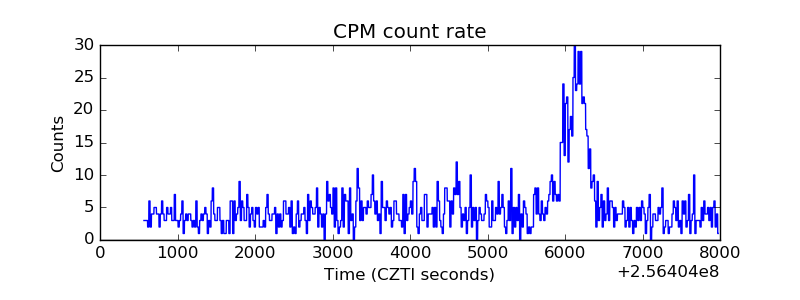 |
| CZT Counter | 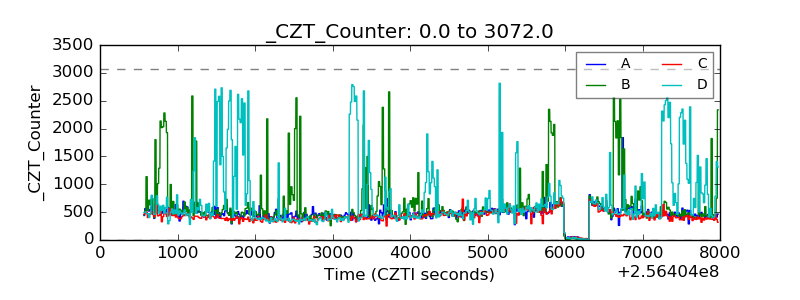 |
| +2.5 Volts monitor |  |
| +5 Volts monitor |  |
| _ROLL_ROT | 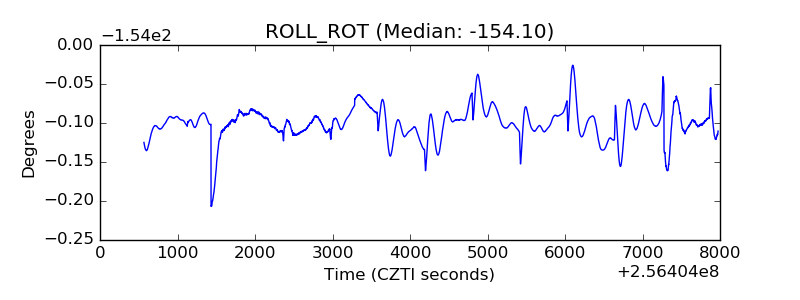 |
| _Roll_DEC | 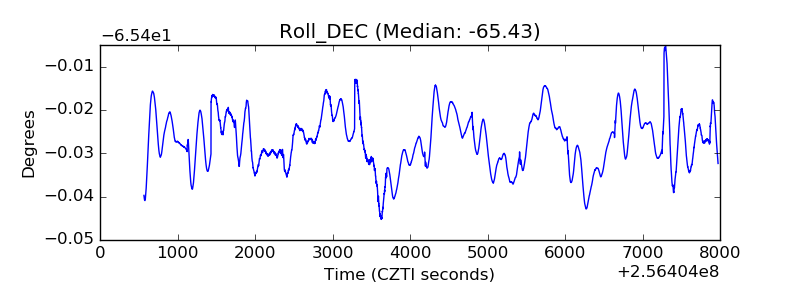 |
| _Roll_RA | 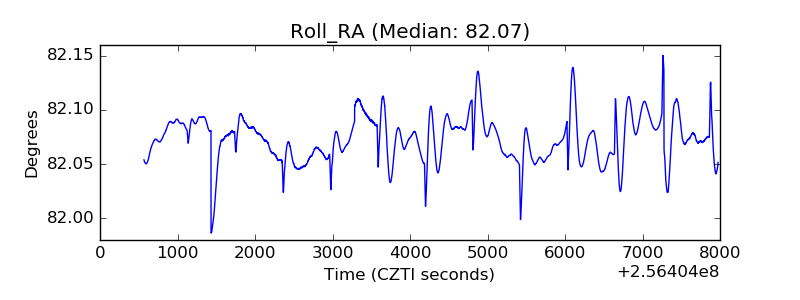 |
| Veto Counter | 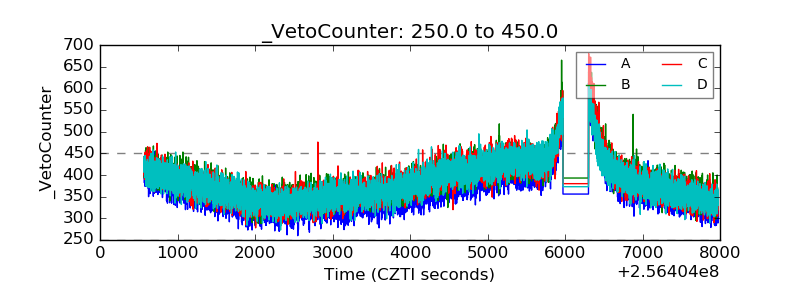 |