| Param | Original file | Final file |
|---|---|---|
| Filename | modeM0/AS1A04_116T01_9000001896_12901cztM0_level2.evt | modeM0/AS1A04_116T01_9000001896_12901cztM0_level2_quad_clean.evt |
| Size (bytes) | 629,256,960 | 123,137,280 |
| Size | 600.1 MB | 117.4 MB |
| Events in quadrant A | 3,802,552 | 838,405 |
| Events in quadrant B | 5,794,648 | 752,837 |
| Events in quadrant C | 3,346,101 | 833,165 |
| Events in quadrant D | 5,599,615 | 776,840 |
| Mode SS | |||
|---|---|---|---|
| Quadrant | BADHDUFLAG | Total packets | Discarded packets |
| A | 0 | 154 | 0 |
| B | 0 | 154 | 0 |
| C | 0 | 154 | 0 |
| D | 0 | 154 | 0 |
| Mode M0 | |||
|---|---|---|---|
| Quadrant | BADHDUFLAG | Total packets | Discarded packets |
| A | 0 | 16271 | 2 |
| B | 0 | 22209 | 1 |
| C | 0 | 15450 | 1 |
| D | 0 | 21767 | 1 |
| Quadrant | Total seconds | Saturated seconds | Saturation percentage |
|---|---|---|---|
| A | 7576 | 68 | 0.897571% |
| B | 7576 | 1136 | 14.994720% |
| C | 7576 | 16 | 0.211193% |
| D | 7576 | 404 | 5.332629% |
Noise dominated data is calculated using 1-second bins in cleaned event files. If a bin has >2000 counts, and if more than 50% of those come from <1% of pixels, then it is considered to be noise-dominated and hence unusable.
| Quadrant | # 1 sec bins | Bins with >0 counts | Bins with >2000 counts | High rate bins dominated by noise | Noise dominated (total time) | Noise dominated (detector-on time) | Marked lightcurve |
|---|---|---|---|---|---|---|---|
| A | 7632 | 7578 | 2 | 2 | 0.03% | 0.03% | 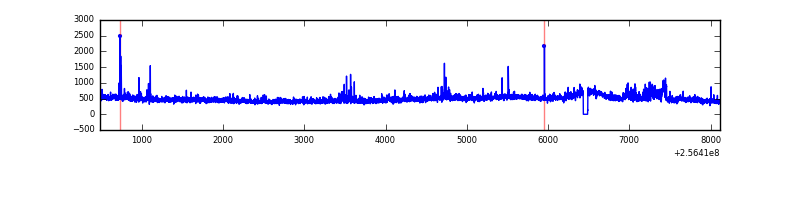 |
| B | 7632 | 7578 | 535 | 535 | 7.01% | 7.06% | 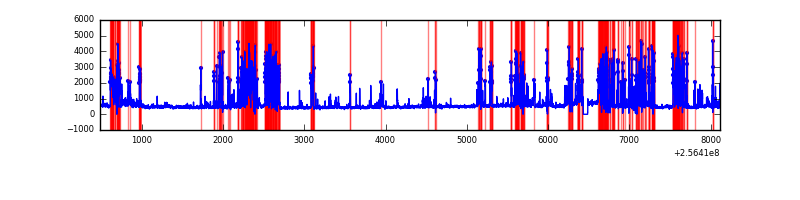 |
| C | 7632 | 7578 | 0 | 0 | 0.00% | 0.00% | 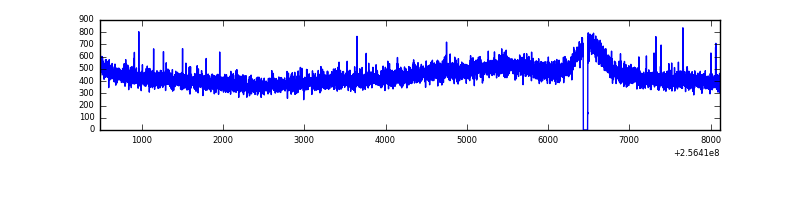 |
| D | 7632 | 7578 | 346 | 346 | 4.53% | 4.57% | 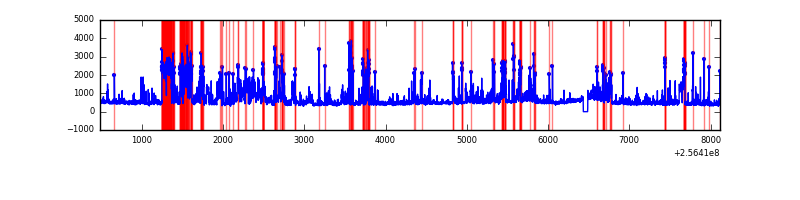 |
Top three noisy pixels from each quadrant. If the there are fewer than three noisy pixels in the level2.evt file, extra rows are filled as -1
| Pixel properties | Quadrant properties | ||||||
|---|---|---|---|---|---|---|---|
| Quadrant | DetID | PixID | Counts | Sigma | Mean | Median | Sigma |
| A | 12 | 189 | 121677 | 667.58 | 890 | 868 | 181.0 |
| A | 1 | 162 | 73733 | 402.65 | 890 | 868 | 181.0 |
| A | 15 | 174 | 48967 | 265.79 | 890 | 868 | 181.0 |
| B | 4 | 239 | 2254938 | 14796.77 | 809 | 789 | 152.3 |
| B | 0 | 85 | 133348 | 870.15 | 809 | 789 | 152.3 |
| B | 3 | 64 | 118360 | 771.76 | 809 | 789 | 152.3 |
| C | 13 | 61 | 6297 | 27.59 | 856 | 858 | 197.1 |
| C | 12 | 4 | 3306 | 12.42 | 856 | 858 | 197.1 |
| C | 8 | 128 | 3140 | 11.57 | 856 | 858 | 197.1 |
| D | 1 | 52 | 1237914 | 6139.8 | 837 | 811 | 201.5 |
| D | 9 | 85 | 513397 | 2543.99 | 837 | 811 | 201.5 |
| D | 8 | 195 | 194397 | 960.78 | 837 | 811 | 201.5 |
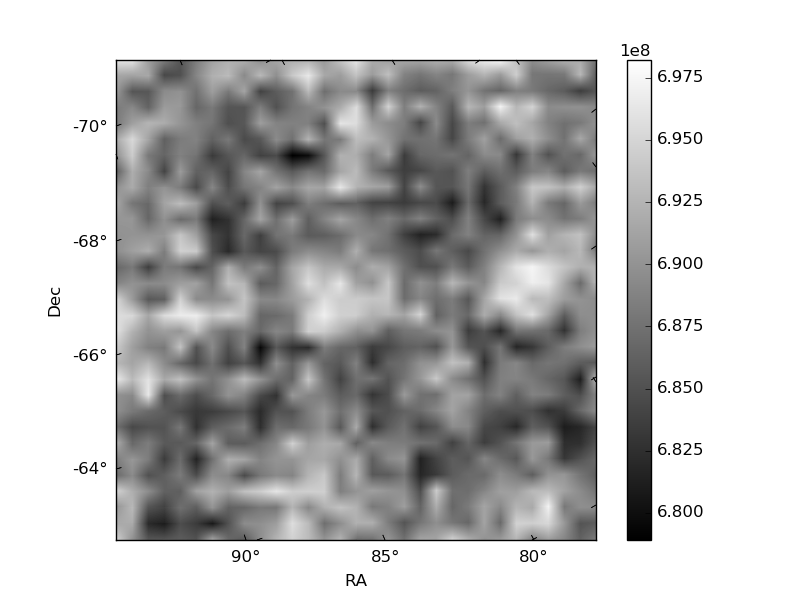
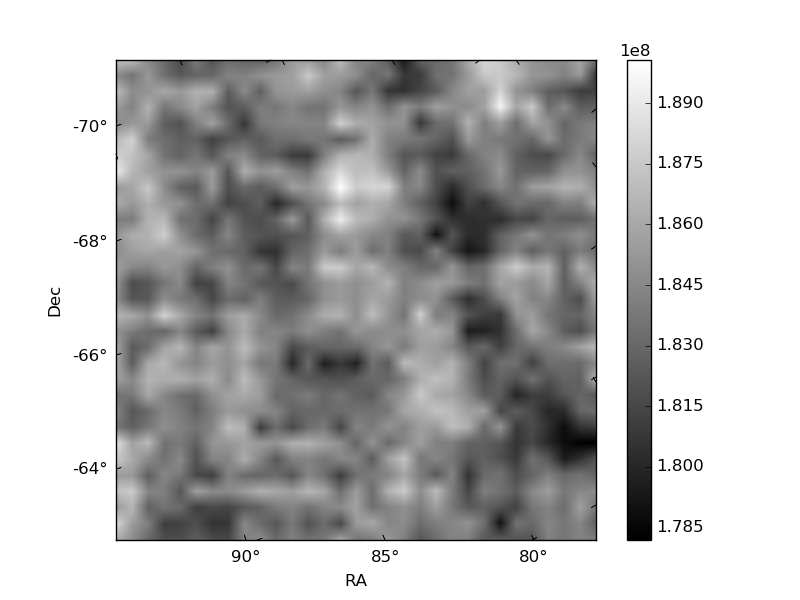
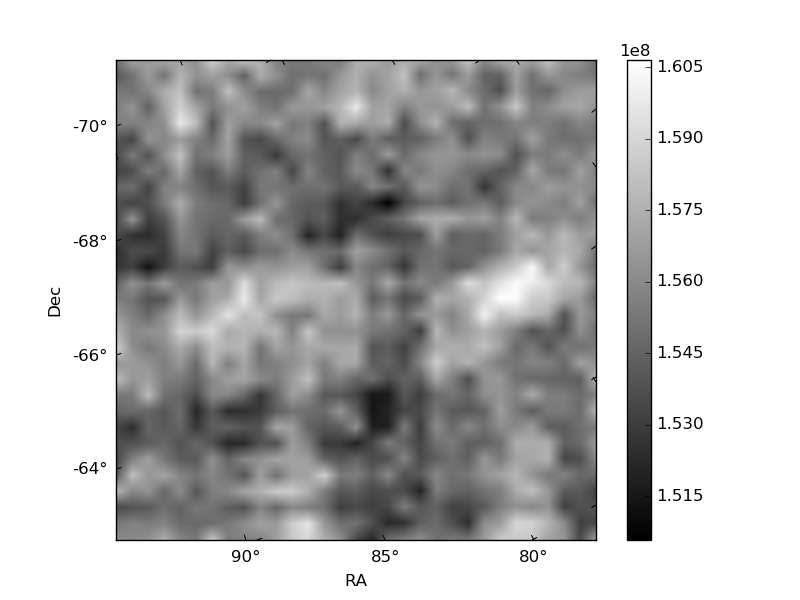
Histogram calculated using DETX and DETY for each event in the final _common_clean file
| Quadrant A | 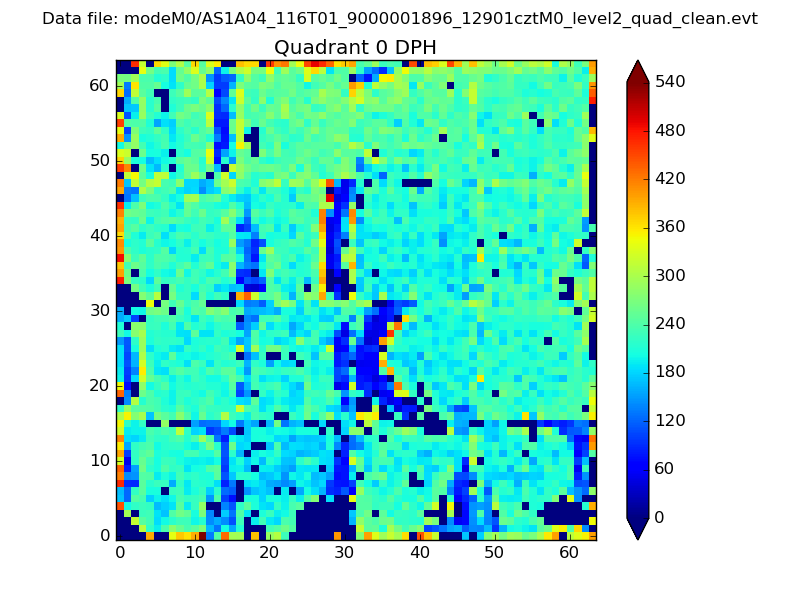 |
 |
Quadrant B |
|---|---|---|---|
| Quadrant D | 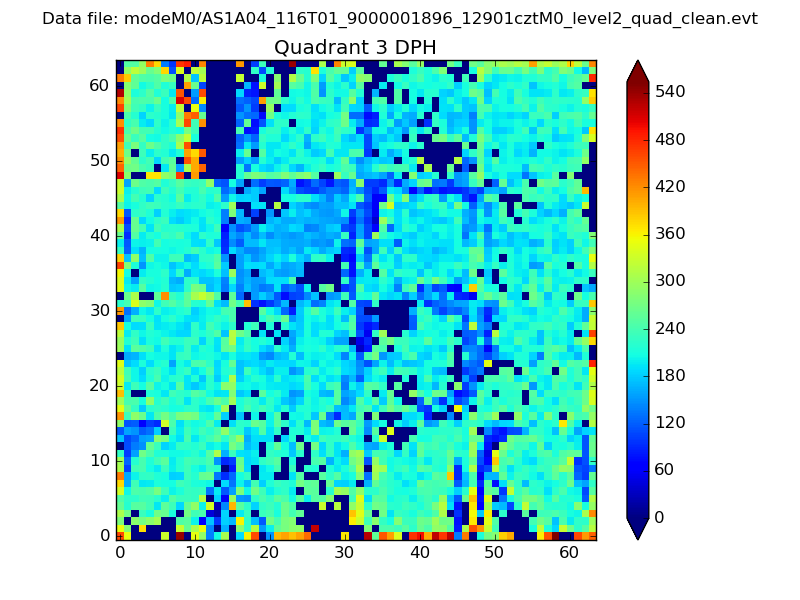 |
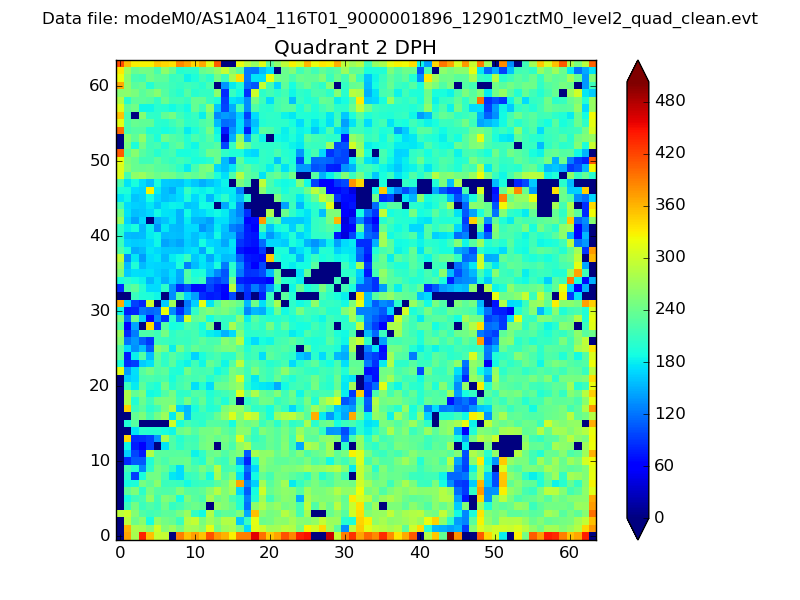 |
Quadrant C |
| Plot type | Count rate plots | Images |
|---|---|---|
| Comparison with Poisson distribution Blue bars denote a histogram of data divided into 1 sec bins. Red curve is a Poisson curve with rate = median count rate of data. |
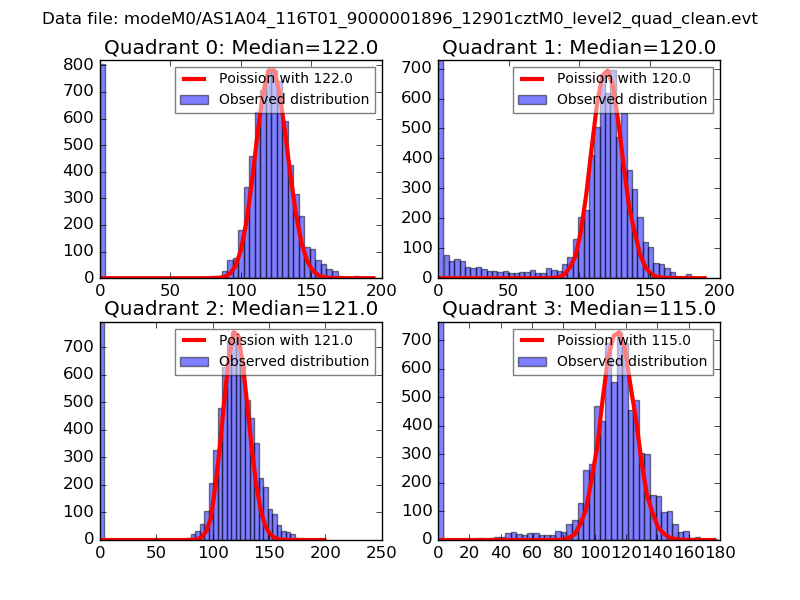 |
 |
| Quadrant-wise count rates Data is divided into 100 sec bins |
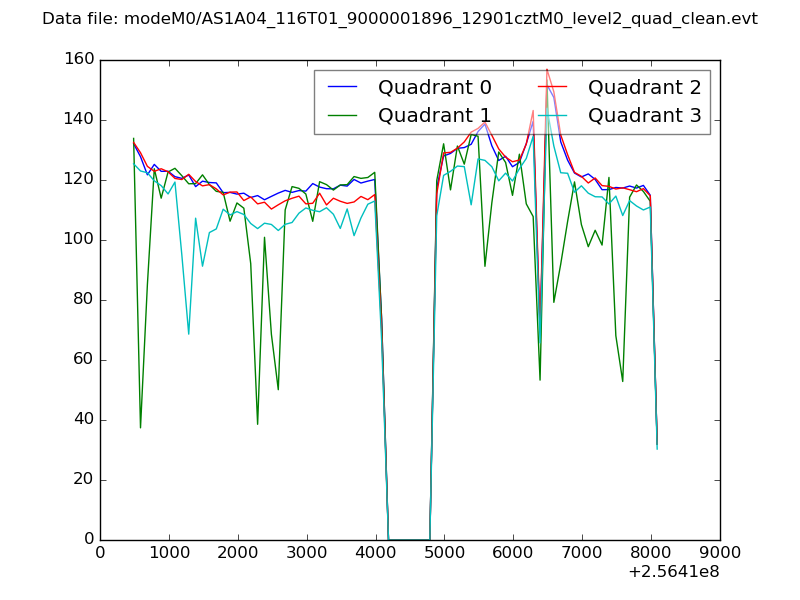 |
|
| Module-wise count rates for Quadrant A Data is divided into 100 sec bins |
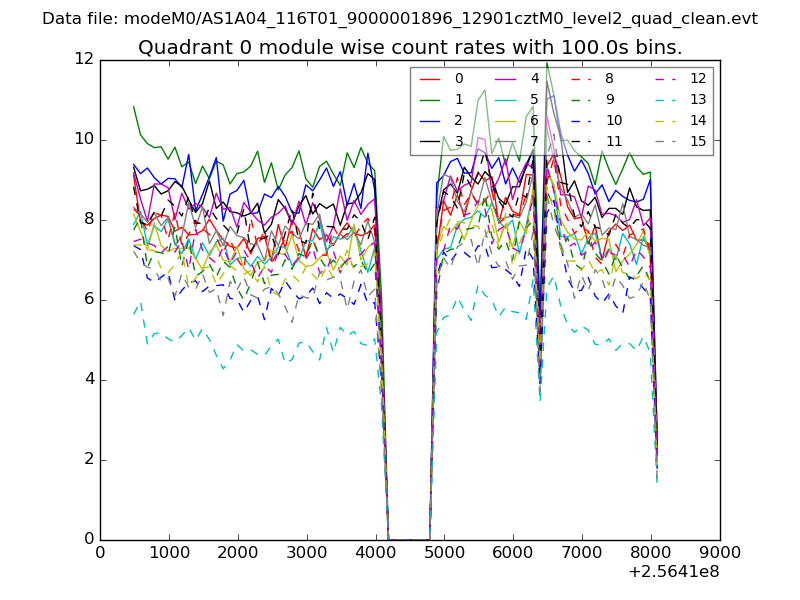 |
 |
| Module-wise count rates for Quadrant B Data is divided into 100 sec bins |
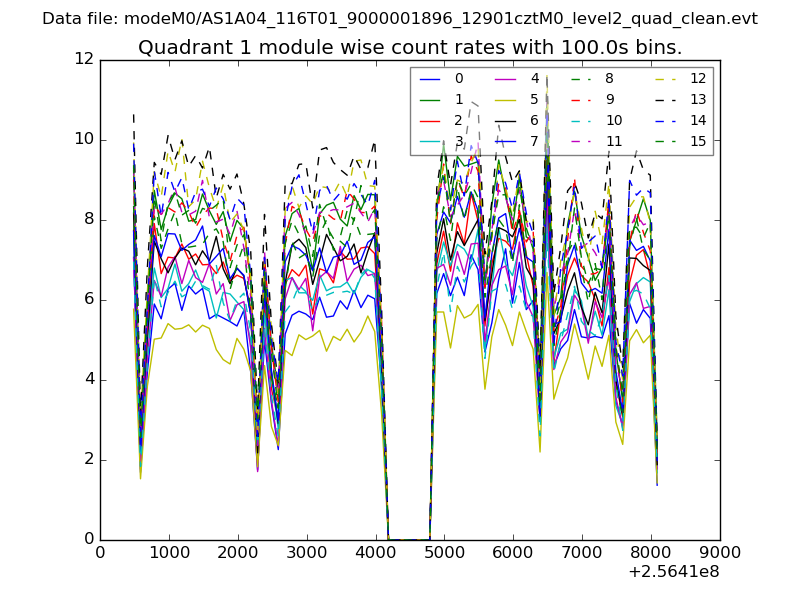 |
 |
| Module-wise count rates for Quadrant C Data is divided into 100 sec bins |
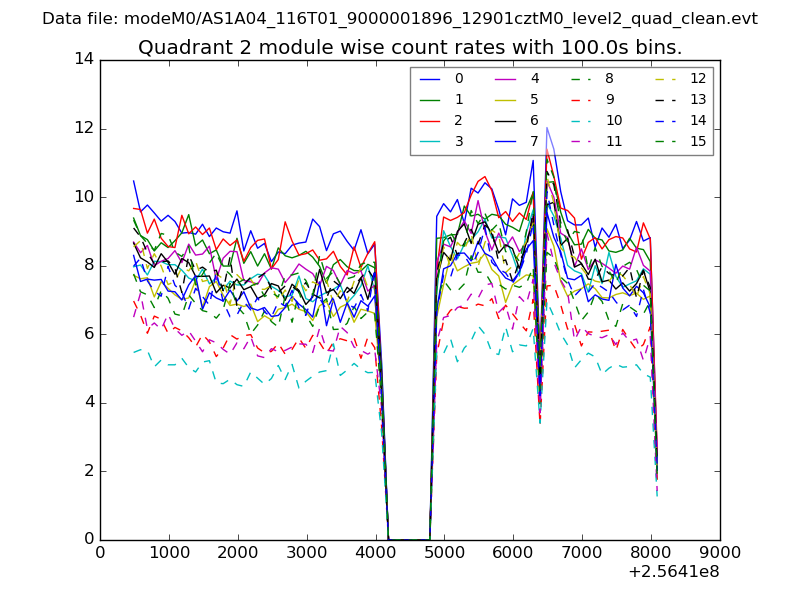 |
 |
| Module-wise count rates for Quadrant D Data is divided into 100 sec bins |
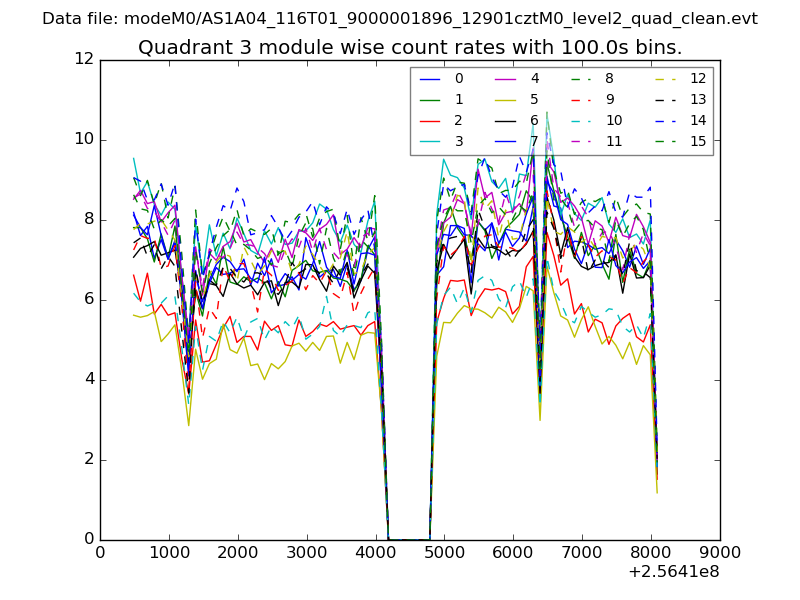 |
 |
| Parameter | Plot |
|---|---|
| CZT HV Monitor | 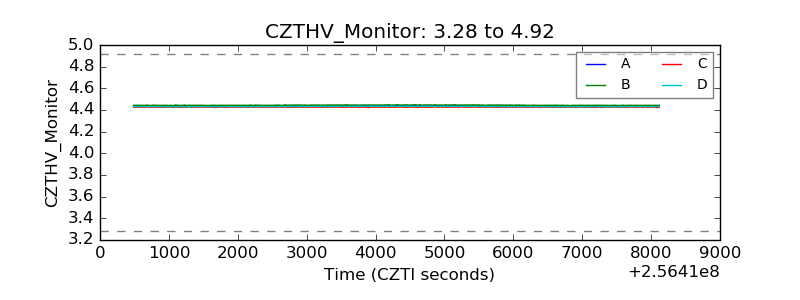 |
| D_VDD | 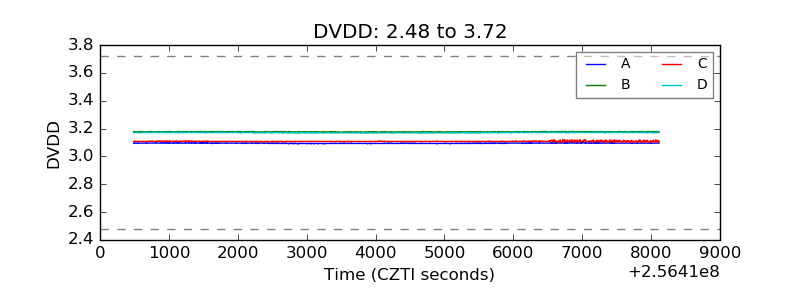 |
| Temperature 1 | 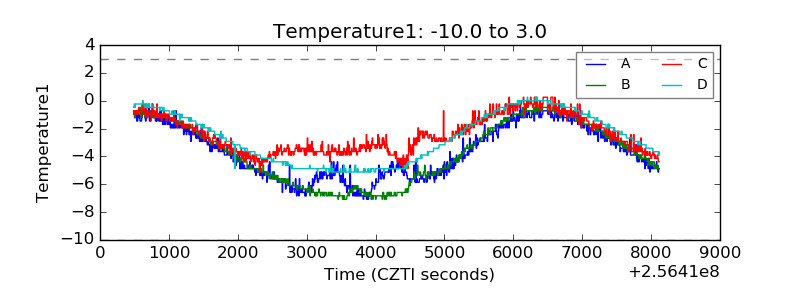 |
| Veto HV Monitor | 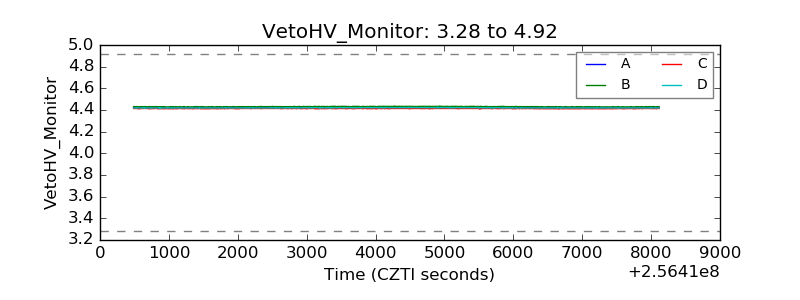 |
| Veto LLD |  |
| Alpha Counter | 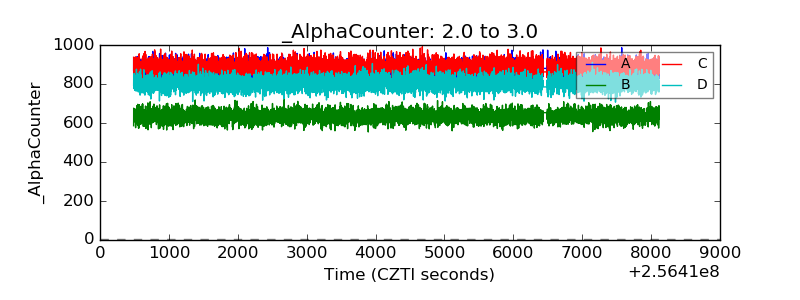 |
| _CPM_Rate | 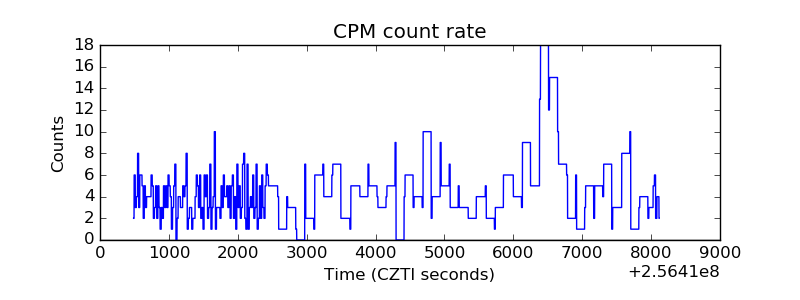 |
| CZT Counter | 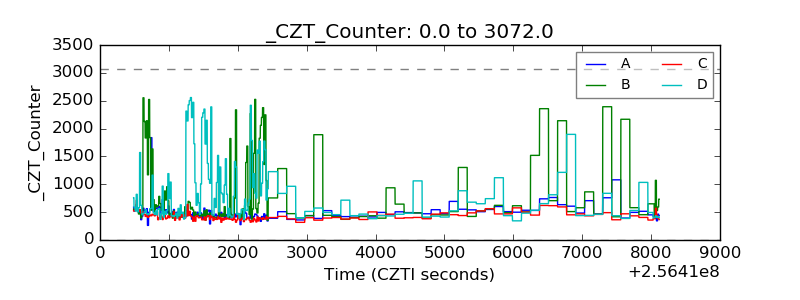 |
| +2.5 Volts monitor |  |
| +5 Volts monitor |  |
| _ROLL_ROT | 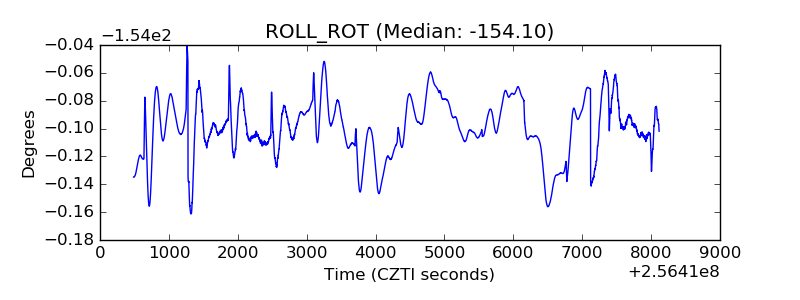 |
| _Roll_DEC | 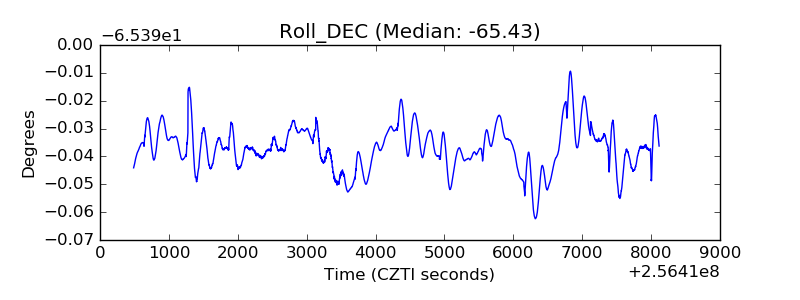 |
| _Roll_RA | 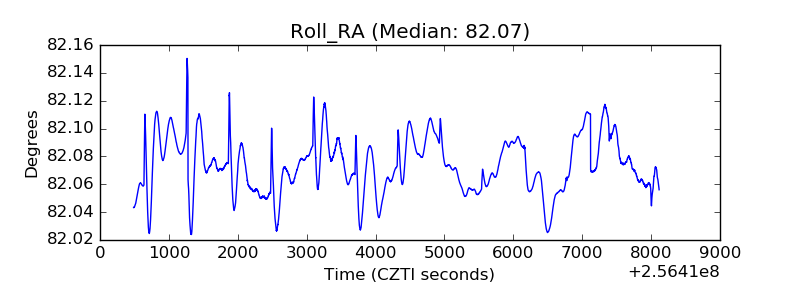 |
| Veto Counter | 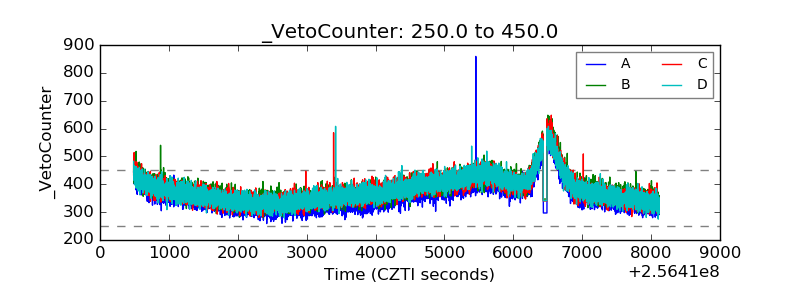 |