| Param | Original file | Final file |
|---|---|---|
| Filename | modeM0/AS1A04_116T01_9000001896_12904cztM0_level2.evt | modeM0/AS1A04_116T01_9000001896_12904cztM0_level2_quad_clean.evt |
| Size (bytes) | 1,252,056,960 | 198,535,680 |
| Size | 1.2 GB | 189.3 MB |
| Events in quadrant A | 5,954,165 | 1,376,734 |
| Events in quadrant B | 14,865,281 | 1,131,517 |
| Events in quadrant C | 5,649,688 | 1,362,765 |
| Events in quadrant D | 10,577,077 | 1,247,421 |
| Mode M9 | |||
|---|---|---|---|
| Quadrant | BADHDUFLAG | Total packets | Discarded packets |
| A | 0 | 12 | 0 |
| B | 0 | 12 | 0 |
| C | 0 | 12 | 0 |
| D | 0 | 12 | 0 |
| Mode SS | |||
|---|---|---|---|
| Quadrant | BADHDUFLAG | Total packets | Discarded packets |
| A | 0 | 264 | 0 |
| B | 0 | 264 | 0 |
| C | 0 | 264 | 0 |
| D | 0 | 264 | 0 |
| Mode M0 | |||
|---|---|---|---|
| Quadrant | BADHDUFLAG | Total packets | Discarded packets |
| A | 0 | 26512 | 4 |
| B | 0 | 52894 | 3 |
| C | 0 | 26054 | 3 |
| D | 0 | 40407 | 3 |
| Quadrant | Total seconds | Saturated seconds | Saturation percentage |
|---|---|---|---|
| A | 12917 | 34 | 0.263219% |
| B | 12917 | 4041 | 31.284354% |
| C | 12917 | 20 | 0.154835% |
| D | 12917 | 1068 | 8.268174% |
Noise dominated data is calculated using 1-second bins in cleaned event files. If a bin has >2000 counts, and if more than 50% of those come from <1% of pixels, then it is considered to be noise-dominated and hence unusable.
| Quadrant | # 1 sec bins | Bins with >0 counts | Bins with >2000 counts | High rate bins dominated by noise | Noise dominated (total time) | Noise dominated (detector-on time) | Marked lightcurve |
|---|---|---|---|---|---|---|---|
| A | 14168 | 12920 | 0 | 0 | 0.00% | 0.00% |  |
| B | 14168 | 12919 | 2687 | 2687 | 18.97% | 20.80% | 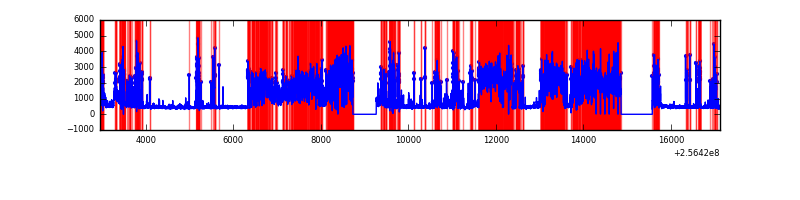 |
| C | 14168 | 12920 | 0 | 0 | 0.00% | 0.00% | 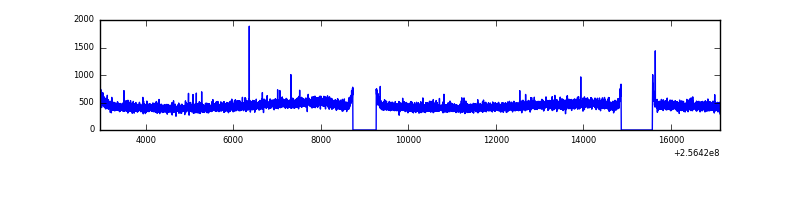 |
| D | 14168 | 12920 | 962 | 962 | 6.79% | 7.45% |  |
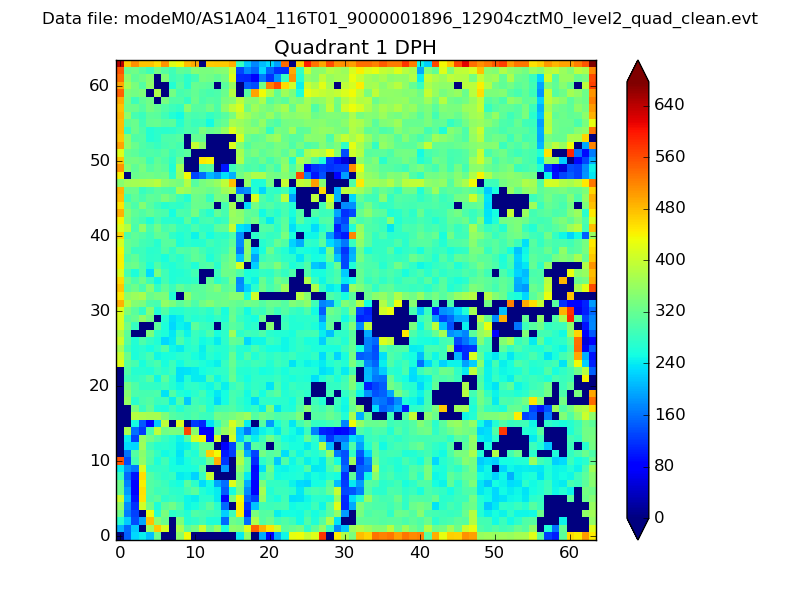
Top three noisy pixels from each quadrant. If the there are fewer than three noisy pixels in the level2.evt file, extra rows are filled as -1
| Pixel properties | Quadrant properties | ||||||
|---|---|---|---|---|---|---|---|
| Quadrant | DetID | PixID | Counts | Sigma | Mean | Median | Sigma |
| A | 12 | 189 | 98283 | 321.1 | 1487 | 1453 | 301.6 |
| A | 1 | 162 | 45940 | 147.52 | 1487 | 1453 | 301.6 |
| A | 11 | 29 | 40670 | 130.05 | 1487 | 1453 | 301.6 |
| B | 0 | 85 | 5903451 | 25336.51 | 1228 | 1198 | 233.0 |
| B | 4 | 239 | 3715244 | 15943.23 | 1228 | 1198 | 233.0 |
| B | 3 | 64 | 242365 | 1035.25 | 1228 | 1198 | 233.0 |
| C | 8 | 128 | 11117 | 29.03 | 1443 | 1449 | 333.1 |
| C | 13 | 61 | 10750 | 27.93 | 1443 | 1449 | 333.1 |
| C | 8 | 112 | 6645 | 15.6 | 1443 | 1449 | 333.1 |
| D | 1 | 52 | 3306182 | 9756.63 | 1395 | 1351 | 338.7 |
| D | 14 | 35 | 885948 | 2611.54 | 1395 | 1351 | 338.7 |
| D | 13 | 122 | 750500 | 2211.66 | 1395 | 1351 | 338.7 |
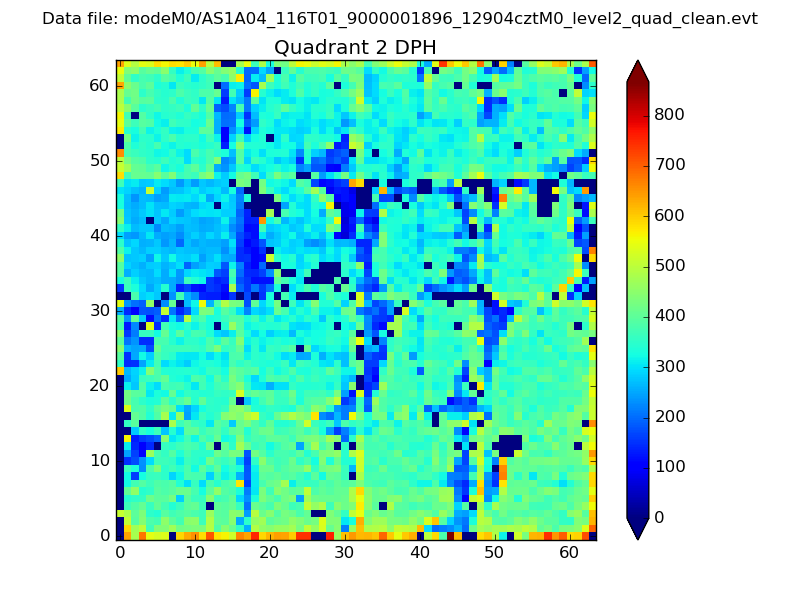
Histogram calculated using DETX and DETY for each event in the final _common_clean file
| Quadrant A | 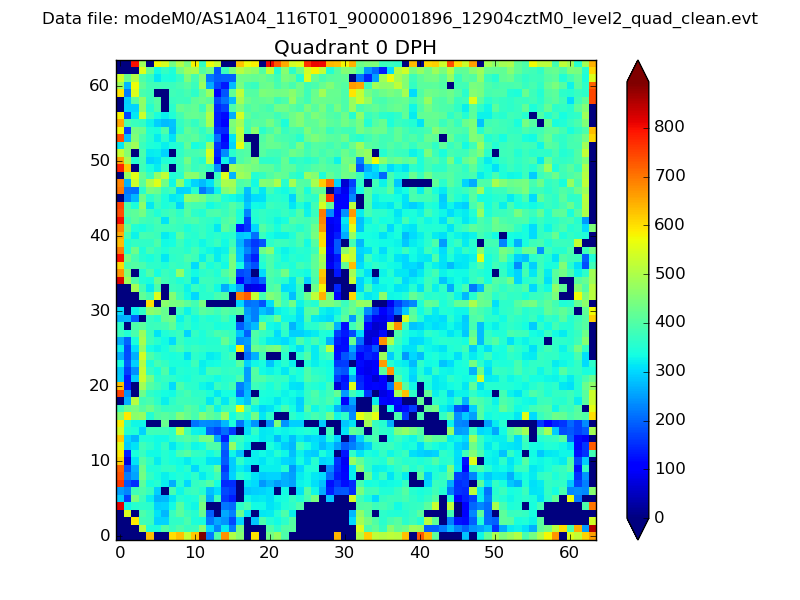 |
 |
Quadrant B |
|---|---|---|---|
| Quadrant D |  |
 |
Quadrant C |
| Plot type | Count rate plots | Images |
|---|---|---|
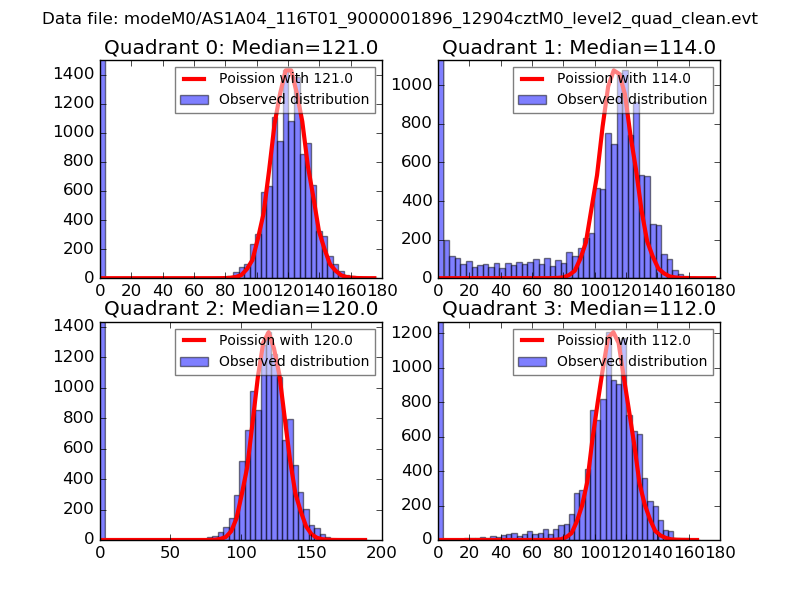
| Comparison with Poisson distribution Blue bars denote a histogram of data divided into 1 sec bins. Red curve is a Poisson curve with rate = median count rate of data. |
 |
 |
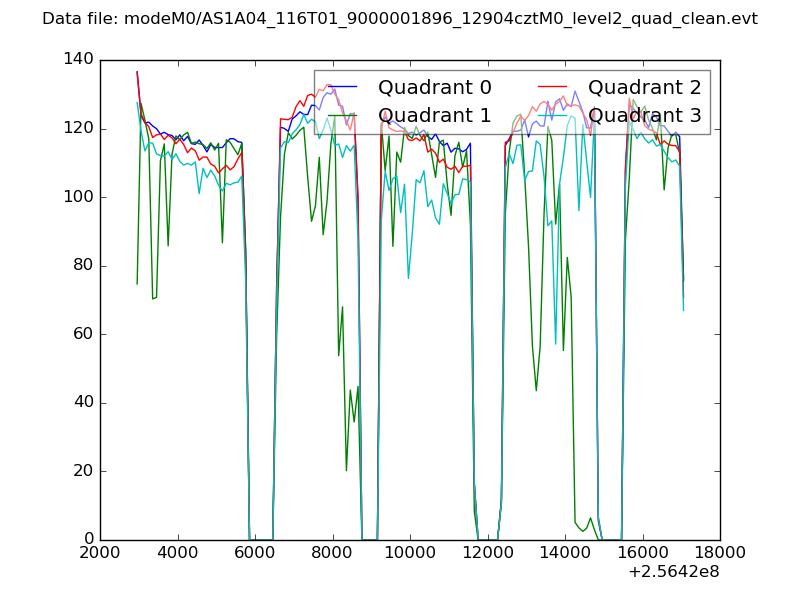
| Quadrant-wise count rates Data is divided into 100 sec bins |
 |
|
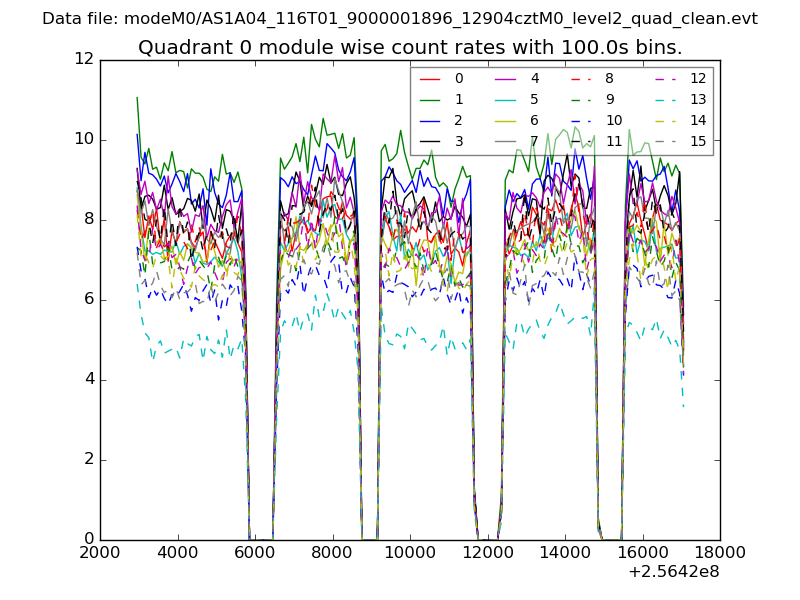
| Module-wise count rates for Quadrant A Data is divided into 100 sec bins |
 |
 |
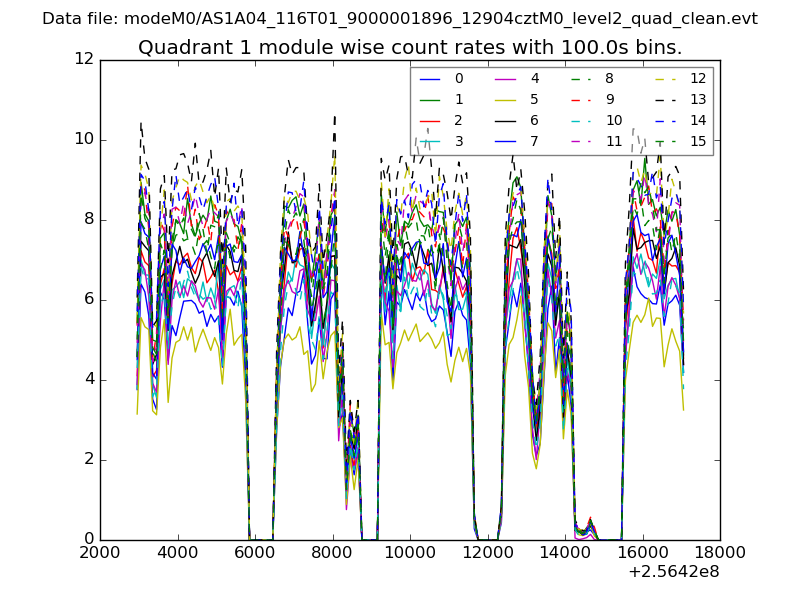
| Module-wise count rates for Quadrant B Data is divided into 100 sec bins |
 |
 |
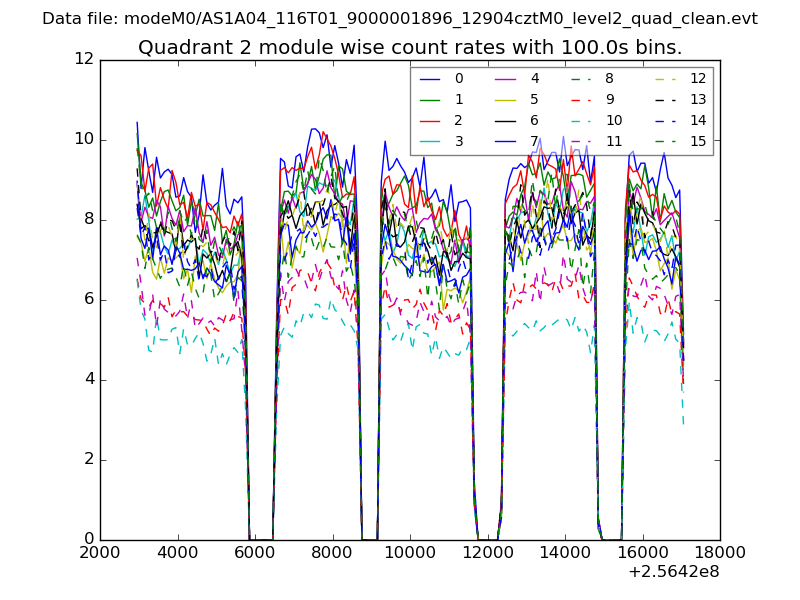
| Module-wise count rates for Quadrant C Data is divided into 100 sec bins |
 |
 |
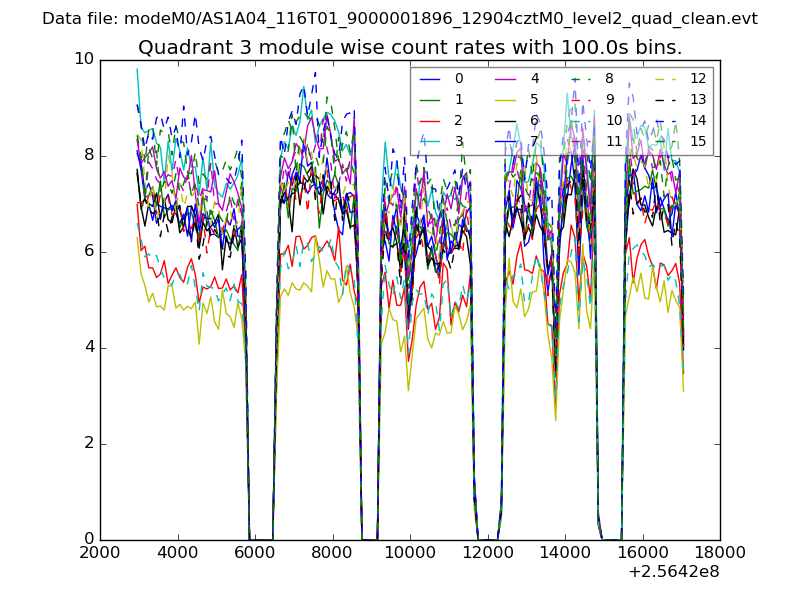
| Module-wise count rates for Quadrant D Data is divided into 100 sec bins |
 |
 |
| Parameter | Plot |
|---|---|
| CZT HV Monitor | 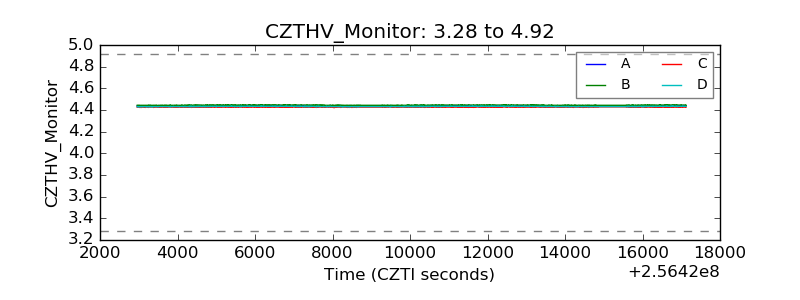 |
| D_VDD | 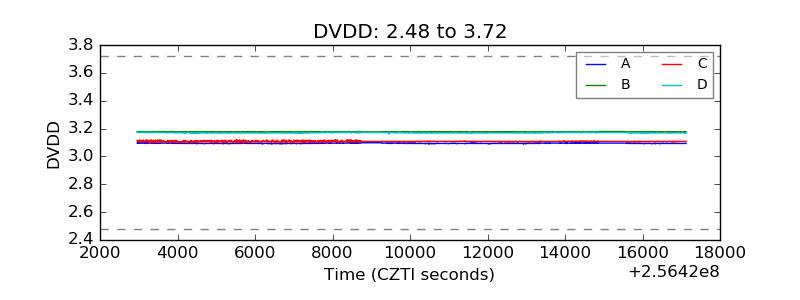 |
| Temperature 1 |  |
| Veto HV Monitor | 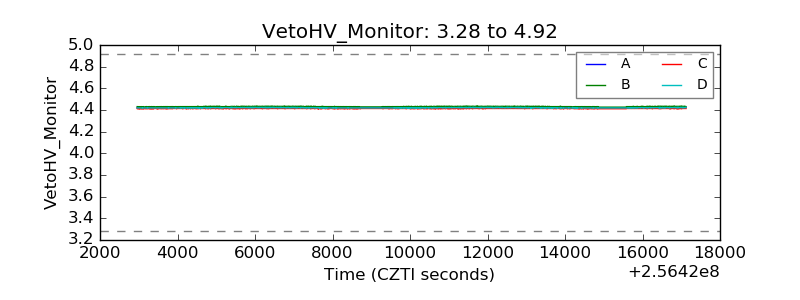 |
| Veto LLD | 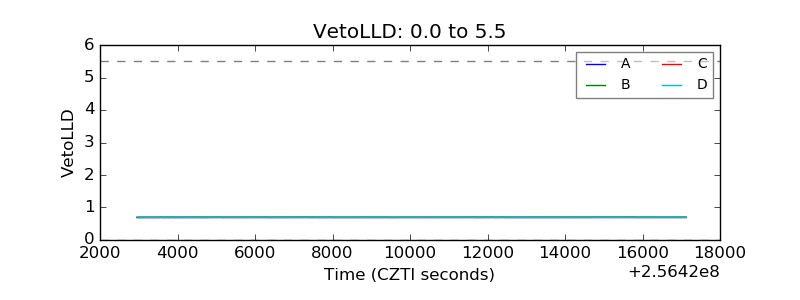 |
| Alpha Counter | 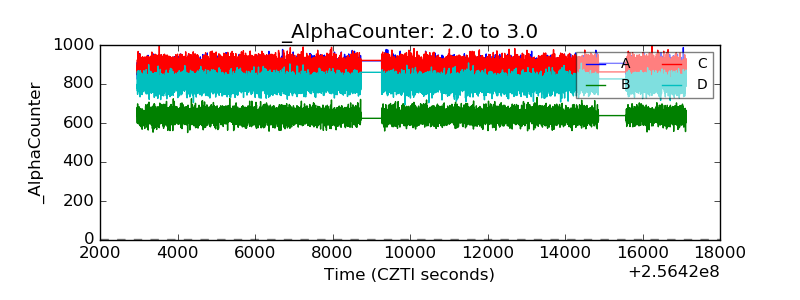 |
| _CPM_Rate | 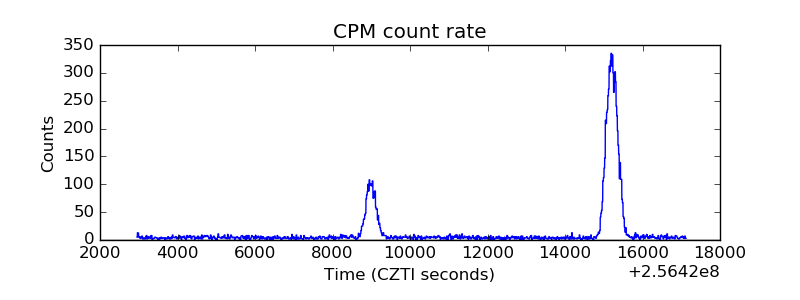 |
| CZT Counter | 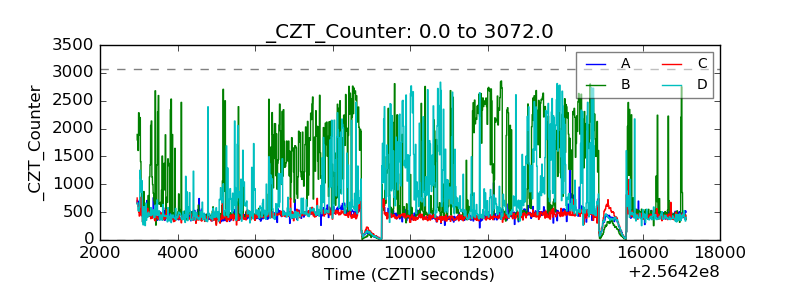 |
| +2.5 Volts monitor |  |
| +5 Volts monitor |  |
| _ROLL_ROT | 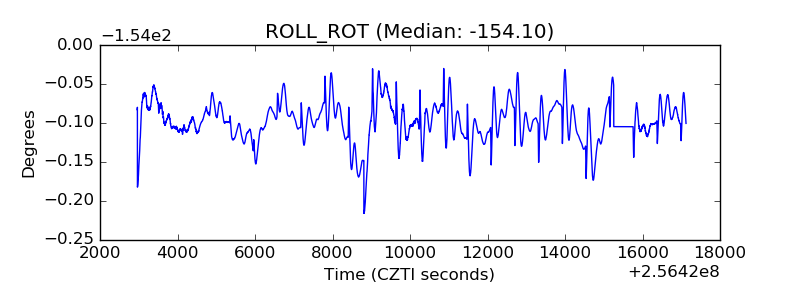 |
| _Roll_DEC | 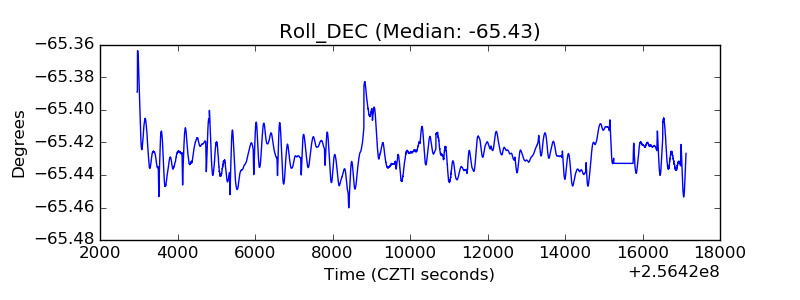 |
| _Roll_RA | 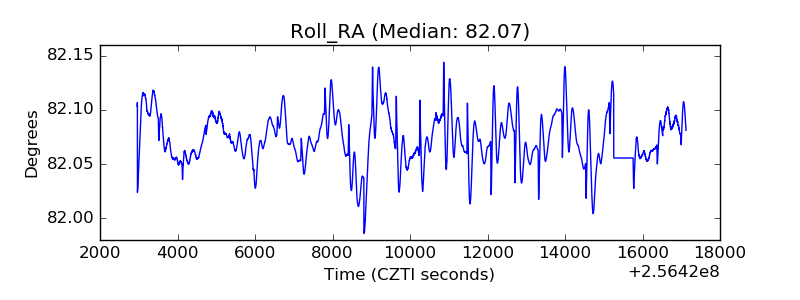 |
| Veto Counter | 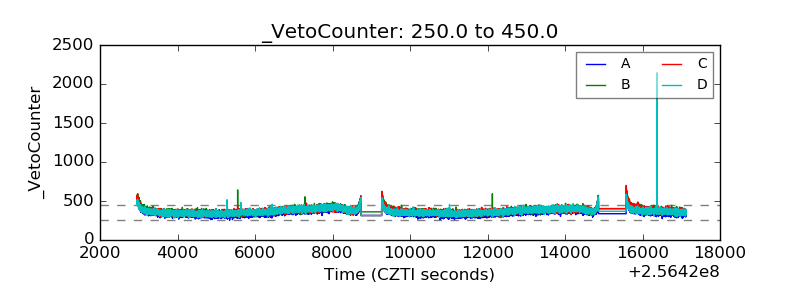 |