| Param | Original file | Final file |
|---|---|---|
| Filename | modeM0/AS1A04_116T01_9000001896_12905cztM0_level2.evt | modeM0/AS1A04_116T01_9000001896_12905cztM0_level2_quad_clean.evt |
| Size (bytes) | 545,650,560 | 108,584,640 |
| Size | 520.4 MB | 103.6 MB |
| Events in quadrant A | 3,351,244 | 751,577 |
| Events in quadrant B | 5,488,849 | 628,326 |
| Events in quadrant C | 3,060,010 | 748,082 |
| Events in quadrant D | 4,157,393 | 680,509 |
| Mode M9 | |||
|---|---|---|---|
| Quadrant | BADHDUFLAG | Total packets | Discarded packets |
| A | 0 | 9 | 0 |
| B | 0 | 9 | 0 |
| C | 0 | 9 | 0 |
| D | 0 | 9 | 0 |
| Mode SS | |||
|---|---|---|---|
| Quadrant | BADHDUFLAG | Total packets | Discarded packets |
| A | 0 | 140 | 0 |
| B | 0 | 140 | 0 |
| C | 0 | 140 | 0 |
| D | 0 | 140 | 0 |
| Mode M0 | |||
|---|---|---|---|
| Quadrant | BADHDUFLAG | Total packets | Discarded packets |
| A | 0 | 14379 | 3 |
| B | 0 | 20861 | 2 |
| C | 0 | 13905 | 2 |
| D | 0 | 17345 | 2 |
| Quadrant | Total seconds | Saturated seconds | Saturation percentage |
|---|---|---|---|
| A | 6879 | 33 | 0.479721% |
| B | 6879 | 1379 | 20.046518% |
| C | 6879 | 12 | 0.174444% |
| D | 6880 | 455 | 6.613372% |
Noise dominated data is calculated using 1-second bins in cleaned event files. If a bin has >2000 counts, and if more than 50% of those come from <1% of pixels, then it is considered to be noise-dominated and hence unusable.
| Quadrant | # 1 sec bins | Bins with >0 counts | Bins with >2000 counts | High rate bins dominated by noise | Noise dominated (total time) | Noise dominated (detector-on time) | Marked lightcurve |
|---|---|---|---|---|---|---|---|
| A | 7770 | 6881 | 0 | 0 | 0.00% | 0.00% | 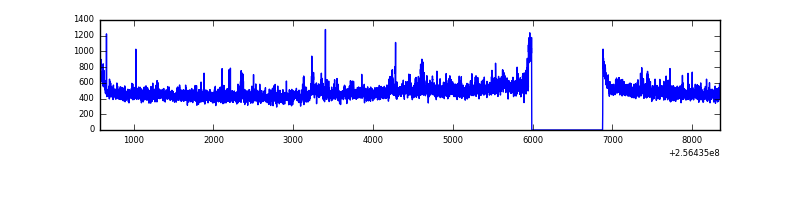 |
| B | 7770 | 6881 | 574 | 574 | 7.39% | 8.34% | 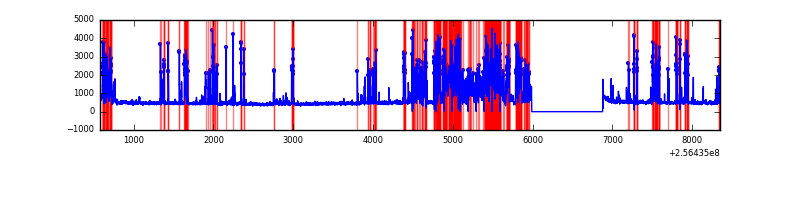 |
| C | 7770 | 6881 | 0 | 0 | 0.00% | 0.00% | 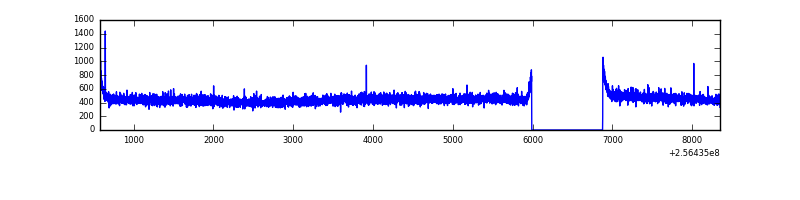 |
| D | 7771 | 6882 | 362 | 362 | 4.66% | 5.26% | 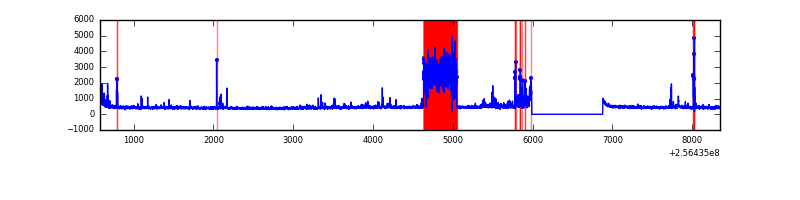 |
Top three noisy pixels from each quadrant. If the there are fewer than three noisy pixels in the level2.evt file, extra rows are filled as -1
| Pixel properties | Quadrant properties | ||||||
|---|---|---|---|---|---|---|---|
| Quadrant | DetID | PixID | Counts | Sigma | Mean | Median | Sigma |
| A | 12 | 189 | 153005 | 929.44 | 802 | 783 | 163.8 |
| A | 1 | 162 | 49816 | 299.39 | 802 | 783 | 163.8 |
| A | 1 | 178 | 20911 | 122.9 | 802 | 783 | 163.8 |
| B | 4 | 239 | 2615035 | 20142.13 | 683 | 665 | 129.8 |
| B | 3 | 64 | 94003 | 719.11 | 683 | 665 | 129.8 |
| B | 3 | 209 | 36156 | 273.44 | 683 | 665 | 129.8 |
| C | 13 | 61 | 5745 | 27.41 | 783 | 785 | 180.9 |
| C | 12 | 4 | 3059 | 12.57 | 783 | 785 | 180.9 |
| C | 8 | 222 | 2226 | 7.96 | 783 | 785 | 180.9 |
| D | 1 | 52 | 1056841 | 5932.6 | 740 | 717 | 178.0 |
| D | 13 | 104 | 123664 | 690.63 | 740 | 717 | 178.0 |
| D | 2 | 14 | 53038 | 293.9 | 740 | 717 | 178.0 |
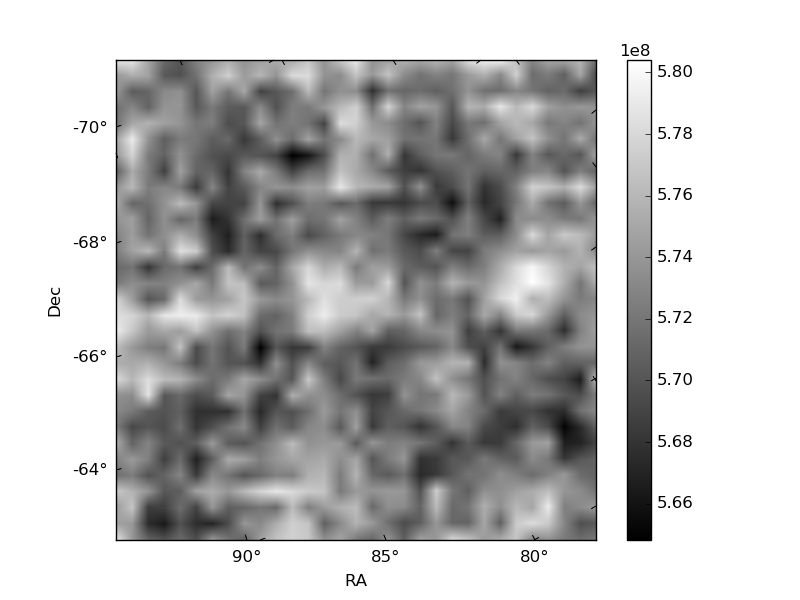
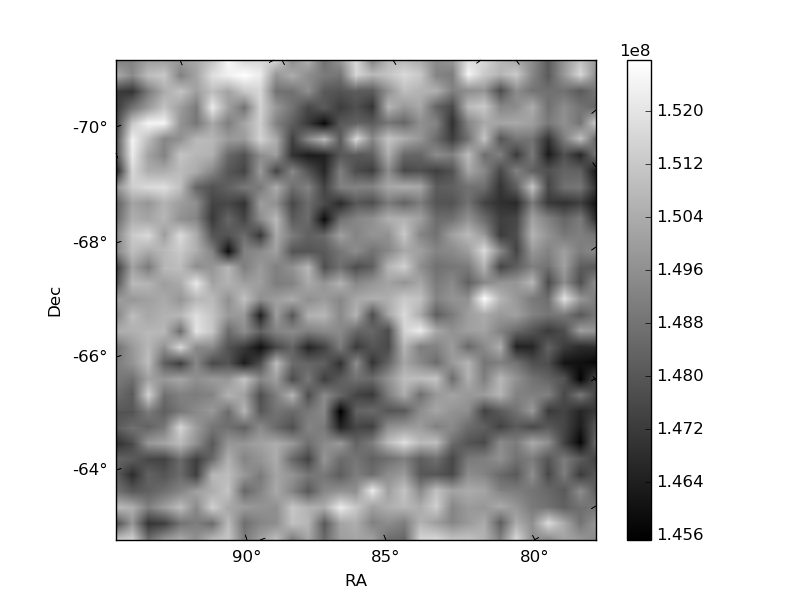
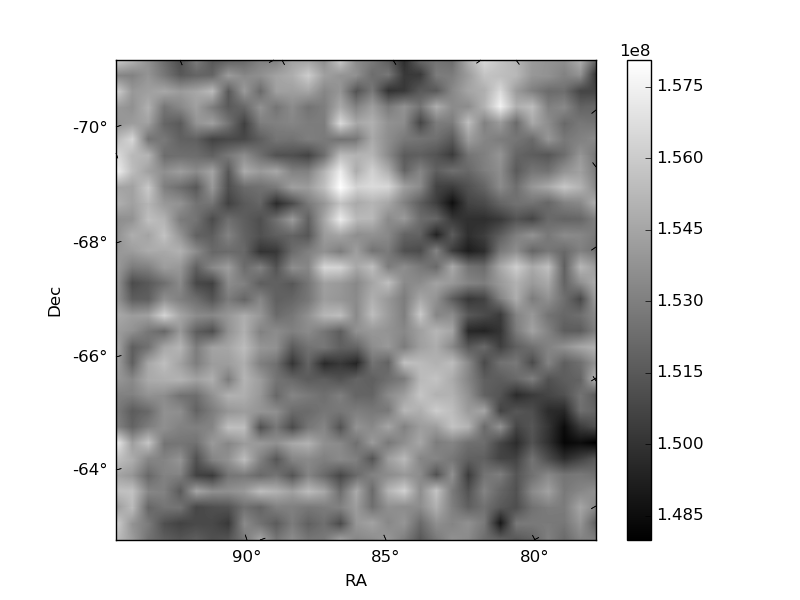
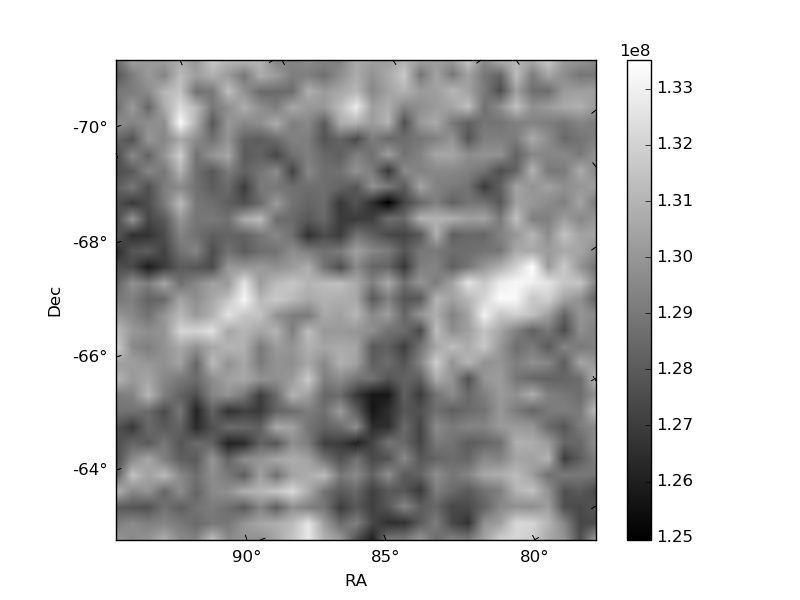
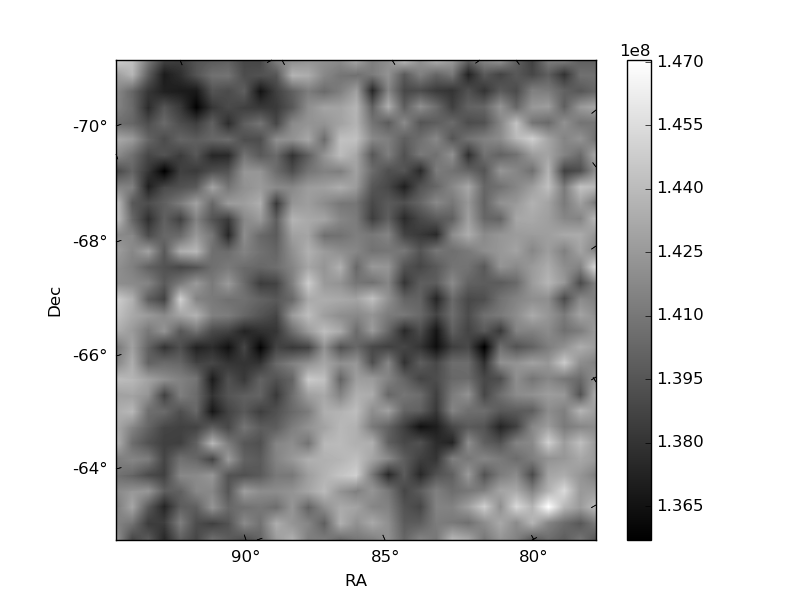
Histogram calculated using DETX and DETY for each event in the final _common_clean file
| Quadrant A | 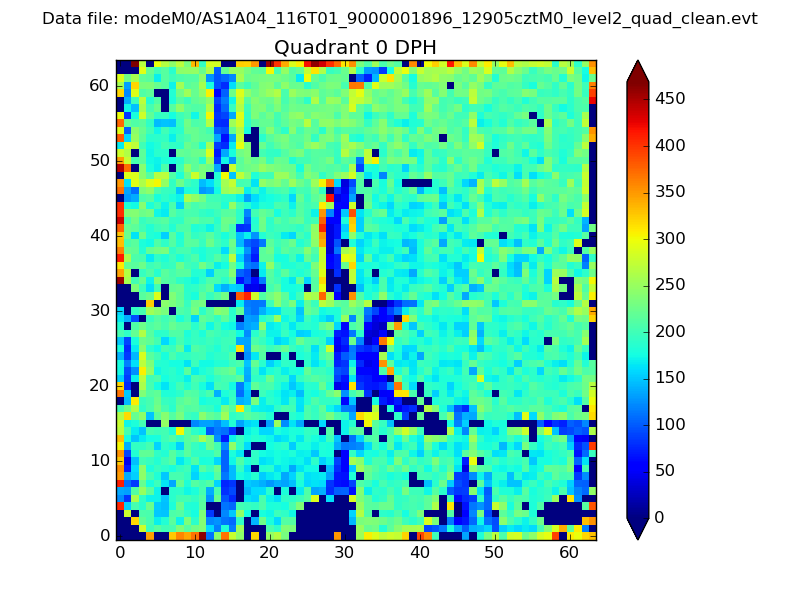 |
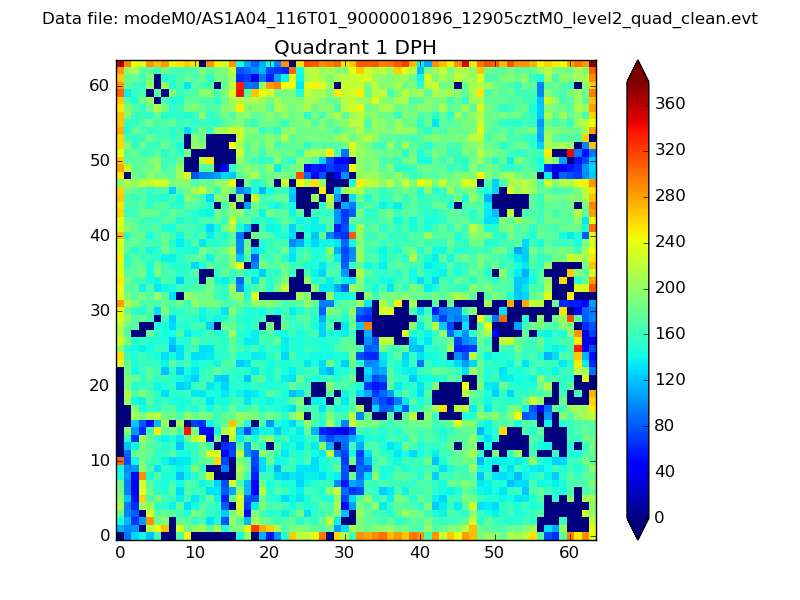 |
Quadrant B |
|---|---|---|---|
| Quadrant D | 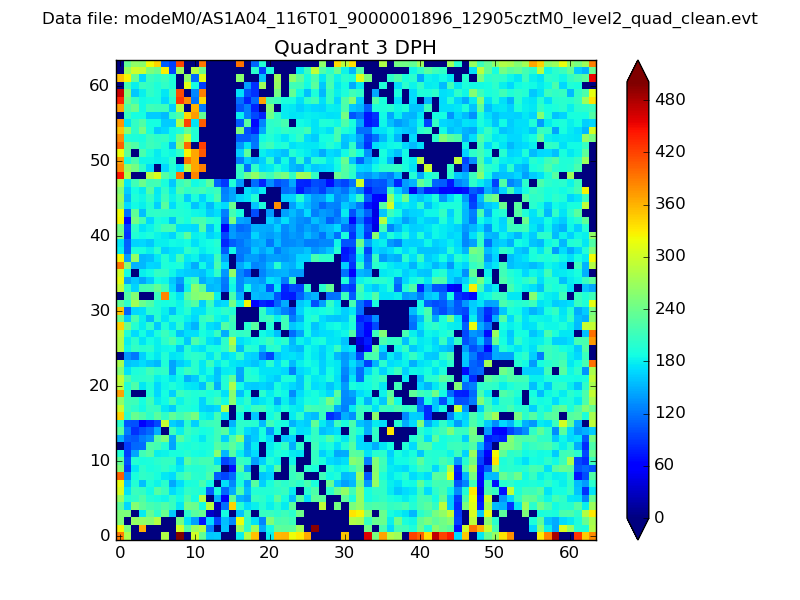 |
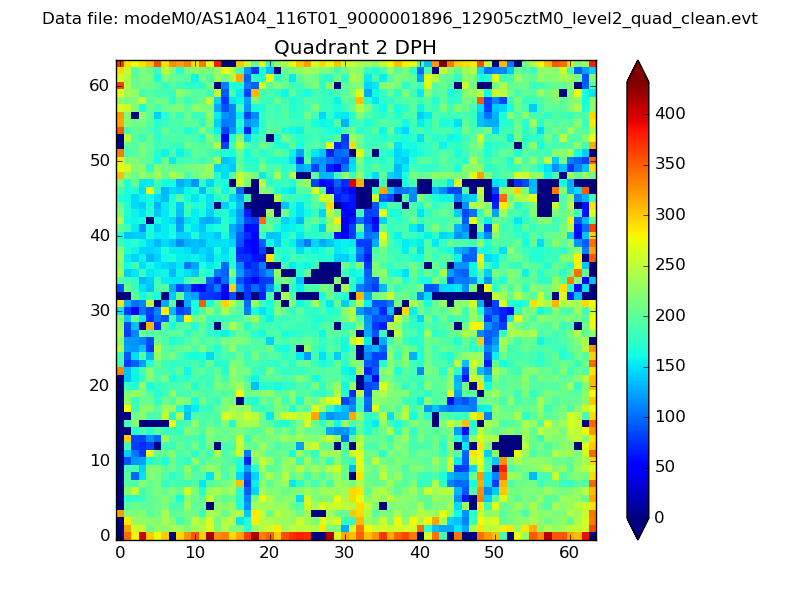 |
Quadrant C |
| Plot type | Count rate plots | Images |
|---|---|---|
| Comparison with Poisson distribution Blue bars denote a histogram of data divided into 1 sec bins. Red curve is a Poisson curve with rate = median count rate of data. |
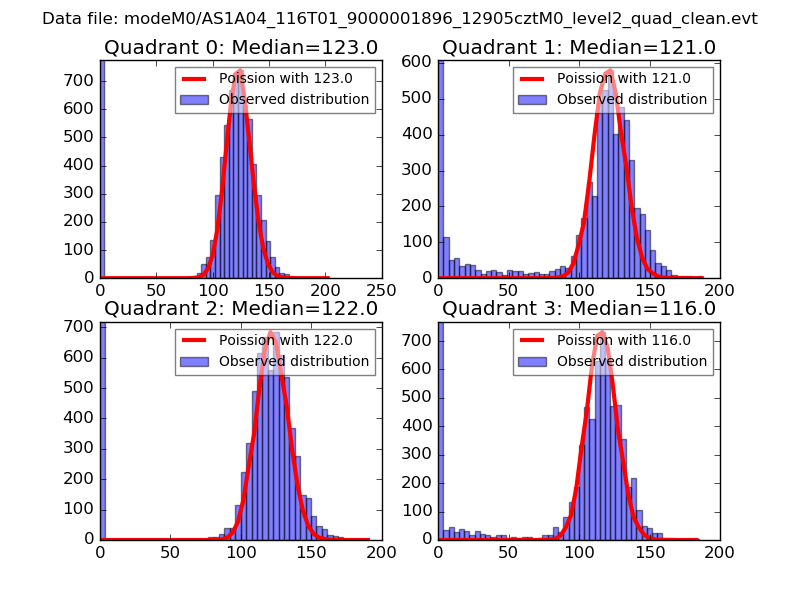 |
 |
| Quadrant-wise count rates Data is divided into 100 sec bins |
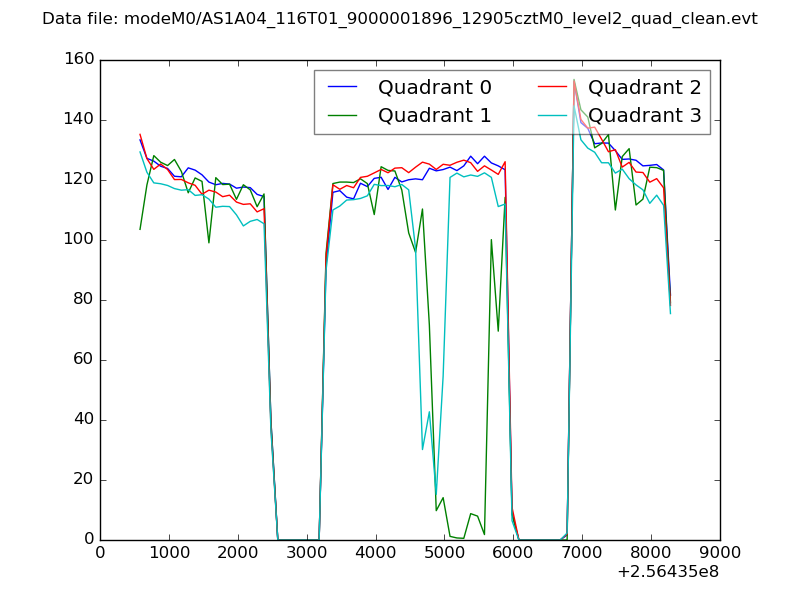 |
|
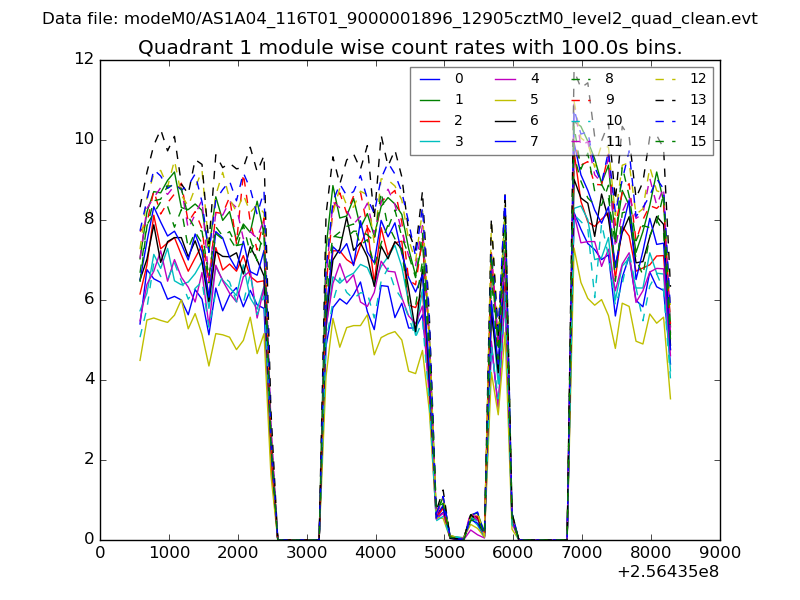
| Module-wise count rates for Quadrant A Data is divided into 100 sec bins |
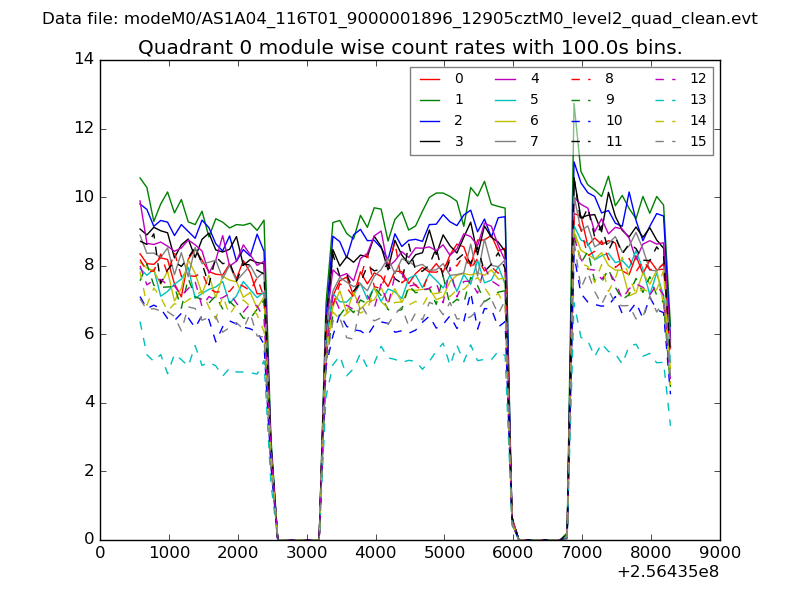 |
 |
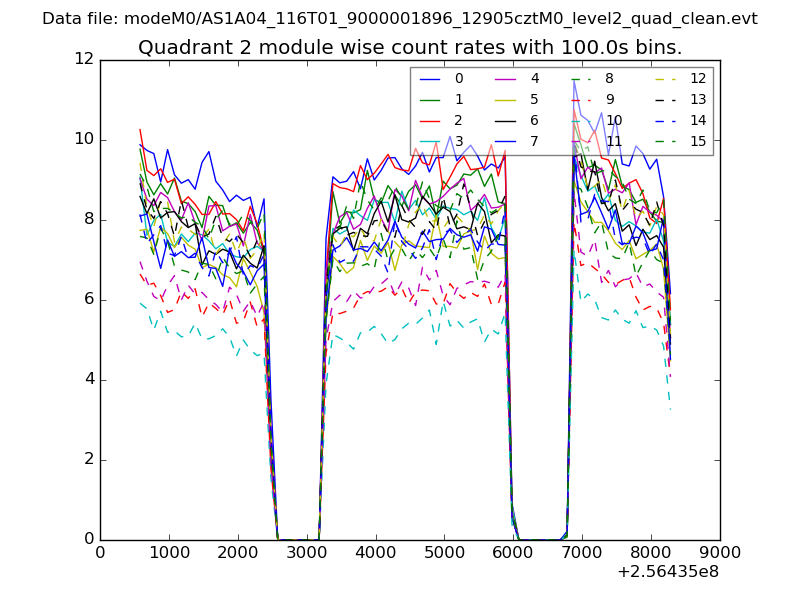
| Module-wise count rates for Quadrant B Data is divided into 100 sec bins |
 |
 |
| Module-wise count rates for Quadrant C Data is divided into 100 sec bins |
 |
 |
| Module-wise count rates for Quadrant D Data is divided into 100 sec bins |
 |
 |
| Parameter | Plot |
|---|---|
| CZT HV Monitor | 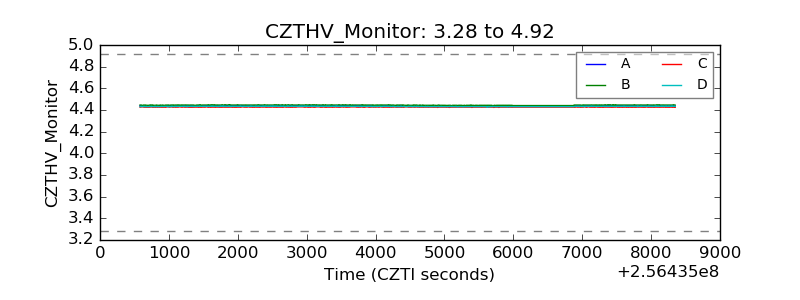 |
| D_VDD | 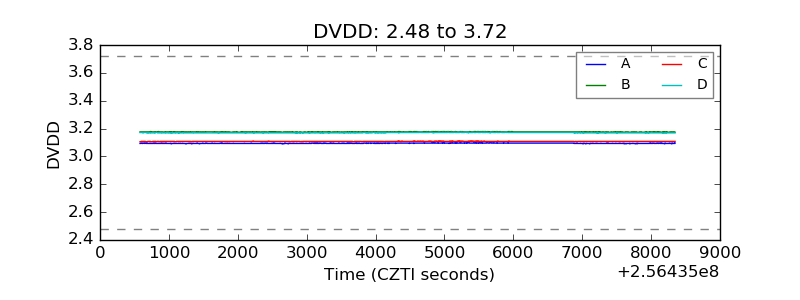 |
| Temperature 1 | 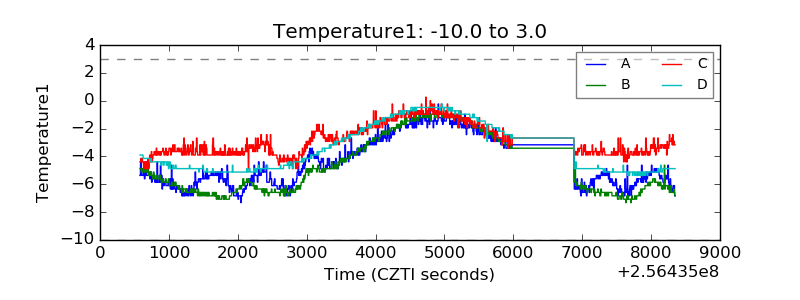 |
| Veto HV Monitor | 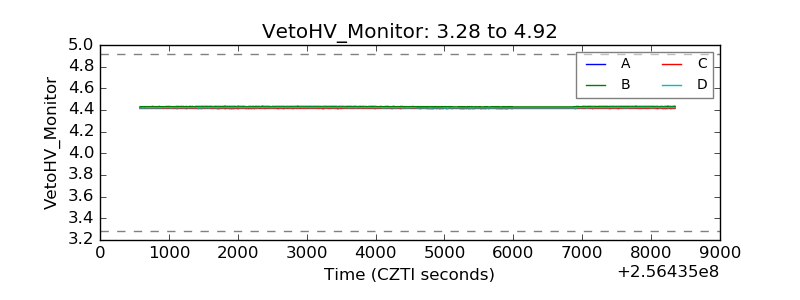 |
| Veto LLD | 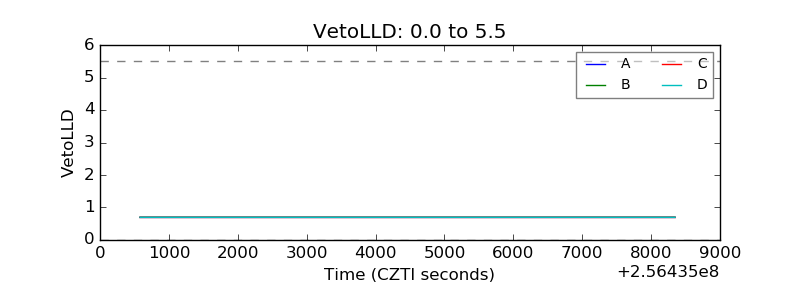 |
| Alpha Counter | 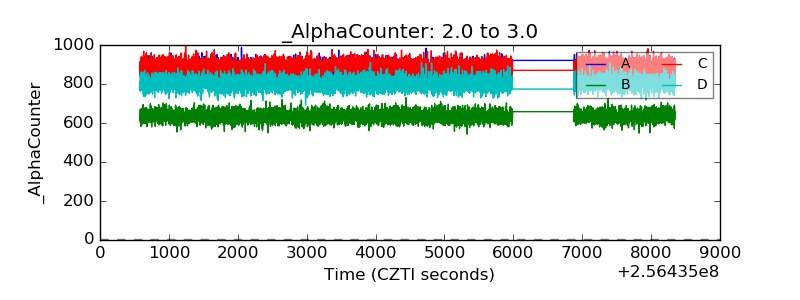 |
| _CPM_Rate | 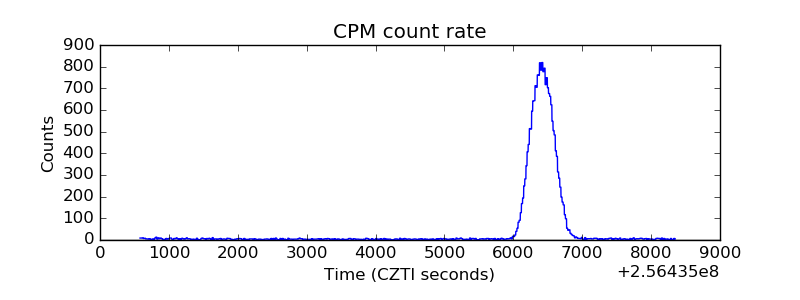 |
| CZT Counter | 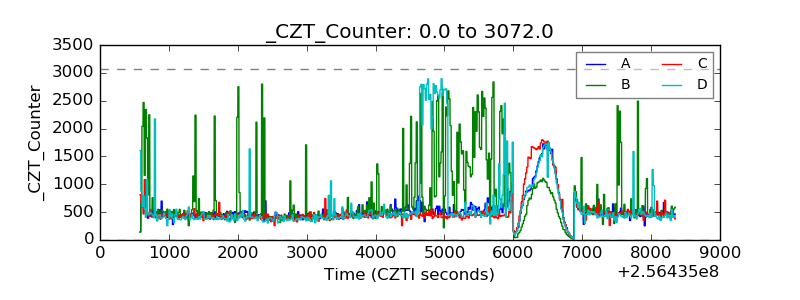 |
| +2.5 Volts monitor |  |
| +5 Volts monitor |  |
| _ROLL_ROT | 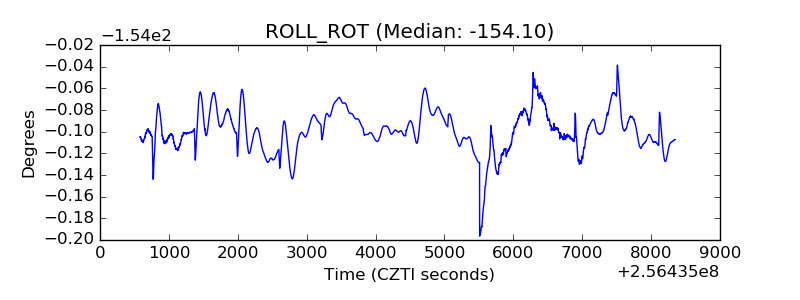 |
| _Roll_DEC | 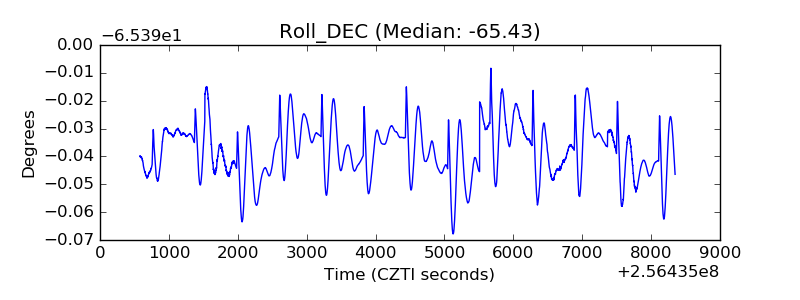 |
| _Roll_RA | 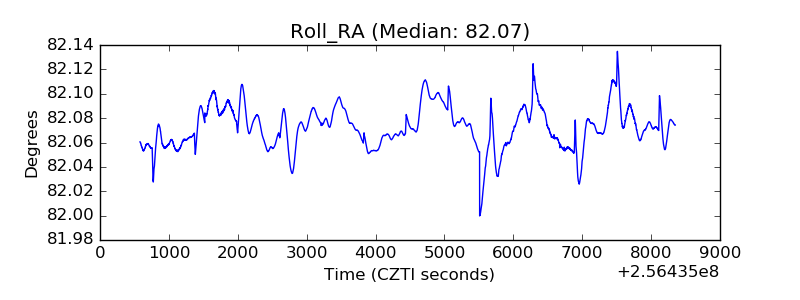 |
| Veto Counter | 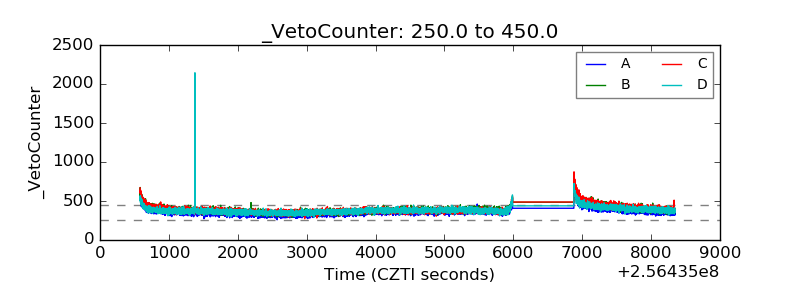 |