| Param | Original file | Final file |
|---|---|---|
| Filename | modeM0/AS1A04_116T01_9000001896_12906cztM0_level2.evt | modeM0/AS1A04_116T01_9000001896_12906cztM0_level2_quad_clean.evt |
| Size (bytes) | 494,628,480 | 104,996,160 |
| Size | 471.7 MB | 100.1 MB |
| Events in quadrant A | 3,334,531 | 708,373 |
| Events in quadrant B | 4,992,819 | 618,046 |
| Events in quadrant C | 3,042,433 | 710,837 |
| Events in quadrant D | 3,160,116 | 680,772 |
| Mode M9 | |||
|---|---|---|---|
| Quadrant | BADHDUFLAG | Total packets | Discarded packets |
| A | 0 | 13 | 0 |
| B | 0 | 13 | 0 |
| C | 0 | 13 | 0 |
| D | 0 | 14 | 0 |
| Mode SS | |||
|---|---|---|---|
| Quadrant | BADHDUFLAG | Total packets | Discarded packets |
| A | 0 | 136 | 0 |
| B | 0 | 136 | 0 |
| C | 0 | 136 | 0 |
| D | 0 | 136 | 0 |
| Mode M0 | |||
|---|---|---|---|
| Quadrant | BADHDUFLAG | Total packets | Discarded packets |
| A | 0 | 13959 | 3 |
| B | 0 | 19105 | 2 |
| C | 0 | 13505 | 2 |
| D | 0 | 14009 | 2 |
| Quadrant | Total seconds | Saturated seconds | Saturation percentage |
|---|---|---|---|
| A | 6611 | 40 | 0.605052% |
| B | 6611 | 1053 | 15.927999% |
| C | 6611 | 26 | 0.393284% |
| D | 6611 | 41 | 0.620178% |
Noise dominated data is calculated using 1-second bins in cleaned event files. If a bin has >2000 counts, and if more than 50% of those come from <1% of pixels, then it is considered to be noise-dominated and hence unusable.
| Quadrant | # 1 sec bins | Bins with >0 counts | Bins with >2000 counts | High rate bins dominated by noise | Noise dominated (total time) | Noise dominated (detector-on time) | Marked lightcurve |
|---|---|---|---|---|---|---|---|
| A | 7658 | 6613 | 0 | 0 | 0.00% | 0.00% | 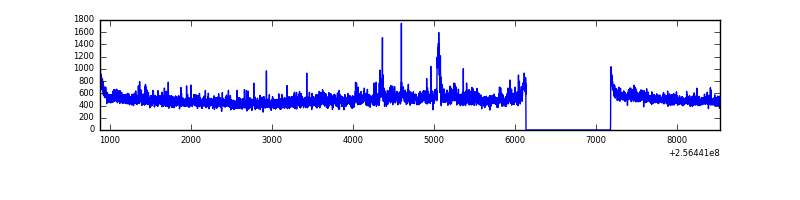 |
| B | 7658 | 6613 | 422 | 422 | 5.51% | 6.38% | 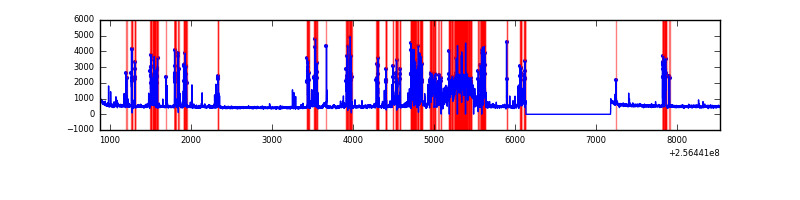 |
| C | 7658 | 6613 | 0 | 0 | 0.00% | 0.00% | 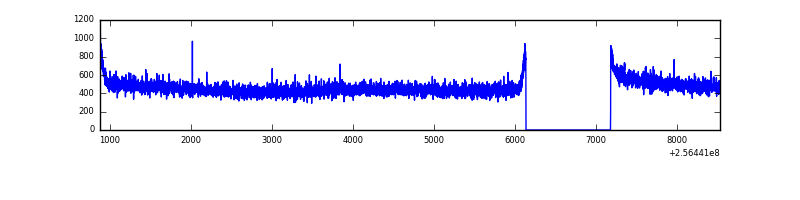 |
| D | 7658 | 6613 | 13 | 13 | 0.17% | 0.20% | 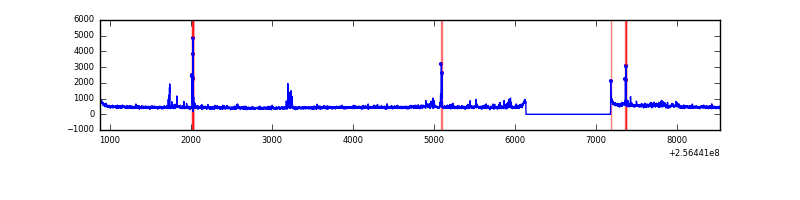 |
Top three noisy pixels from each quadrant. If the there are fewer than three noisy pixels in the level2.evt file, extra rows are filled as -1
| Pixel properties | Quadrant properties | ||||||
|---|---|---|---|---|---|---|---|
| Quadrant | DetID | PixID | Counts | Sigma | Mean | Median | Sigma |
| A | 12 | 189 | 100619 | 623.24 | 792 | 776 | 160.2 |
| A | 1 | 162 | 78525 | 485.33 | 792 | 776 | 160.2 |
| A | 1 | 178 | 41218 | 252.45 | 792 | 776 | 160.2 |
| B | 4 | 239 | 2099765 | 15863.32 | 705 | 687 | 132.3 |
| B | 3 | 209 | 37499 | 278.2 | 705 | 687 | 132.3 |
| B | 0 | 214 | 29118 | 214.86 | 705 | 687 | 132.3 |
| C | 13 | 61 | 5911 | 28.61 | 779 | 782 | 179.3 |
| C | 8 | 222 | 2457 | 9.34 | 779 | 782 | 179.3 |
| C | 12 | 4 | 2438 | 9.24 | 779 | 782 | 179.3 |
| D | 2 | 14 | 90411 | 493.81 | 767 | 746 | 181.6 |
| D | 1 | 52 | 55307 | 300.48 | 767 | 746 | 181.6 |
| D | 13 | 104 | 37252 | 201.05 | 767 | 746 | 181.6 |
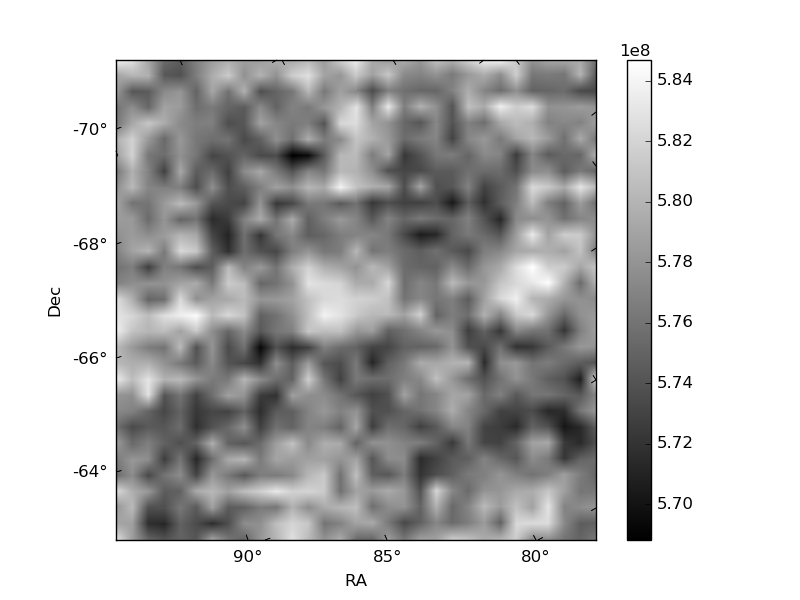
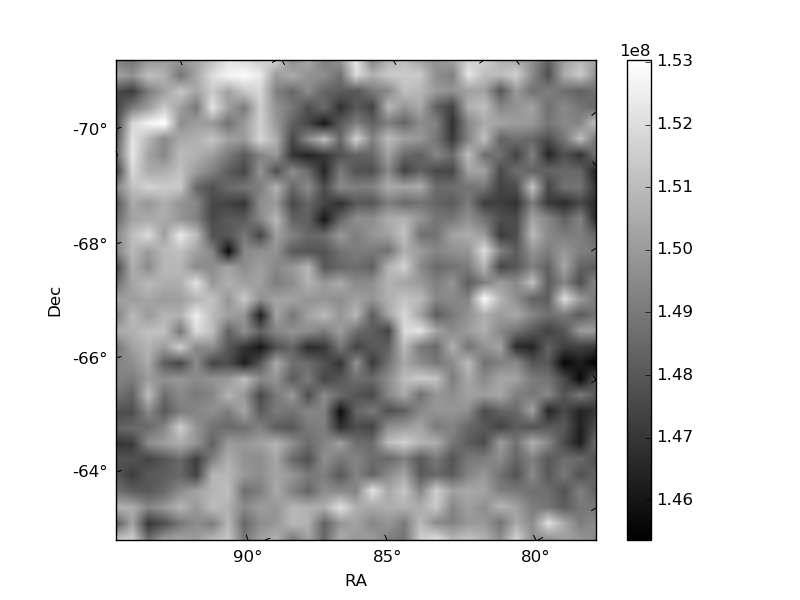
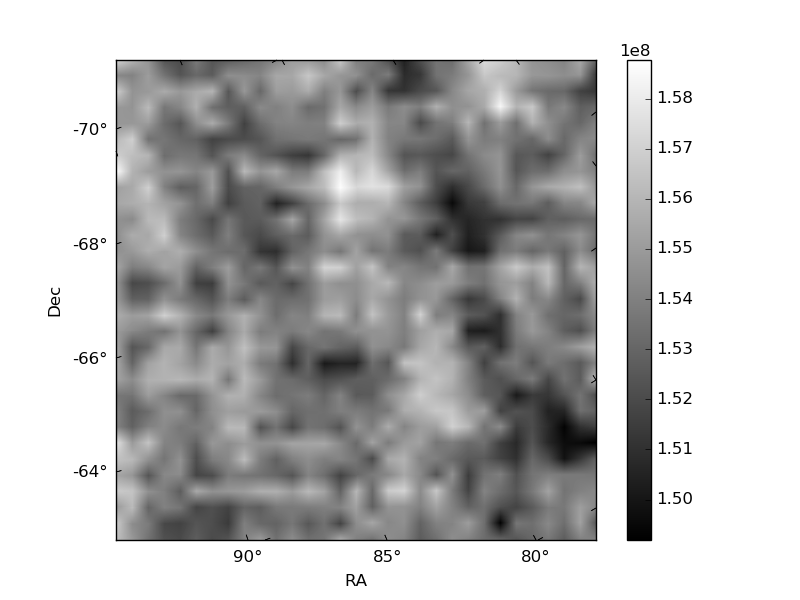
Histogram calculated using DETX and DETY for each event in the final _common_clean file
| Quadrant A | 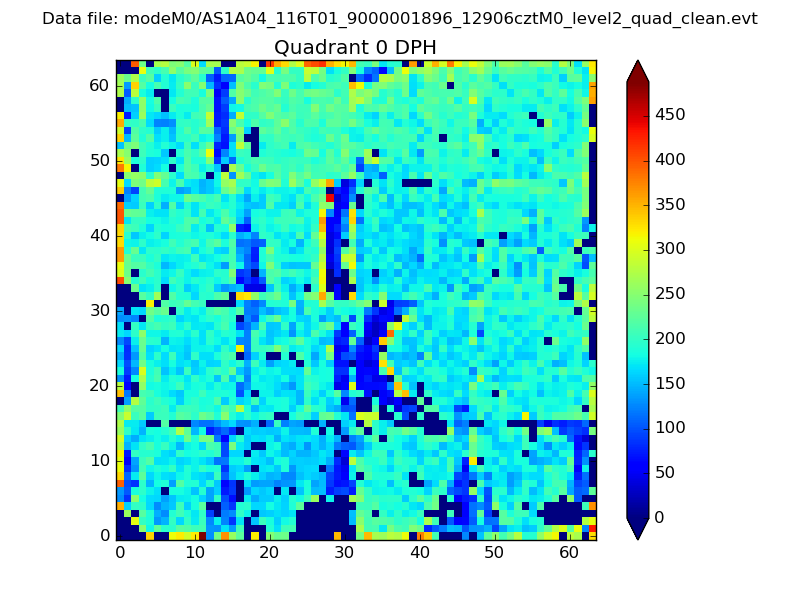 |
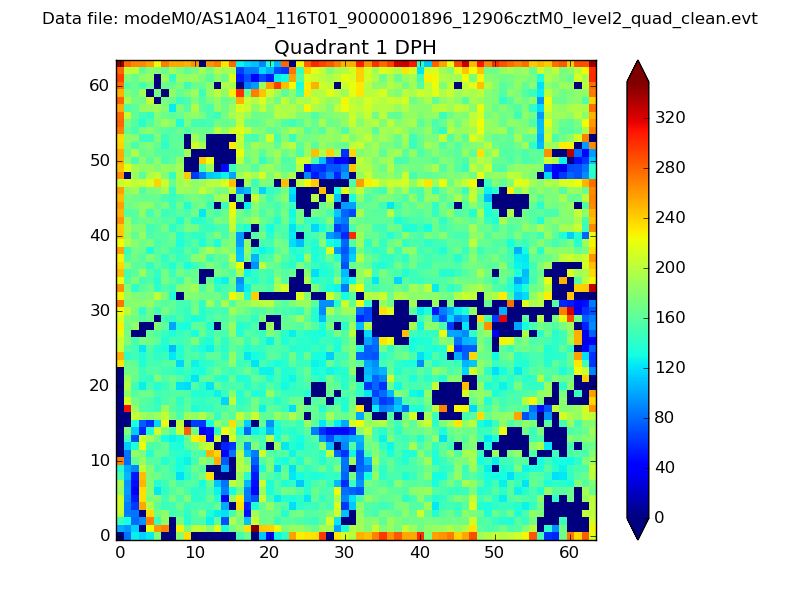 |
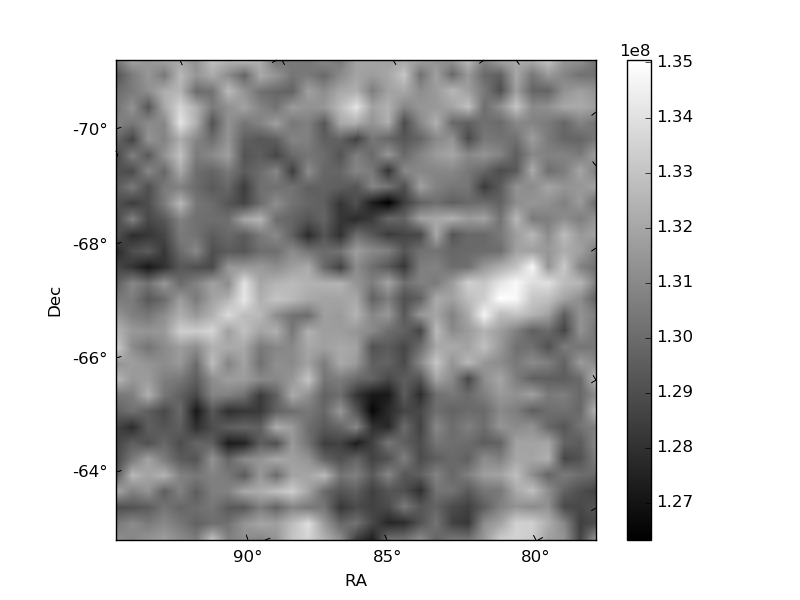
Quadrant B |
|---|---|---|---|
| Quadrant D | 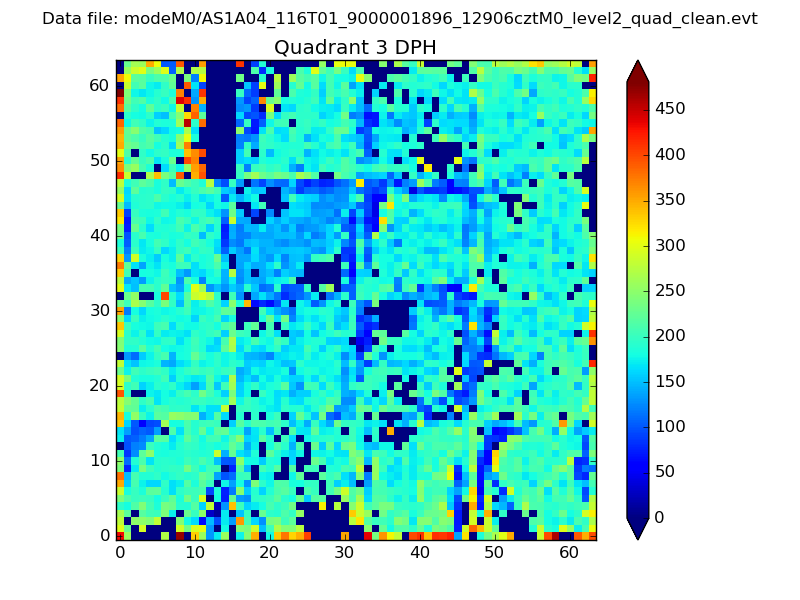 |
 |
Quadrant C |
| Plot type | Count rate plots | Images |
|---|---|---|
| Comparison with Poisson distribution Blue bars denote a histogram of data divided into 1 sec bins. Red curve is a Poisson curve with rate = median count rate of data. |
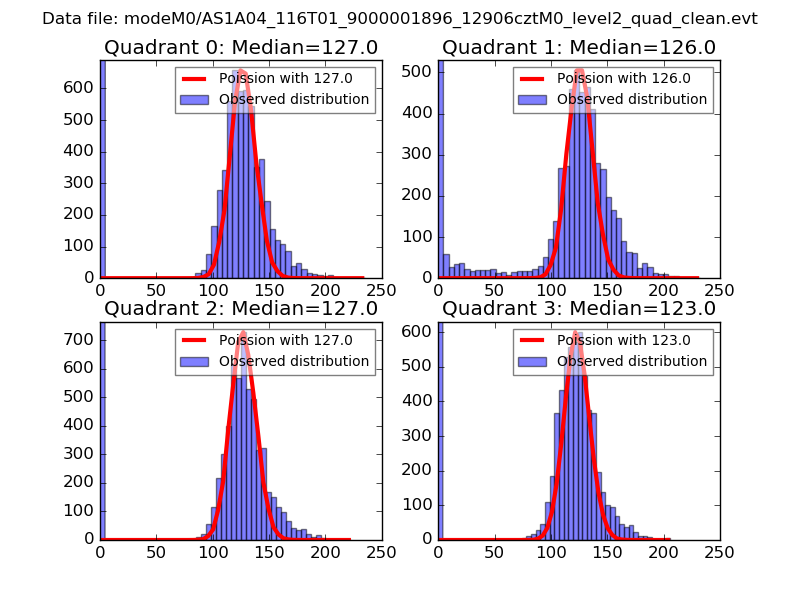 |
 |
| Quadrant-wise count rates Data is divided into 100 sec bins |
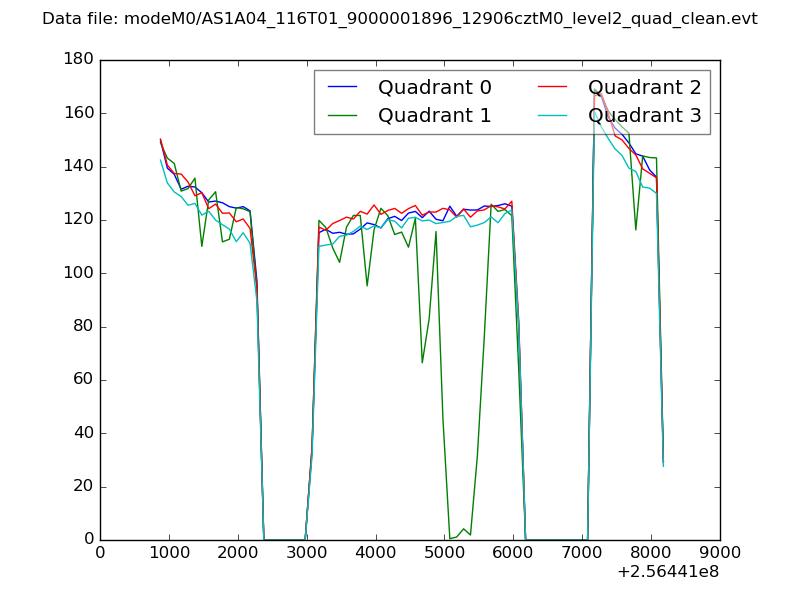 |
|
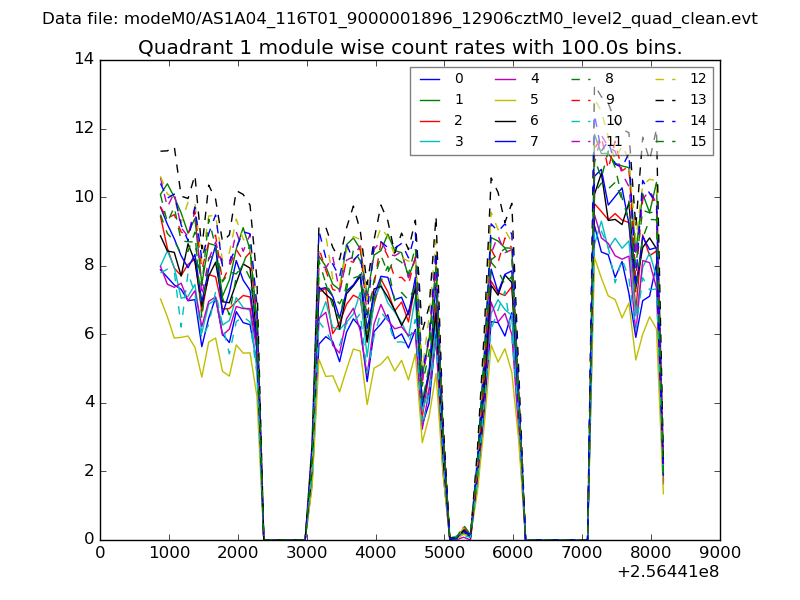
| Module-wise count rates for Quadrant A Data is divided into 100 sec bins |
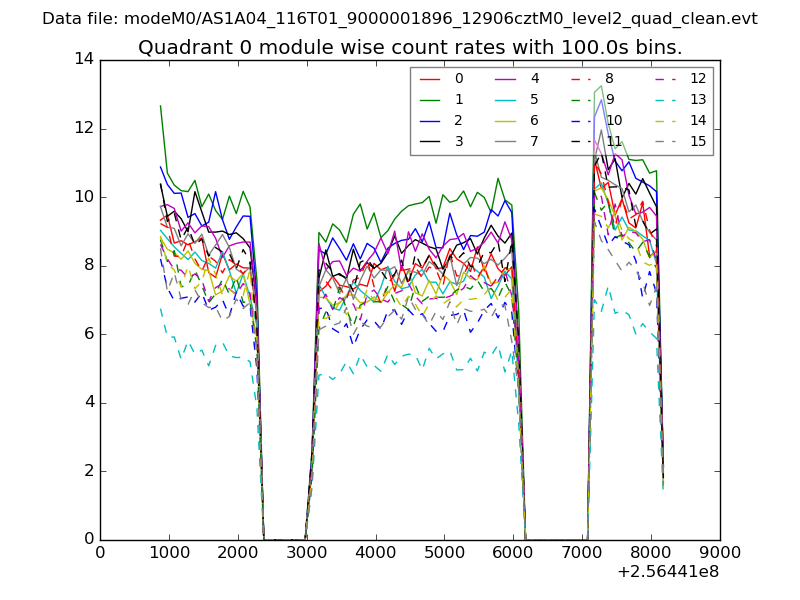 |
 |
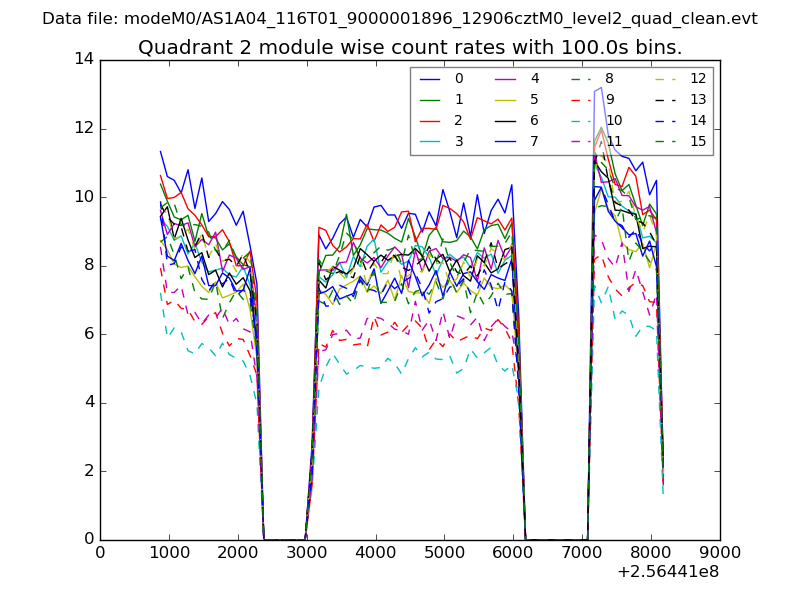
| Module-wise count rates for Quadrant B Data is divided into 100 sec bins |
 |
 |
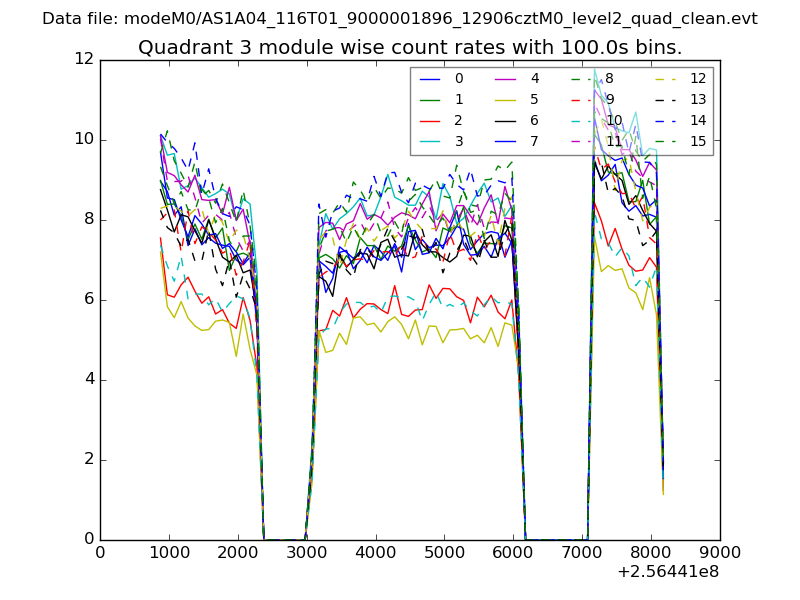
| Module-wise count rates for Quadrant C Data is divided into 100 sec bins |
 |
 |
| Module-wise count rates for Quadrant D Data is divided into 100 sec bins |
 |
 |
| Parameter | Plot |
|---|---|
| CZT HV Monitor | 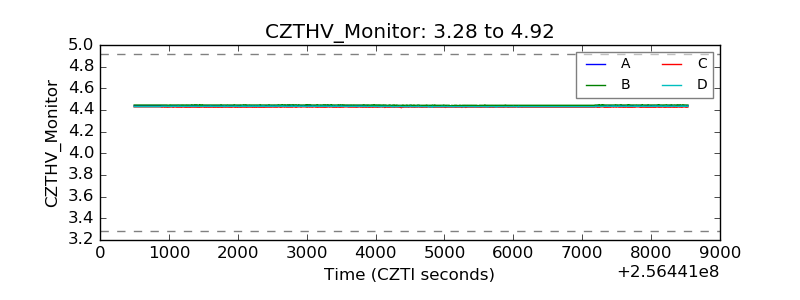 |
| D_VDD | 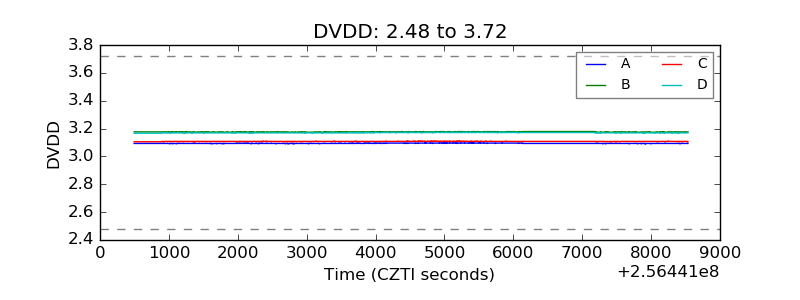 |
| Temperature 1 | 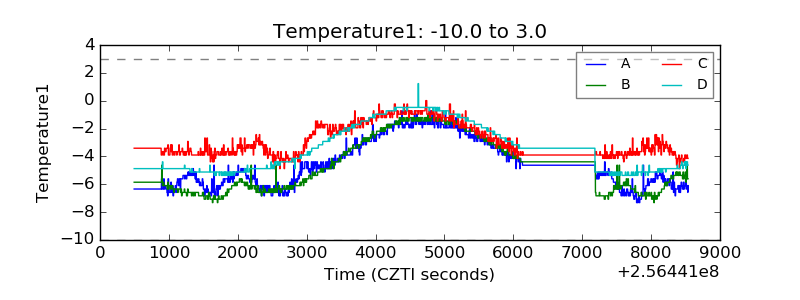 |
| Veto HV Monitor | 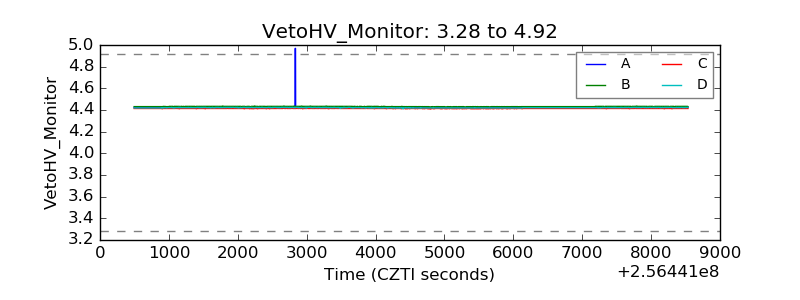 |
| Veto LLD | 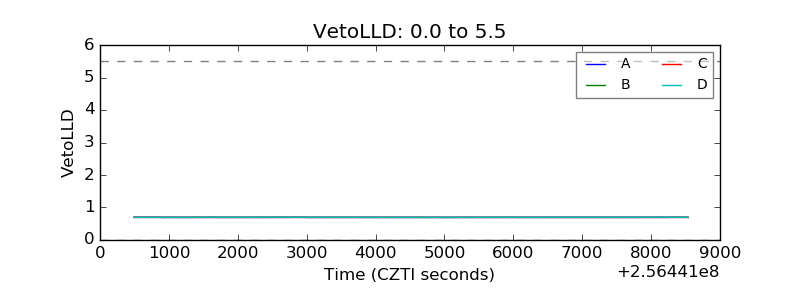 |
| Alpha Counter | 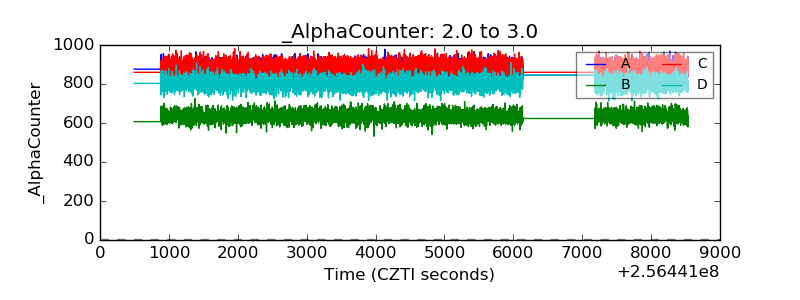 |
| _CPM_Rate | 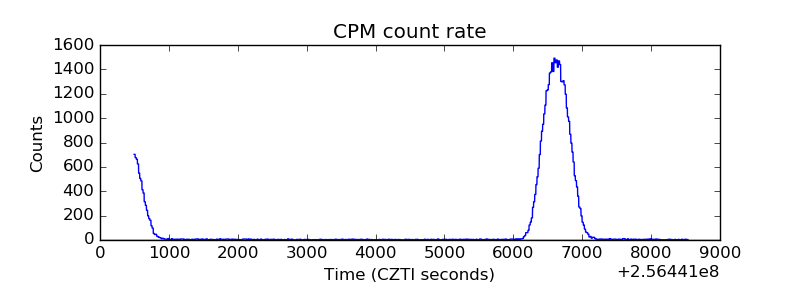 |
| CZT Counter | 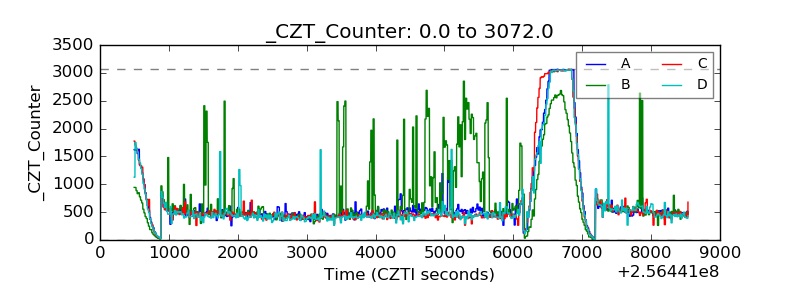 |
| +2.5 Volts monitor |  |
| +5 Volts monitor |  |
| _ROLL_ROT | 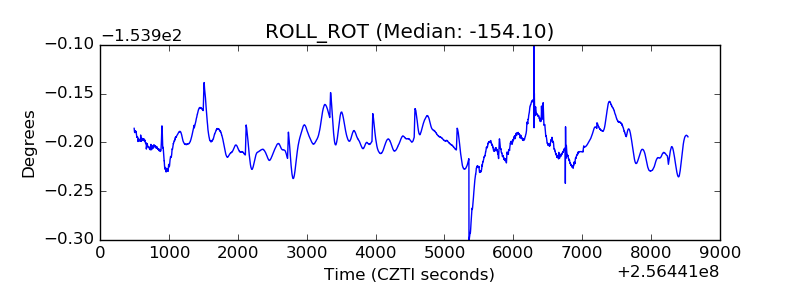 |
| _Roll_DEC | 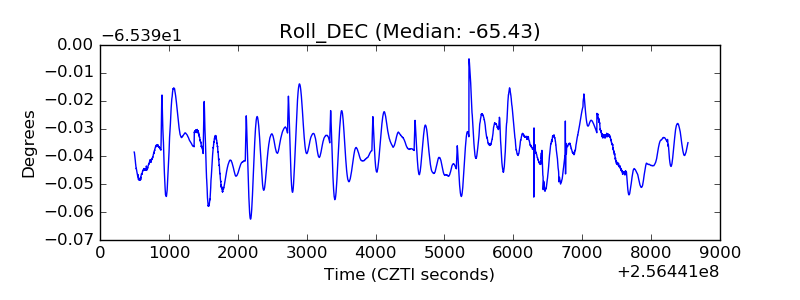 |
| _Roll_RA | 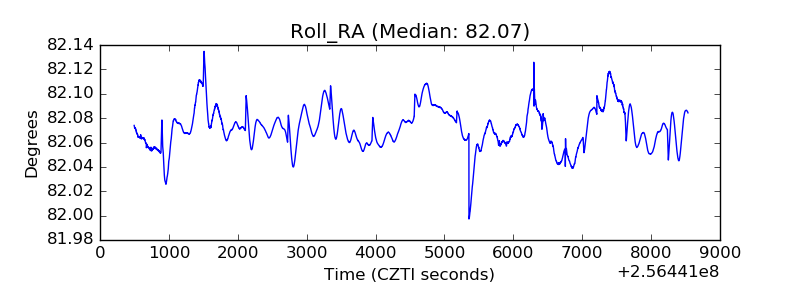 |
| Veto Counter | 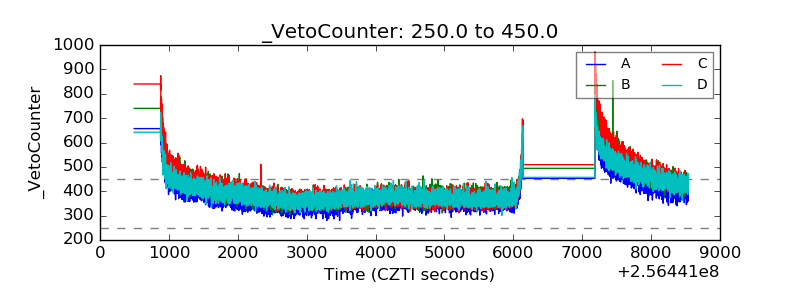 |