| Param | Original file | Final file |
|---|---|---|
| Filename | modeM0/AS1A04_116T01_9000001896_12908cztM0_level2.evt | modeM0/AS1A04_116T01_9000001896_12908cztM0_level2_quad_clean.evt |
| Size (bytes) | 516,029,760 | 100,137,600 |
| Size | 492.1 MB | 95.5 MB |
| Events in quadrant A | 3,469,455 | 666,538 |
| Events in quadrant B | 5,075,676 | 605,520 |
| Events in quadrant C | 3,139,540 | 673,385 |
| Events in quadrant D | 3,509,316 | 640,695 |
| Mode M9 | |||
|---|---|---|---|
| Quadrant | BADHDUFLAG | Total packets | Discarded packets |
| A | 0 | 17 | 0 |
| B | 0 | 17 | 0 |
| C | 0 | 17 | 0 |
| D | 0 | 18 | 0 |
| Mode SS | |||
|---|---|---|---|
| Quadrant | BADHDUFLAG | Total packets | Discarded packets |
| A | 0 | 130 | 0 |
| B | 0 | 130 | 0 |
| C | 0 | 130 | 0 |
| D | 0 | 130 | 0 |
| Mode M0 | |||
|---|---|---|---|
| Quadrant | BADHDUFLAG | Total packets | Discarded packets |
| A | 0 | 14353 | 3 |
| B | 0 | 19108 | 2 |
| C | 0 | 13451 | 2 |
| D | 0 | 14523 | 2 |
| Quadrant | Total seconds | Saturated seconds | Saturation percentage |
|---|---|---|---|
| A | 6393 | 96 | 1.501642% |
| B | 6393 | 923 | 14.437666% |
| C | 6393 | 38 | 0.594400% |
| D | 6393 | 52 | 0.813390% |
Noise dominated data is calculated using 1-second bins in cleaned event files. If a bin has >2000 counts, and if more than 50% of those come from <1% of pixels, then it is considered to be noise-dominated and hence unusable.
| Quadrant | # 1 sec bins | Bins with >0 counts | Bins with >2000 counts | High rate bins dominated by noise | Noise dominated (total time) | Noise dominated (detector-on time) | Marked lightcurve |
|---|---|---|---|---|---|---|---|
| A | 7564 | 6395 | 38 | 38 | 0.50% | 0.59% |  |
| B | 7564 | 6395 | 534 | 534 | 7.06% | 8.35% | 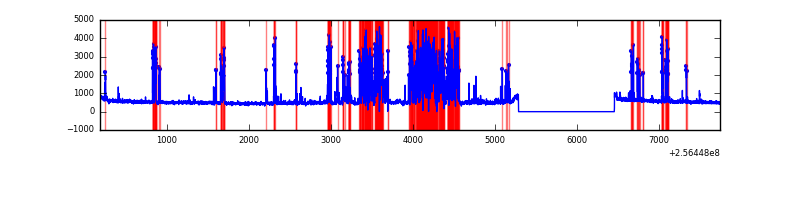 |
| C | 7564 | 6395 | 0 | 0 | 0.00% | 0.00% | 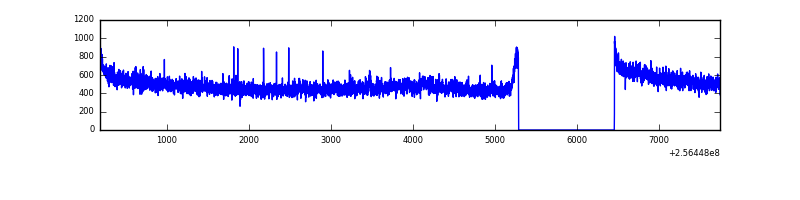 |
| D | 7564 | 6395 | 10 | 10 | 0.13% | 0.16% | 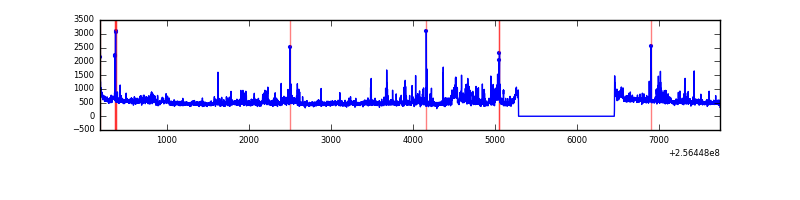 |
Top three noisy pixels from each quadrant. If the there are fewer than three noisy pixels in the level2.evt file, extra rows are filled as -1
| Pixel properties | Quadrant properties | ||||||
|---|---|---|---|---|---|---|---|
| Quadrant | DetID | PixID | Counts | Sigma | Mean | Median | Sigma |
| A | 12 | 189 | 212886 | 1311.9 | 799 | 783 | 161.7 |
| A | 15 | 174 | 124970 | 768.12 | 799 | 783 | 161.7 |
| A | 1 | 162 | 27124 | 162.92 | 799 | 783 | 161.7 |
| B | 4 | 239 | 2068771 | 15164.15 | 738 | 721 | 136.4 |
| B | 3 | 209 | 65685 | 476.35 | 738 | 721 | 136.4 |
| B | 0 | 214 | 22362 | 158.68 | 738 | 721 | 136.4 |
| C | 4 | 112 | 68823 | 376.89 | 787 | 791 | 180.5 |
| C | 13 | 61 | 5917 | 28.4 | 787 | 791 | 180.5 |
| C | 12 | 4 | 3731 | 16.29 | 787 | 791 | 180.5 |
| D | 1 | 52 | 441784 | 2388.15 | 779 | 759 | 184.7 |
| D | 13 | 104 | 43762 | 232.86 | 779 | 759 | 184.7 |
| D | 8 | 195 | 37536 | 199.15 | 779 | 759 | 184.7 |
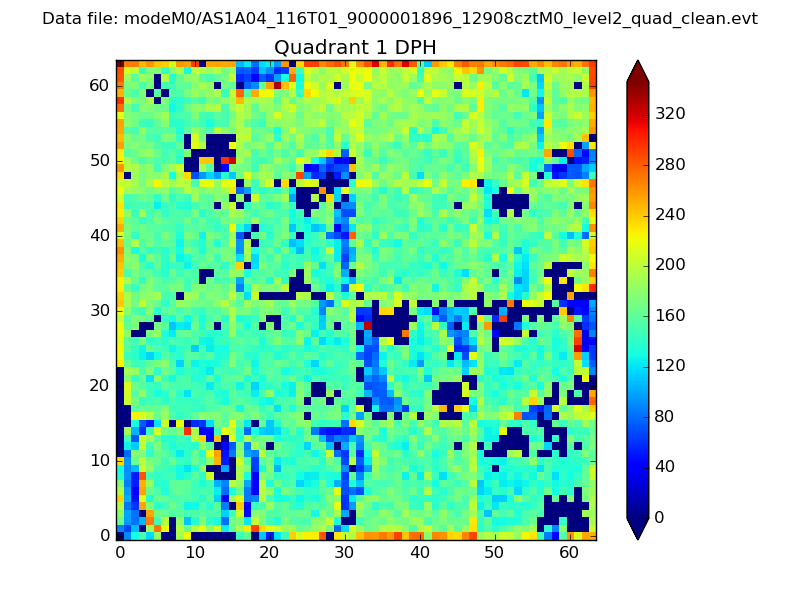
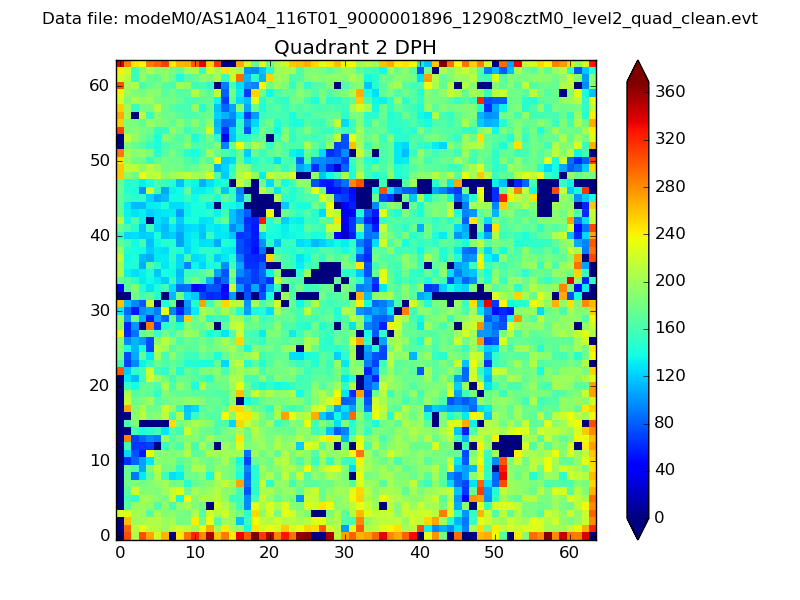
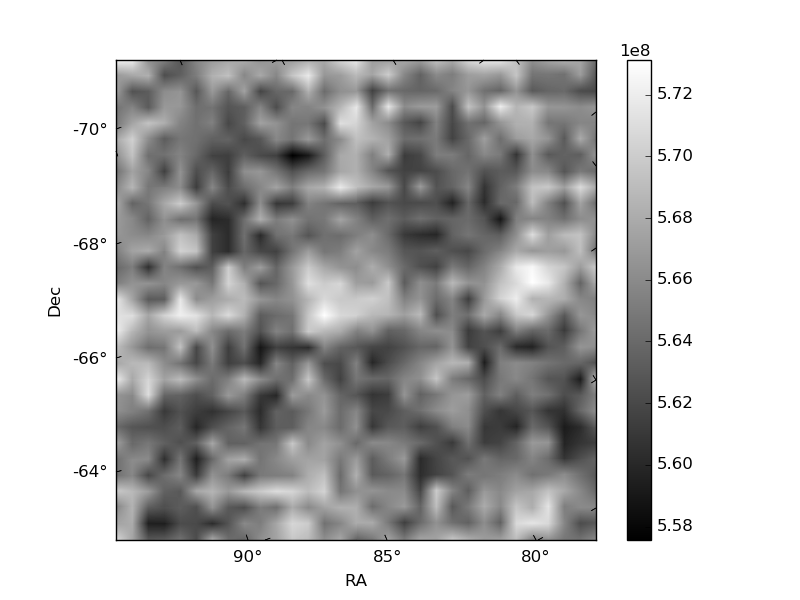
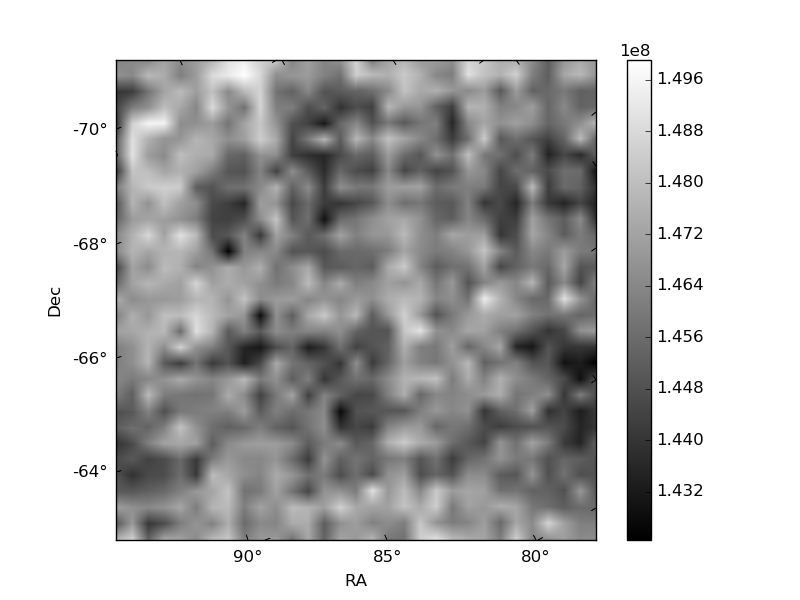
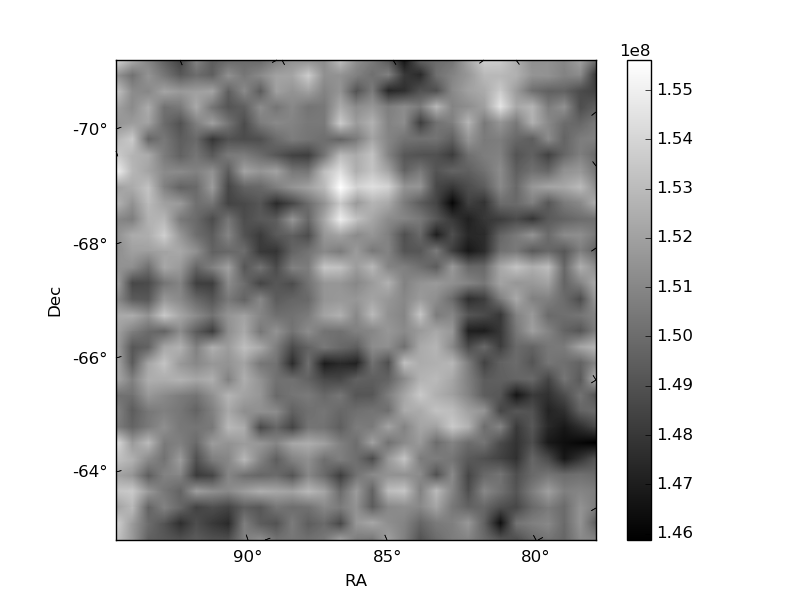
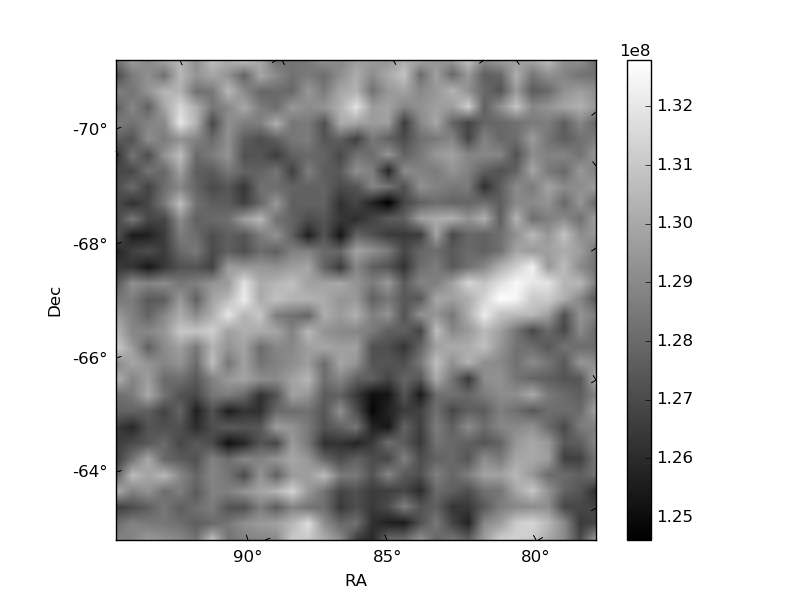
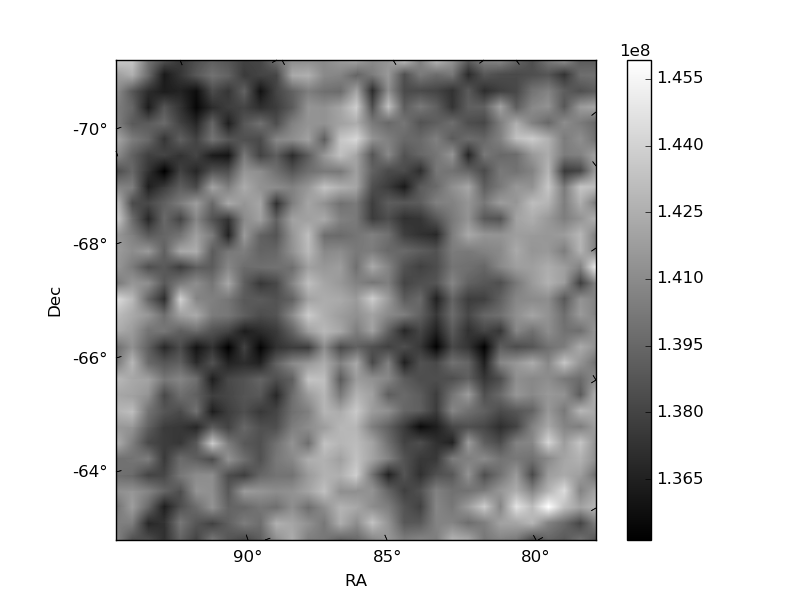
Histogram calculated using DETX and DETY for each event in the final _common_clean file
| Quadrant A | 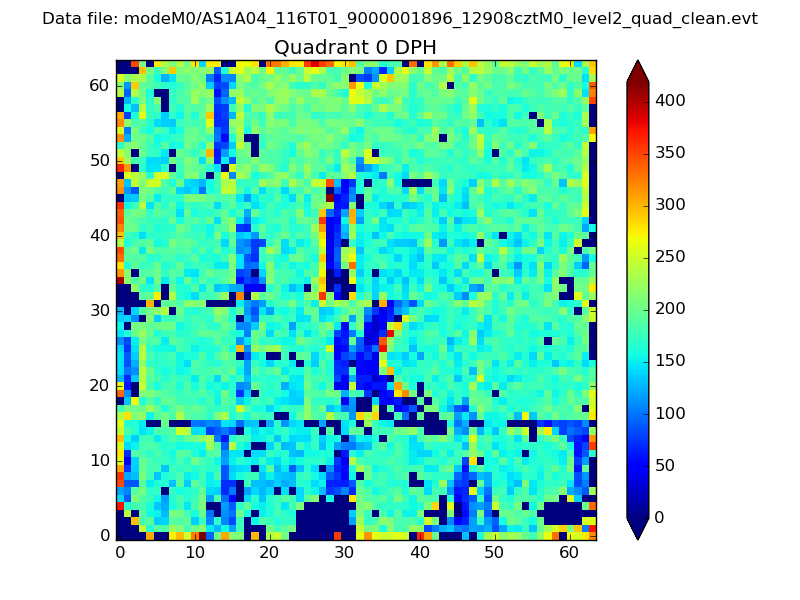 |
 |
Quadrant B |
|---|---|---|---|
| Quadrant D | 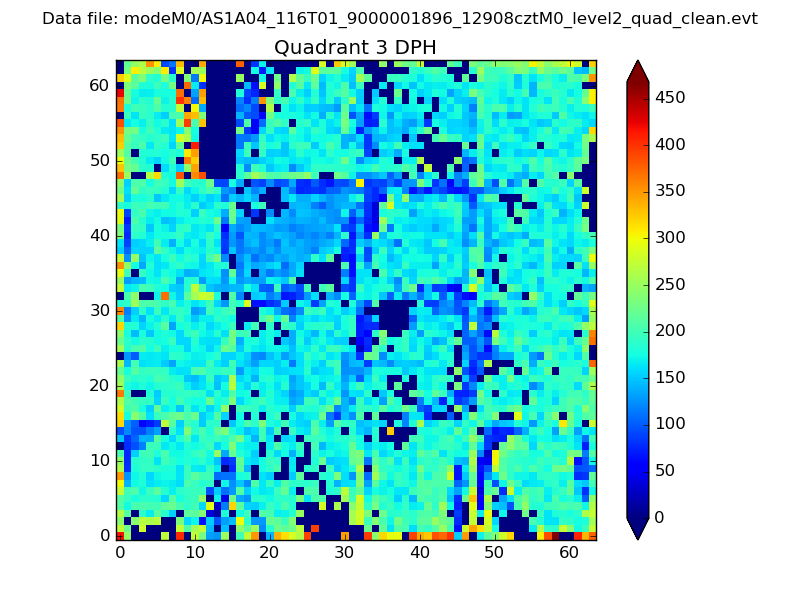 |
 |
Quadrant C |
| Plot type | Count rate plots | Images |
|---|---|---|
| Comparison with Poisson distribution Blue bars denote a histogram of data divided into 1 sec bins. Red curve is a Poisson curve with rate = median count rate of data. |
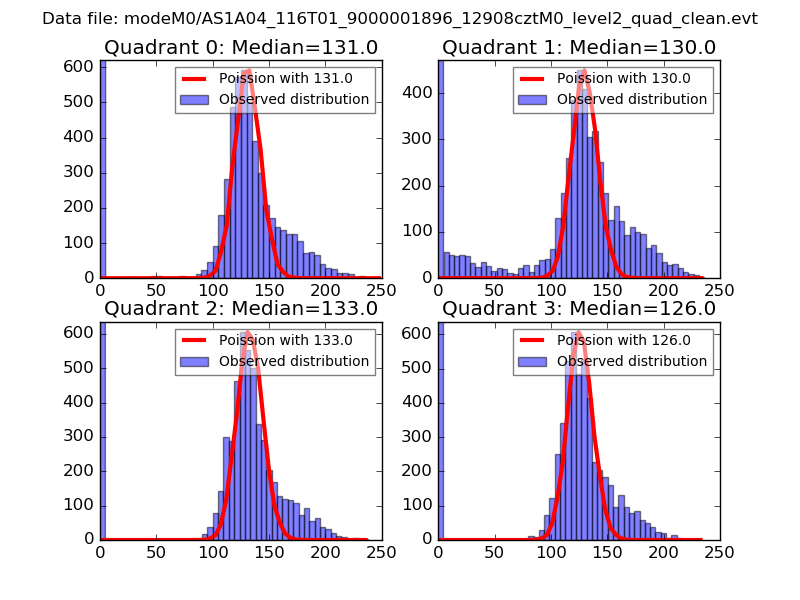 |
 |
| Quadrant-wise count rates Data is divided into 100 sec bins |
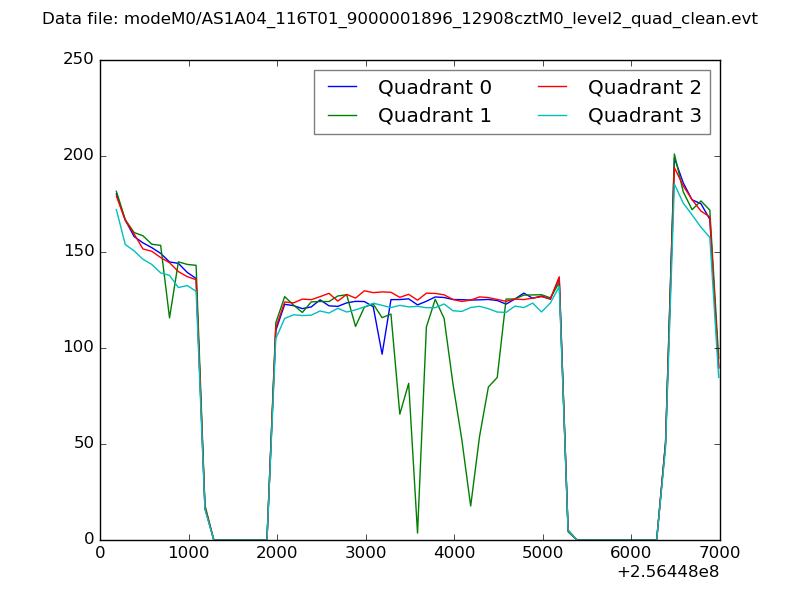 |
|
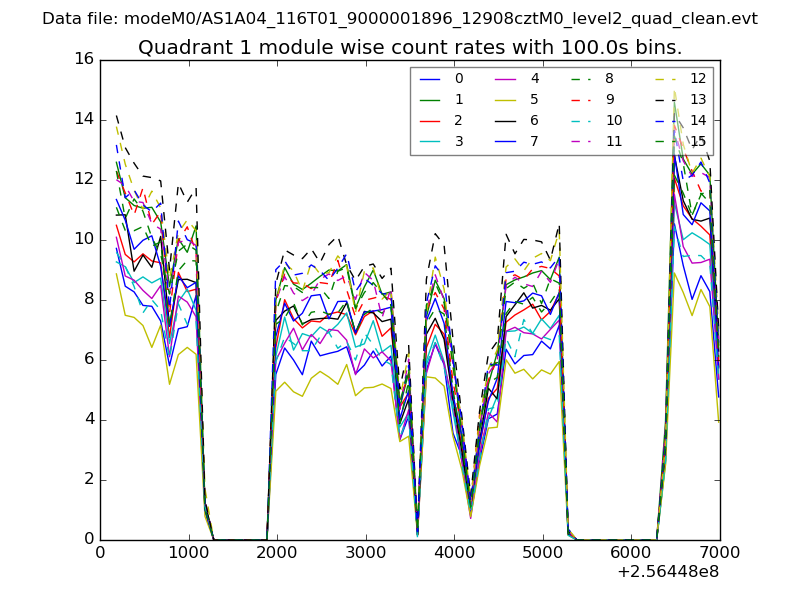
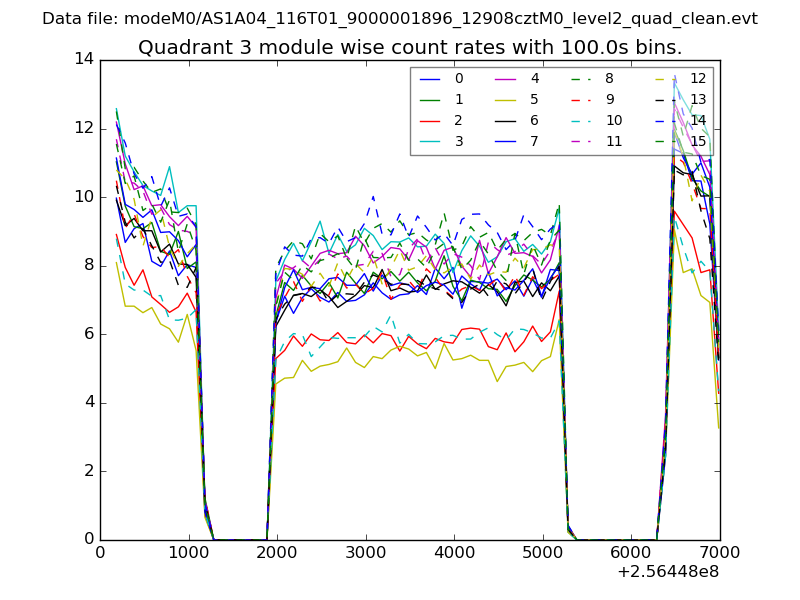
| Module-wise count rates for Quadrant A Data is divided into 100 sec bins |
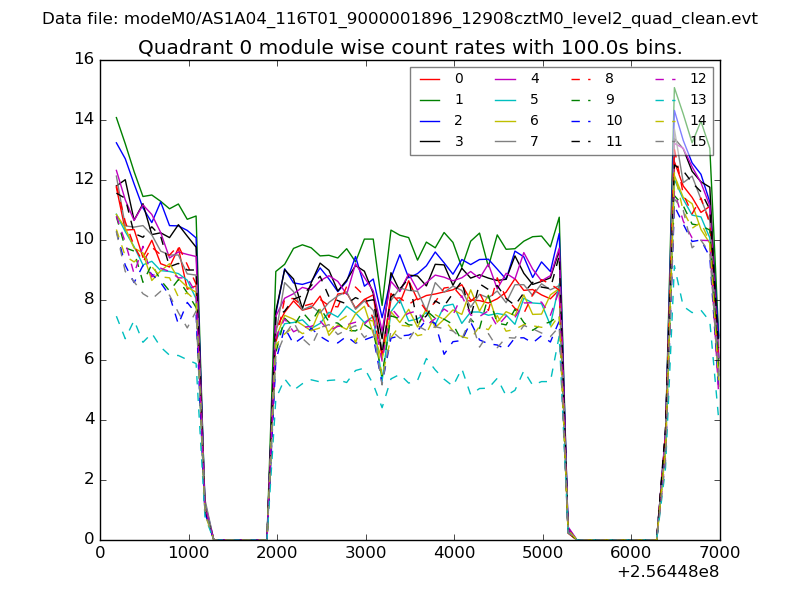 |
 |
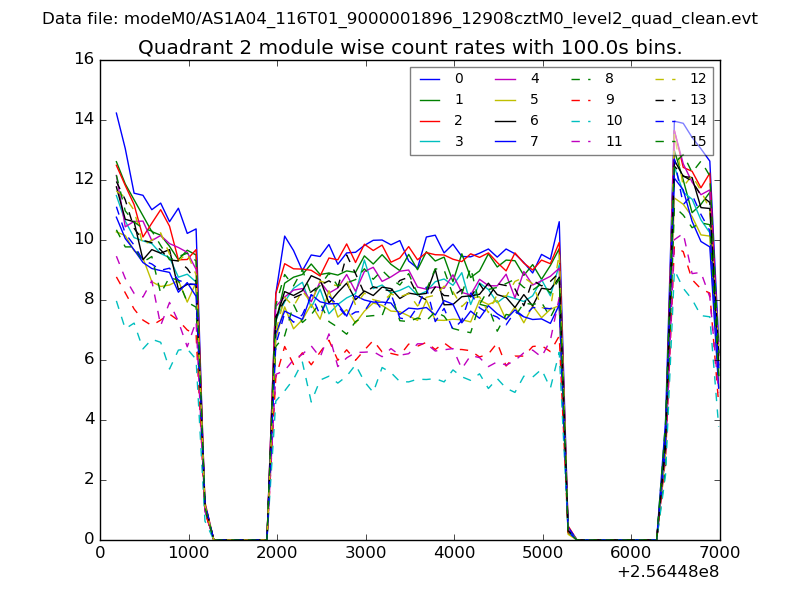
| Module-wise count rates for Quadrant B Data is divided into 100 sec bins |
 |
 |
| Module-wise count rates for Quadrant C Data is divided into 100 sec bins |
 |
 |
| Module-wise count rates for Quadrant D Data is divided into 100 sec bins |
 |
 |
| Parameter | Plot |
|---|---|
| CZT HV Monitor | 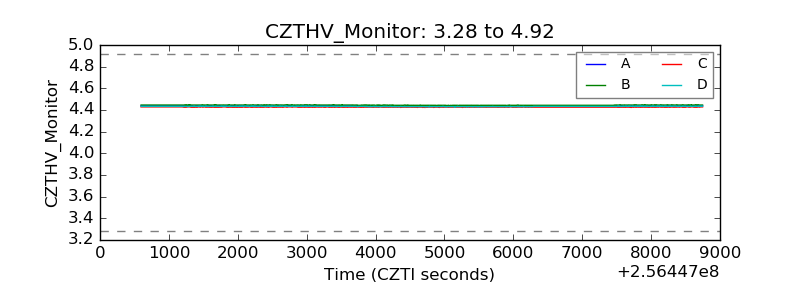 |
| D_VDD | 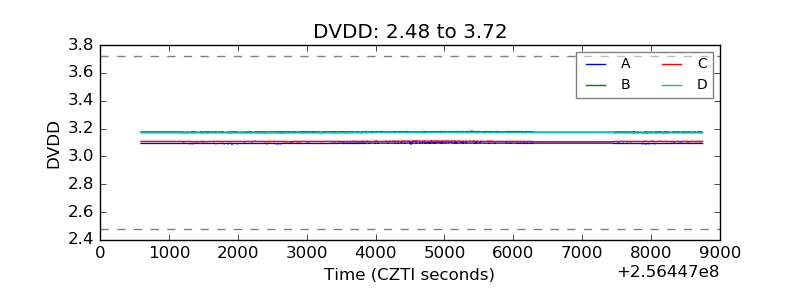 |
| Temperature 1 | 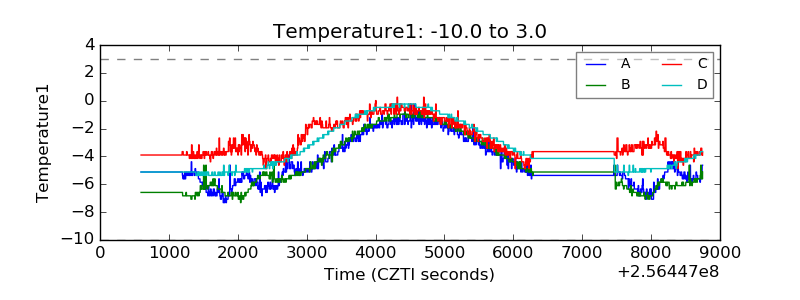 |
| Veto HV Monitor | 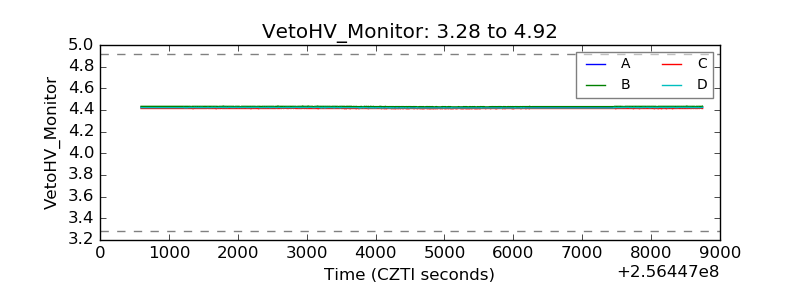 |
| Veto LLD | 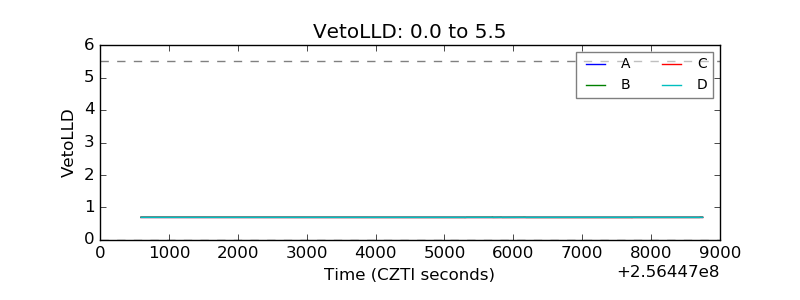 |
| Alpha Counter | 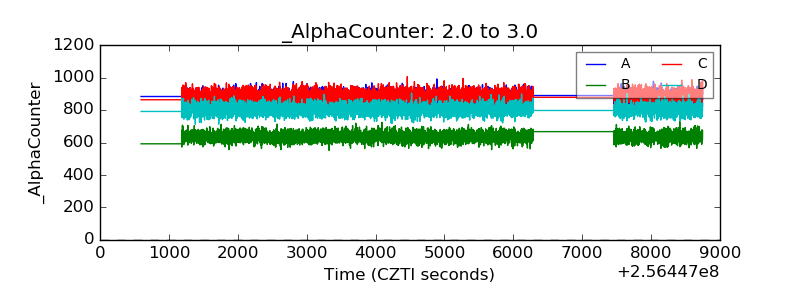 |
| _CPM_Rate | 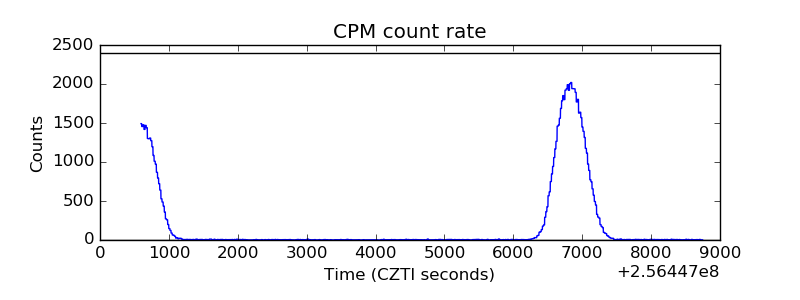 |
| CZT Counter | 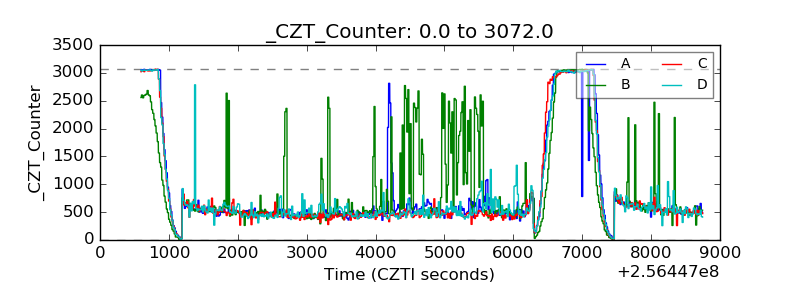 |
| +2.5 Volts monitor |  |
| +5 Volts monitor |  |
| _ROLL_ROT | 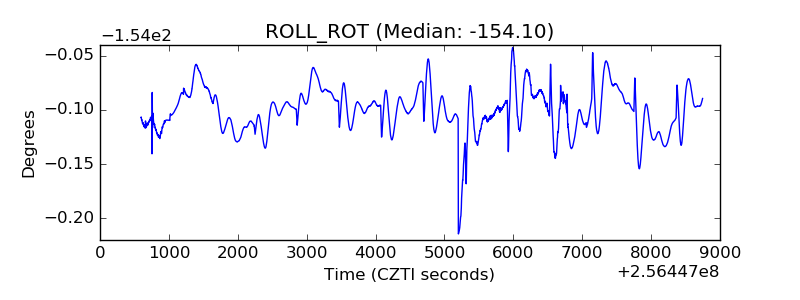 |
| _Roll_DEC | 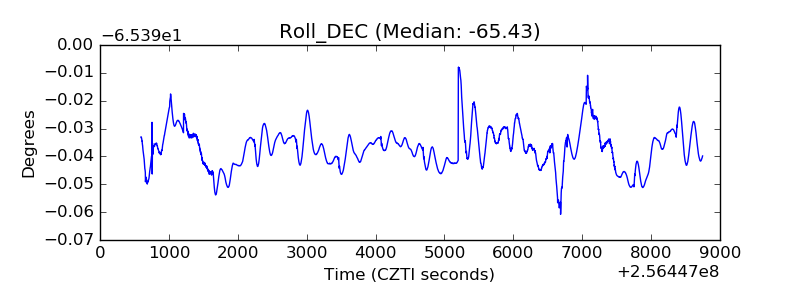 |
| _Roll_RA | 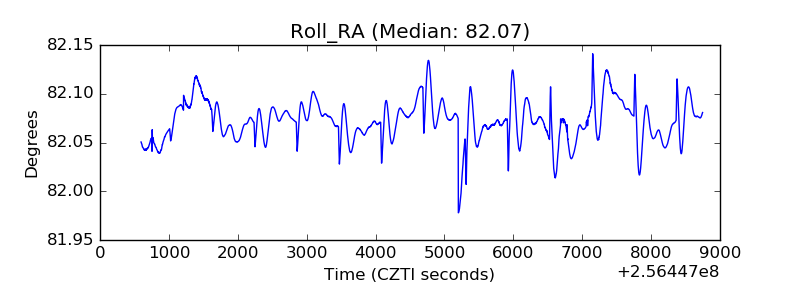 |
| Veto Counter | 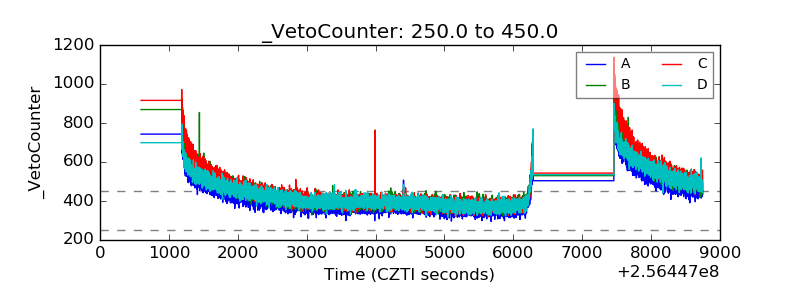 |