| Param | Original file | Final file |
|---|---|---|
| Filename | modeM0/AS1A04_116T01_9000001896_12909cztM0_level2.evt | modeM0/AS1A04_116T01_9000001896_12909cztM0_level2_quad_clean.evt |
| Size (bytes) | 503,784,000 | 91,010,880 |
| Size | 480.4 MB | 86.8 MB |
| Events in quadrant A | 3,172,282 | 607,357 |
| Events in quadrant B | 5,091,057 | 533,514 |
| Events in quadrant C | 2,979,316 | 616,200 |
| Events in quadrant D | 3,608,138 | 580,697 |
| Mode M9 | |||
|---|---|---|---|
| Quadrant | BADHDUFLAG | Total packets | Discarded packets |
| A | 0 | 13 | 0 |
| B | 0 | 13 | 0 |
| C | 0 | 13 | 0 |
| D | 0 | 13 | 0 |
| Mode SS | |||
|---|---|---|---|
| Quadrant | BADHDUFLAG | Total packets | Discarded packets |
| A | 0 | 120 | 0 |
| B | 0 | 120 | 0 |
| C | 0 | 120 | 0 |
| D | 0 | 120 | 0 |
| Mode M0 | |||
|---|---|---|---|
| Quadrant | BADHDUFLAG | Total packets | Discarded packets |
| A | 0 | 13116 | 2 |
| B | 0 | 19003 | 1 |
| C | 0 | 12791 | 1 |
| D | 0 | 14605 | 1 |
| Quadrant | Total seconds | Saturated seconds | Saturation percentage |
|---|---|---|---|
| A | 5989 | 53 | 0.884956% |
| B | 5989 | 1051 | 17.548840% |
| C | 5989 | 55 | 0.918350% |
| D | 5989 | 108 | 1.803306% |
Noise dominated data is calculated using 1-second bins in cleaned event files. If a bin has >2000 counts, and if more than 50% of those come from <1% of pixels, then it is considered to be noise-dominated and hence unusable.
| Quadrant | # 1 sec bins | Bins with >0 counts | Bins with >2000 counts | High rate bins dominated by noise | Noise dominated (total time) | Noise dominated (detector-on time) | Marked lightcurve |
|---|---|---|---|---|---|---|---|
| A | 7260 | 5991 | 0 | 0 | 0.00% | 0.00% | 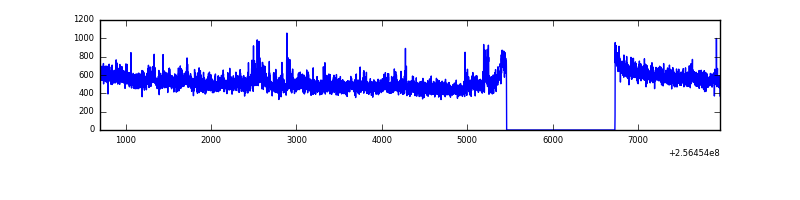 |
| B | 7260 | 5990 | 483 | 483 | 6.65% | 8.06% | 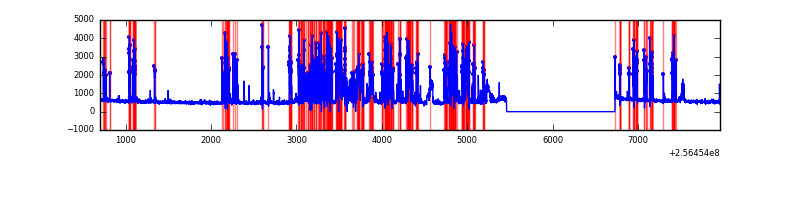 |
| C | 7260 | 5991 | 0 | 0 | 0.00% | 0.00% | 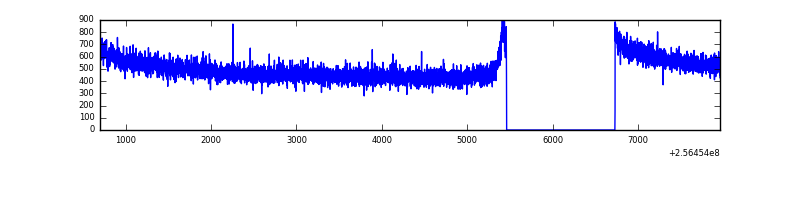 |
| D | 7260 | 5991 | 55 | 55 | 0.76% | 0.92% | 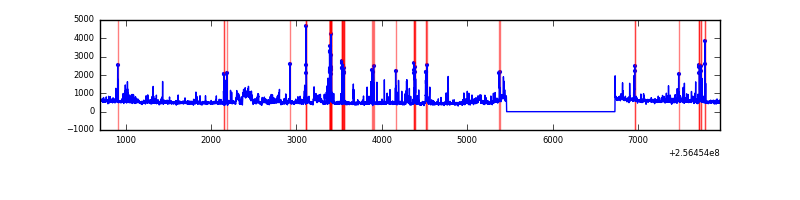 |
Top three noisy pixels from each quadrant. If the there are fewer than three noisy pixels in the level2.evt file, extra rows are filled as -1
| Pixel properties | Quadrant properties | ||||||
|---|---|---|---|---|---|---|---|
| Quadrant | DetID | PixID | Counts | Sigma | Mean | Median | Sigma |
| A | 12 | 189 | 110352 | 706.16 | 779 | 765 | 155.2 |
| A | 1 | 162 | 30825 | 193.7 | 779 | 765 | 155.2 |
| A | 1 | 178 | 14326 | 87.38 | 779 | 765 | 155.2 |
| B | 4 | 239 | 2030603 | 15967.1 | 698 | 683 | 127.1 |
| B | 3 | 64 | 213164 | 1671.35 | 698 | 683 | 127.1 |
| B | 3 | 209 | 61810 | 480.82 | 698 | 683 | 127.1 |
| C | 4 | 112 | 11264 | 61.32 | 760 | 764 | 171.2 |
| C | 13 | 61 | 5629 | 28.41 | 760 | 764 | 171.2 |
| C | 8 | 222 | 2163 | 8.17 | 760 | 764 | 171.2 |
| D | 1 | 52 | 496124 | 2820.64 | 752 | 733 | 175.6 |
| D | 13 | 122 | 88540 | 499.95 | 752 | 733 | 175.6 |
| D | 10 | 157 | 73838 | 416.24 | 752 | 733 | 175.6 |
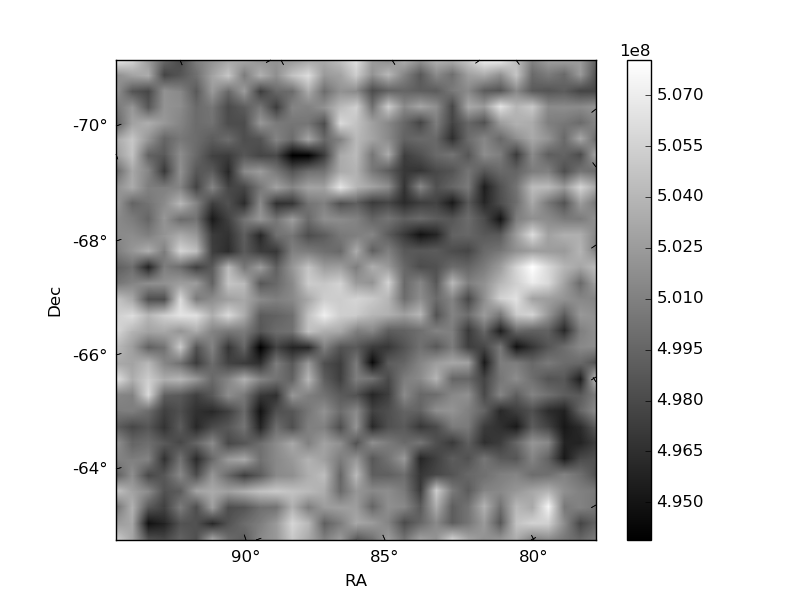
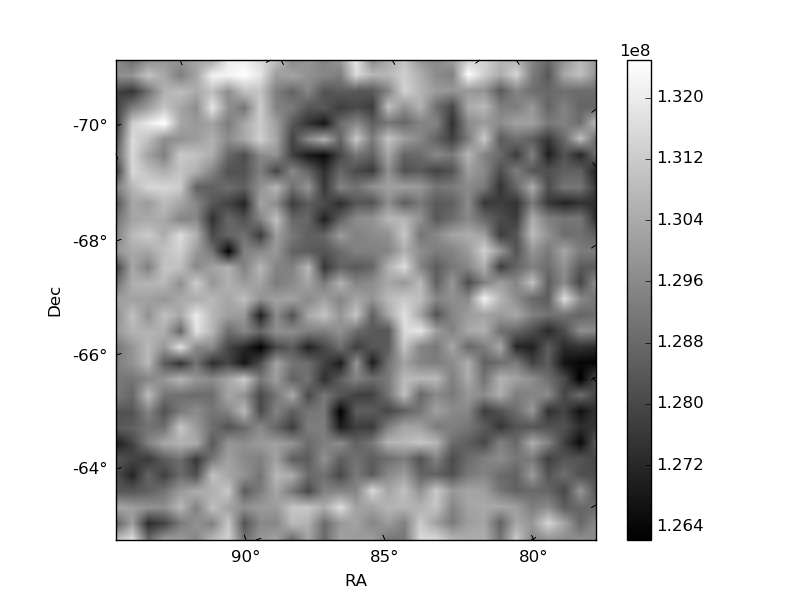
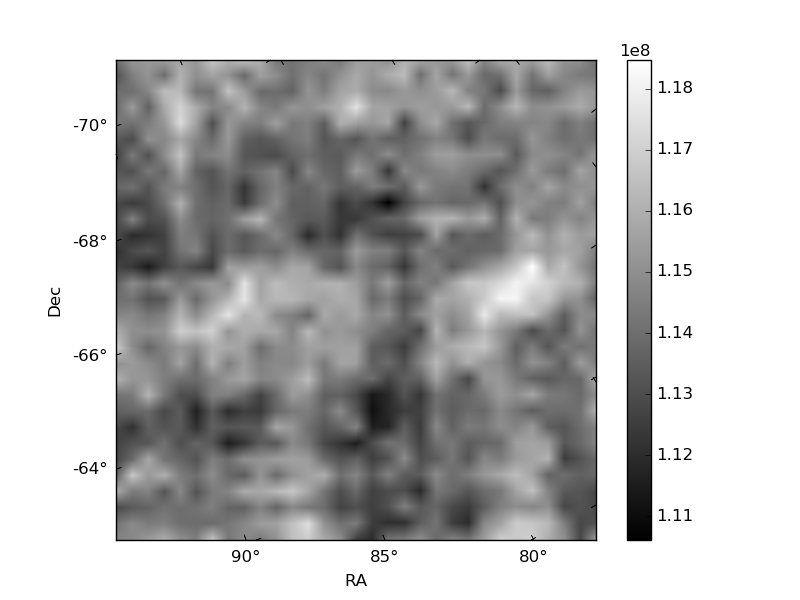
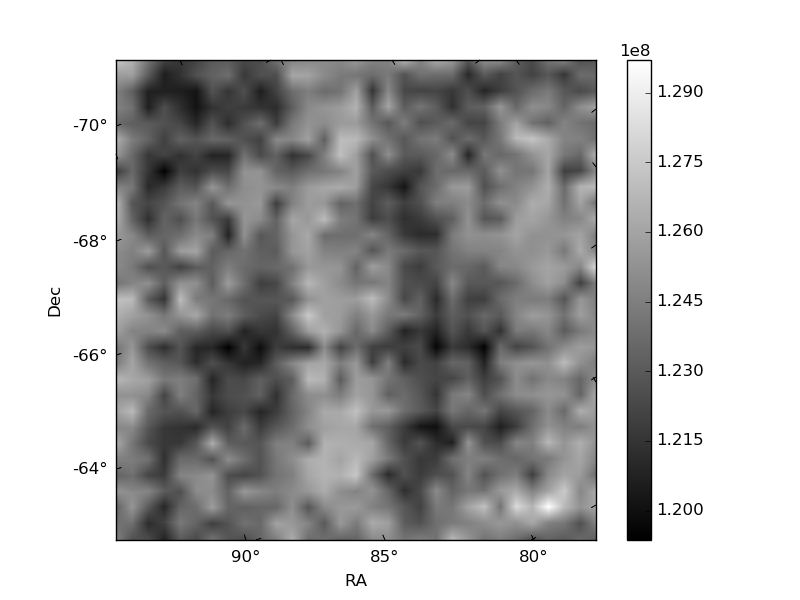
Histogram calculated using DETX and DETY for each event in the final _common_clean file
| Quadrant A | 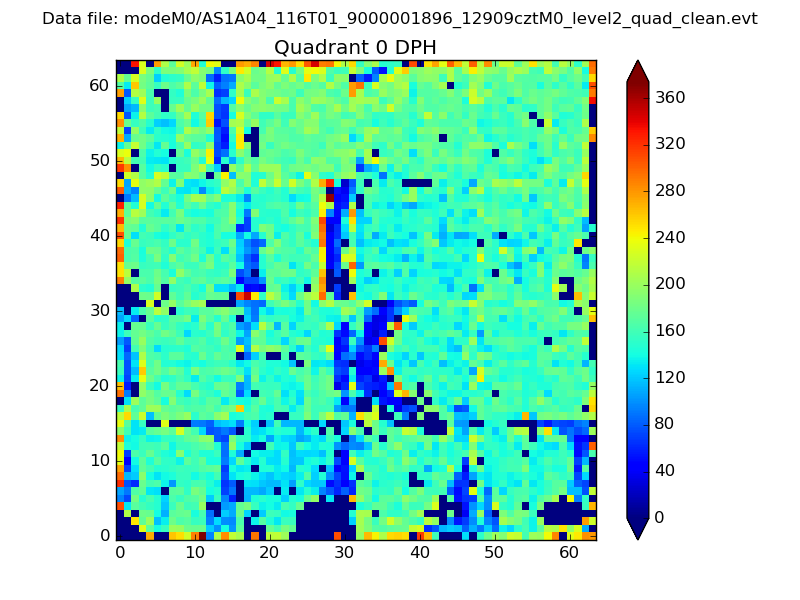 |
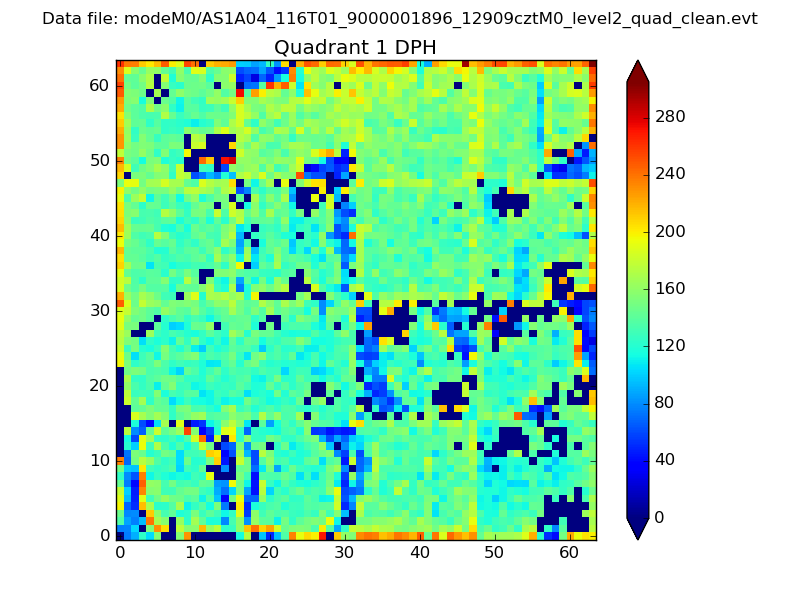 |
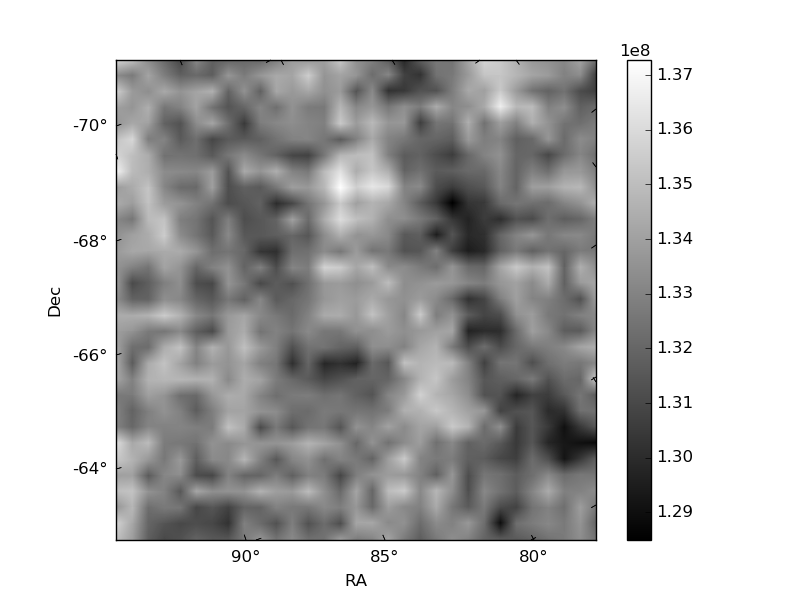
Quadrant B |
|---|---|---|---|
| Quadrant D | 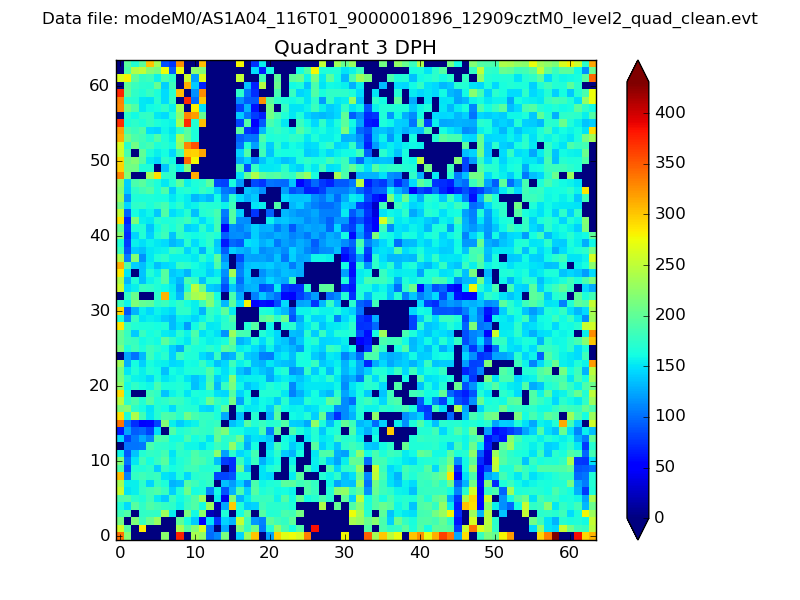 |
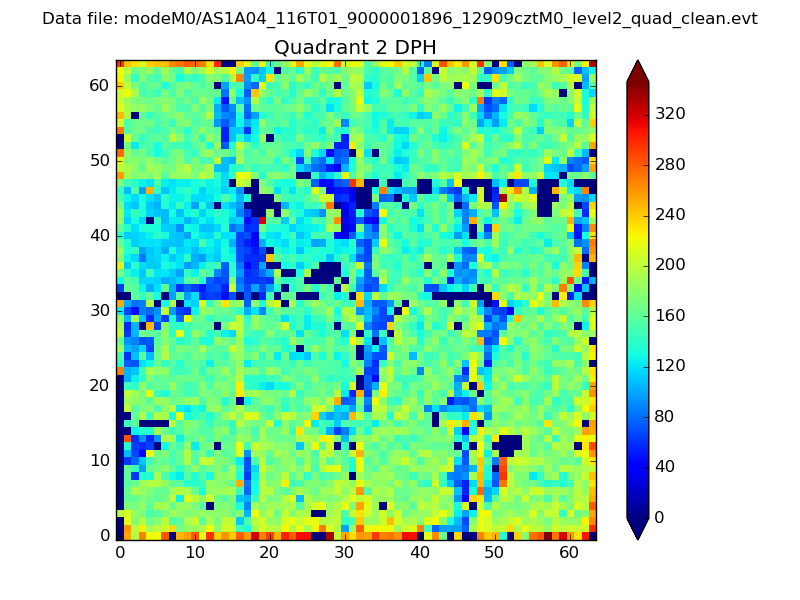 |
Quadrant C |
| Plot type | Count rate plots | Images |
|---|---|---|
| Comparison with Poisson distribution Blue bars denote a histogram of data divided into 1 sec bins. Red curve is a Poisson curve with rate = median count rate of data. |
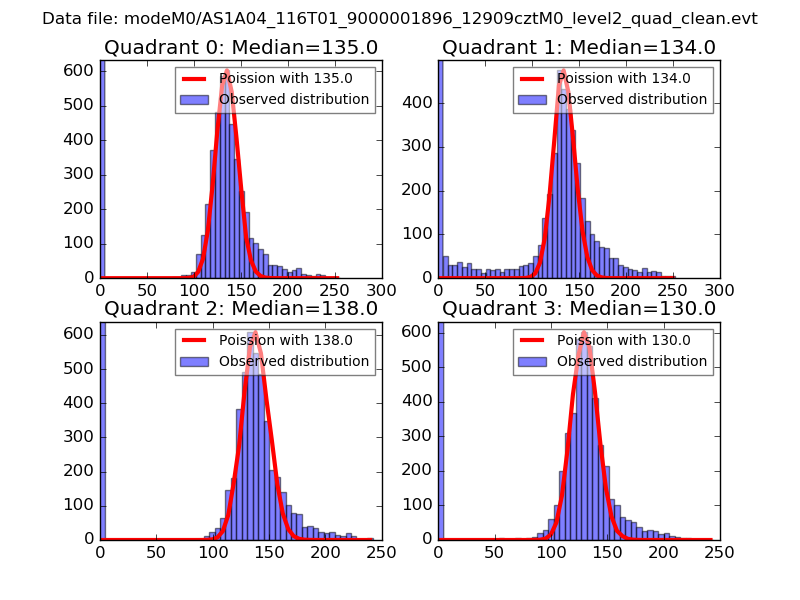 |
 |
| Quadrant-wise count rates Data is divided into 100 sec bins |
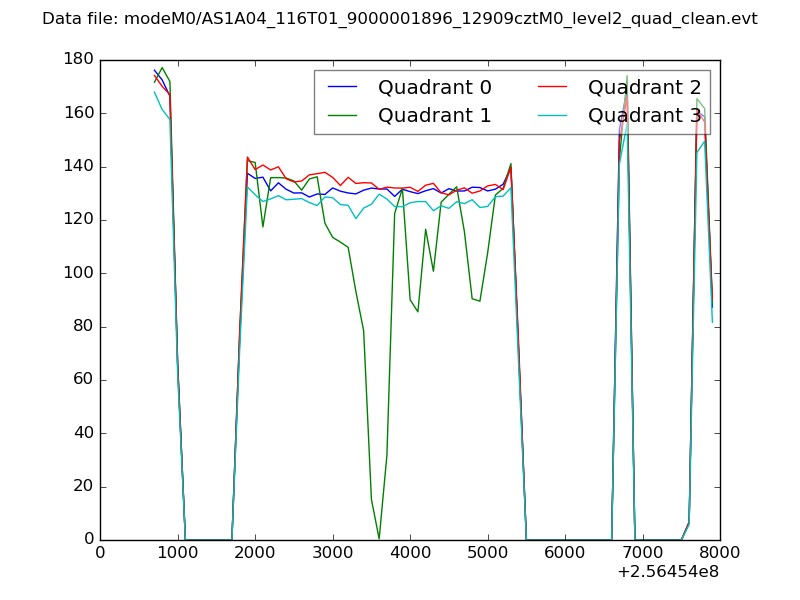 |
|
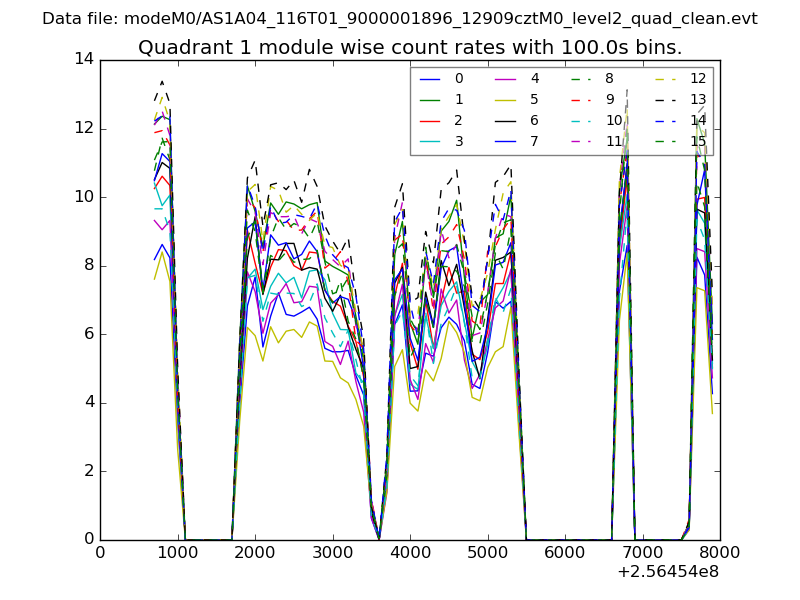
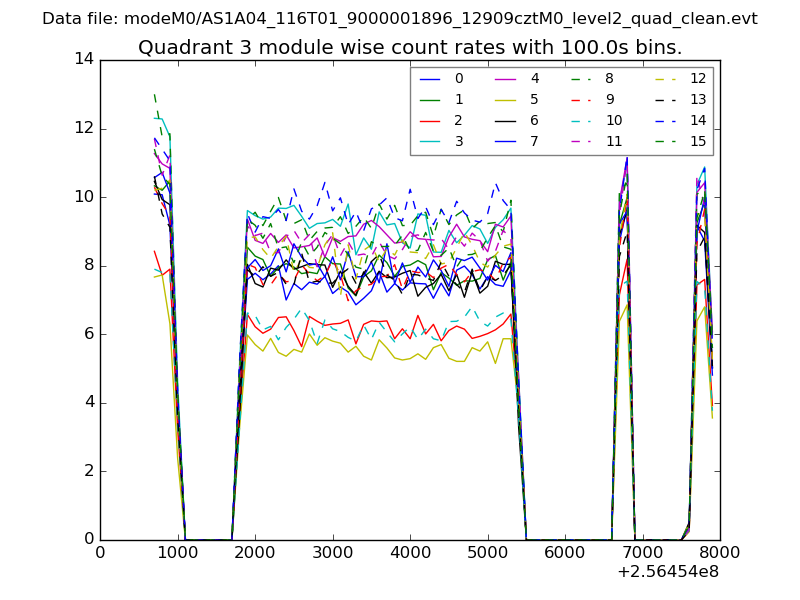
| Module-wise count rates for Quadrant A Data is divided into 100 sec bins |
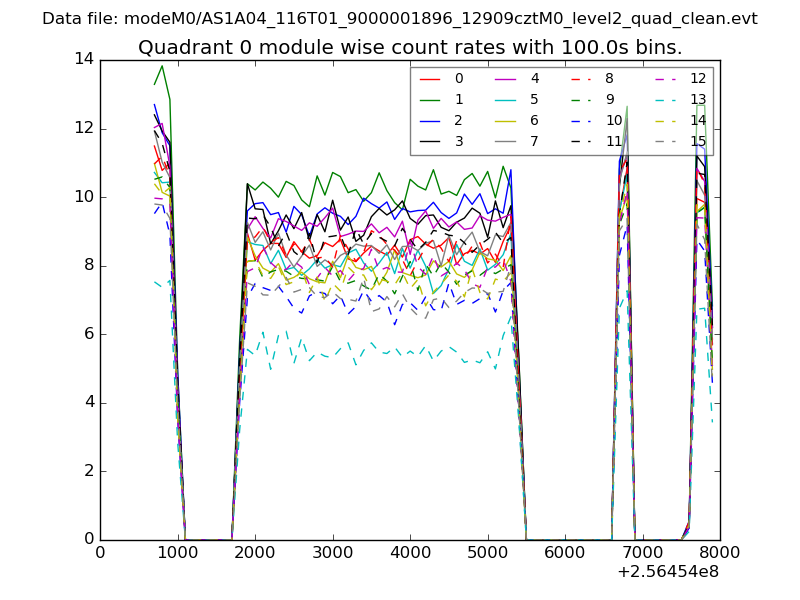 |
 |
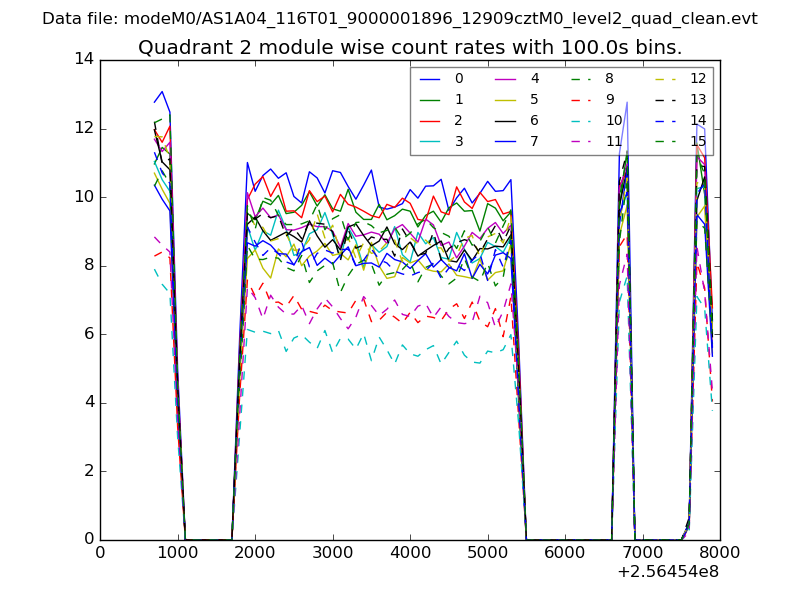
| Module-wise count rates for Quadrant B Data is divided into 100 sec bins |
 |
 |
| Module-wise count rates for Quadrant C Data is divided into 100 sec bins |
 |
 |
| Module-wise count rates for Quadrant D Data is divided into 100 sec bins |
 |
 |
| Parameter | Plot |
|---|---|
| CZT HV Monitor | 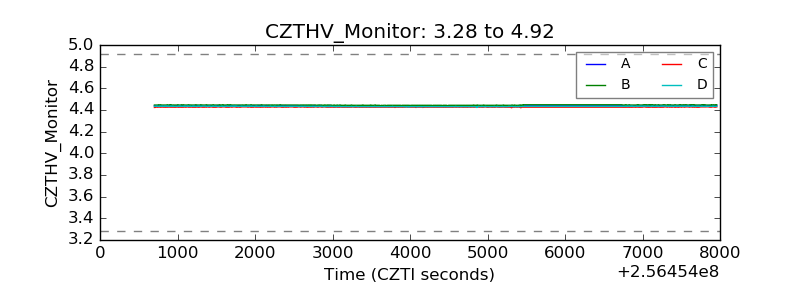 |
| D_VDD | 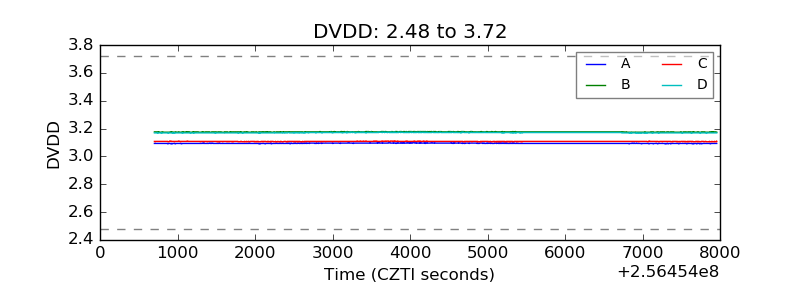 |
| Temperature 1 | 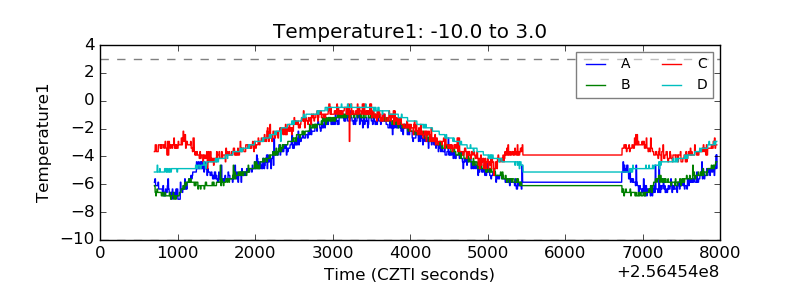 |
| Veto HV Monitor | 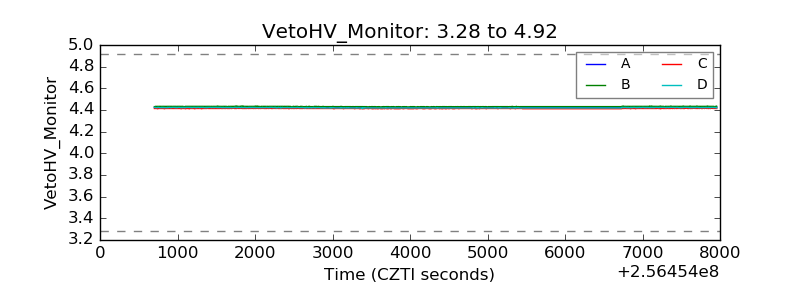 |
| Veto LLD | 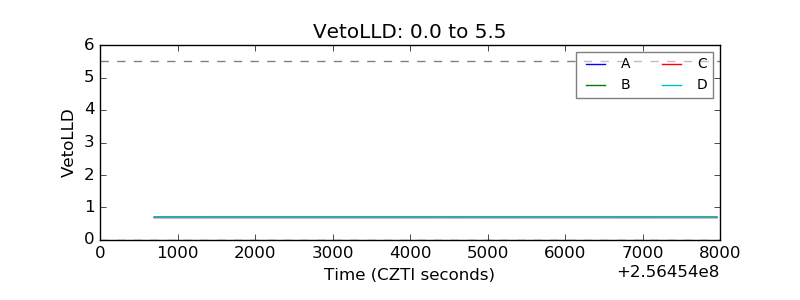 |
| Alpha Counter | 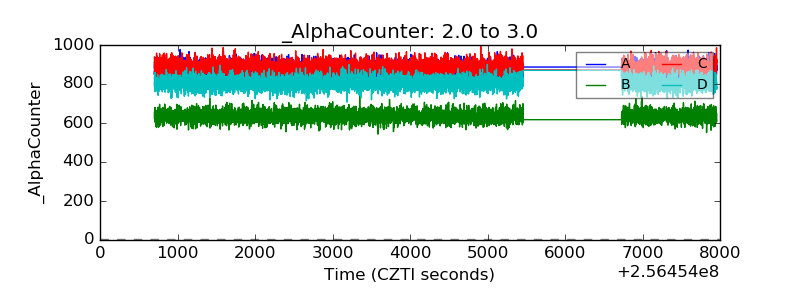 |
| _CPM_Rate | 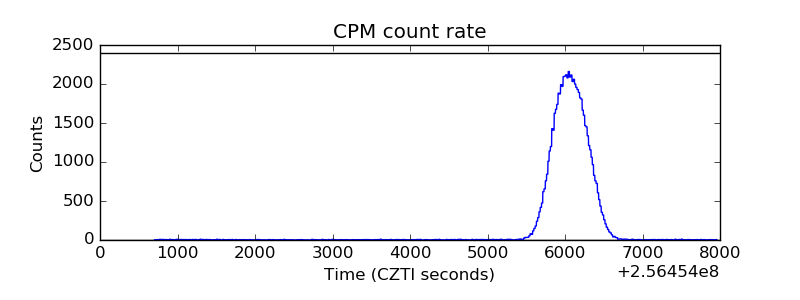 |
| CZT Counter | 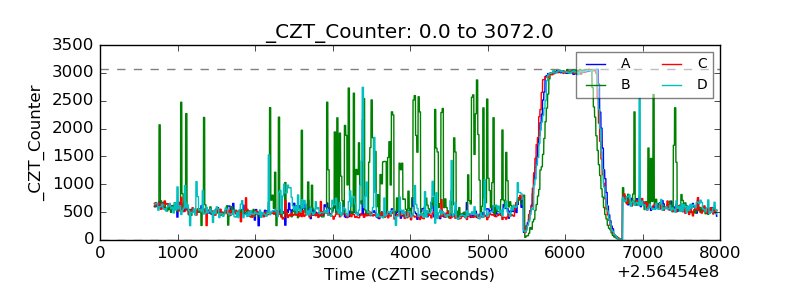 |
| +2.5 Volts monitor | 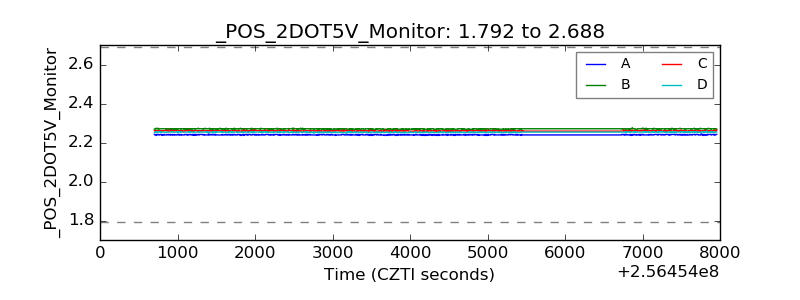 |
| +5 Volts monitor | 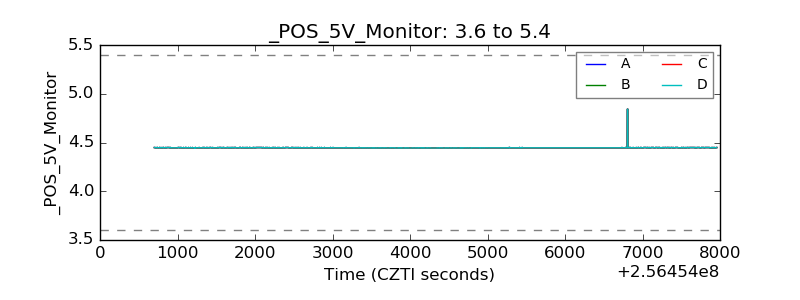 |
| _ROLL_ROT | 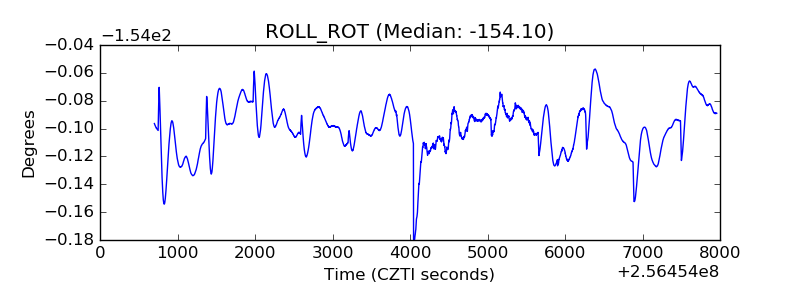 |
| _Roll_DEC | 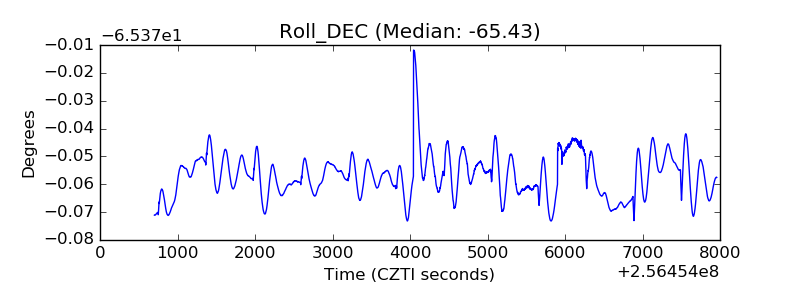 |
| _Roll_RA | 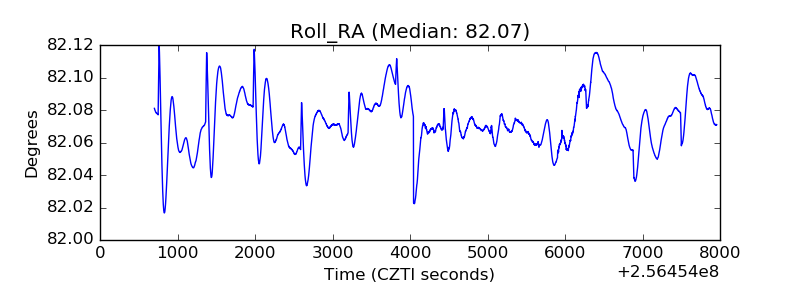 |
| Veto Counter | 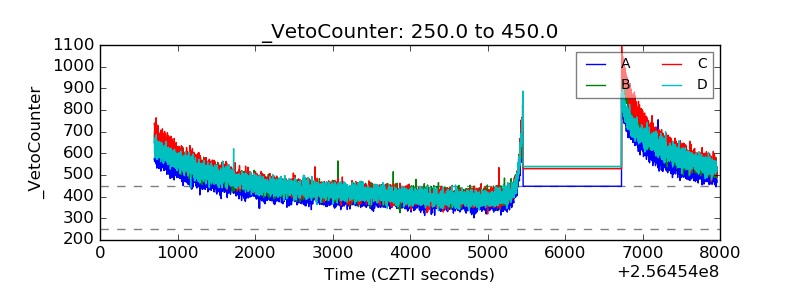 |