| Param | Original file | Final file |
|---|---|---|
| Filename | modeM0/AS1A04_116T01_9000001896_12910cztM0_level2.evt | modeM0/AS1A04_116T01_9000001896_12910cztM0_level2_quad_clean.evt |
| Size (bytes) | 491,152,320 | 99,912,960 |
| Size | 468.4 MB | 95.3 MB |
| Events in quadrant A | 3,072,817 | 672,736 |
| Events in quadrant B | 4,361,644 | 642,355 |
| Events in quadrant C | 2,917,172 | 677,825 |
| Events in quadrant D | 4,131,166 | 629,141 |
| Mode M9 | |||
|---|---|---|---|
| Quadrant | BADHDUFLAG | Total packets | Discarded packets |
| A | 0 | 13 | 0 |
| B | 0 | 13 | 0 |
| C | 0 | 13 | 0 |
| D | 0 | 13 | 0 |
| Mode SS | |||
|---|---|---|---|
| Quadrant | BADHDUFLAG | Total packets | Discarded packets |
| A | 0 | 118 | 0 |
| B | 0 | 118 | 0 |
| C | 0 | 118 | 0 |
| D | 0 | 118 | 0 |
| Mode M0 | |||
|---|---|---|---|
| Quadrant | BADHDUFLAG | Total packets | Discarded packets |
| A | 0 | 12658 | 2 |
| B | 0 | 16624 | 1 |
| C | 0 | 12337 | 1 |
| D | 0 | 15967 | 1 |
| Quadrant | Total seconds | Saturated seconds | Saturation percentage |
|---|---|---|---|
| A | 5772 | 98 | 1.697852% |
| B | 5772 | 601 | 10.412335% |
| C | 5772 | 84 | 1.455301% |
| D | 5772 | 282 | 4.885655% |
Noise dominated data is calculated using 1-second bins in cleaned event files. If a bin has >2000 counts, and if more than 50% of those come from <1% of pixels, then it is considered to be noise-dominated and hence unusable.
| Quadrant | # 1 sec bins | Bins with >0 counts | Bins with >2000 counts | High rate bins dominated by noise | Noise dominated (total time) | Noise dominated (detector-on time) | Marked lightcurve |
|---|---|---|---|---|---|---|---|
| A | 7083 | 5775 | 2 | 2 | 0.03% | 0.03% | 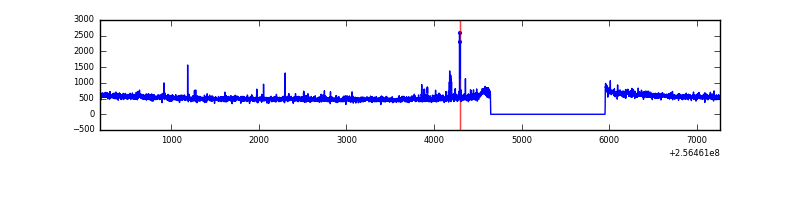 |
| B | 7083 | 5775 | 297 | 297 | 4.19% | 5.14% | 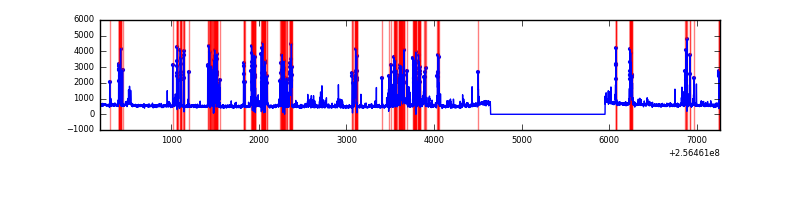 |
| C | 7083 | 5775 | 0 | 0 | 0.00% | 0.00% | 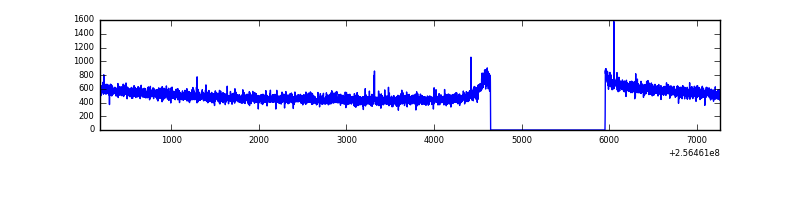 |
| D | 7083 | 5775 | 166 | 166 | 2.34% | 2.87% | 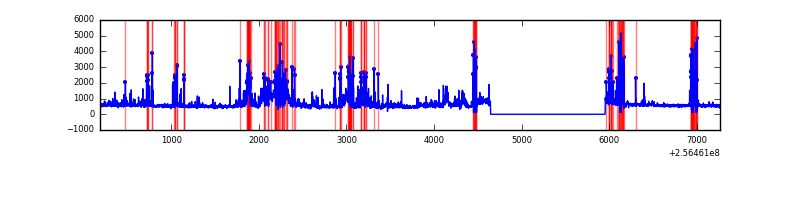 |
Top three noisy pixels from each quadrant. If the there are fewer than three noisy pixels in the level2.evt file, extra rows are filled as -1
| Pixel properties | Quadrant properties | ||||||
|---|---|---|---|---|---|---|---|
| Quadrant | DetID | PixID | Counts | Sigma | Mean | Median | Sigma |
| A | 12 | 189 | 29931 | 192.15 | 770 | 756 | 151.8 |
| A | 13 | 248 | 23197 | 147.8 | 770 | 756 | 151.8 |
| A | 1 | 162 | 21048 | 133.64 | 770 | 756 | 151.8 |
| B | 4 | 239 | 1239499 | 9365.11 | 732 | 717 | 132.3 |
| B | 3 | 64 | 103700 | 778.54 | 732 | 717 | 132.3 |
| B | 3 | 209 | 72567 | 543.18 | 732 | 717 | 132.3 |
| C | 13 | 61 | 5447 | 28.08 | 746 | 751 | 167.2 |
| C | 14 | 234 | 3553 | 16.76 | 746 | 751 | 167.2 |
| C | 8 | 222 | 2434 | 10.07 | 746 | 751 | 167.2 |
| D | 1 | 52 | 1212932 | 6948.55 | 735 | 717 | 174.5 |
| D | 2 | 14 | 47557 | 268.49 | 735 | 717 | 174.5 |
| D | 8 | 195 | 29844 | 166.96 | 735 | 717 | 174.5 |
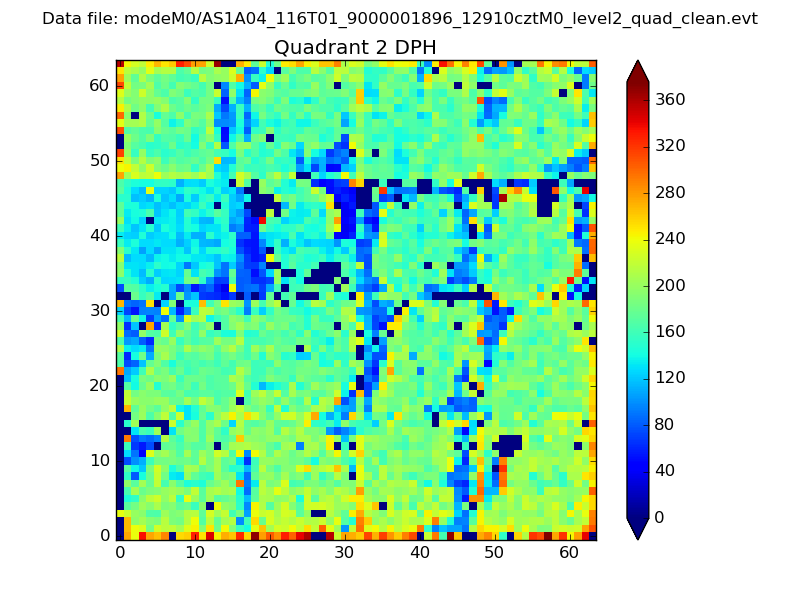
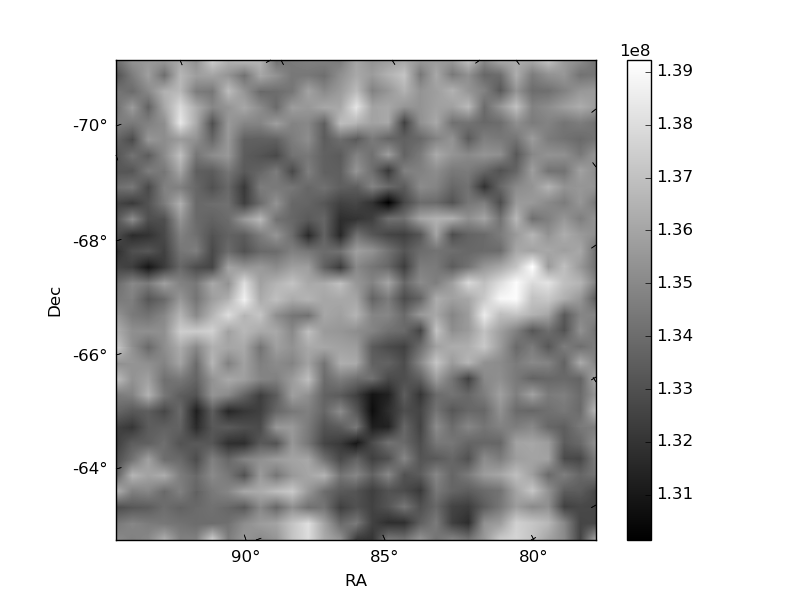
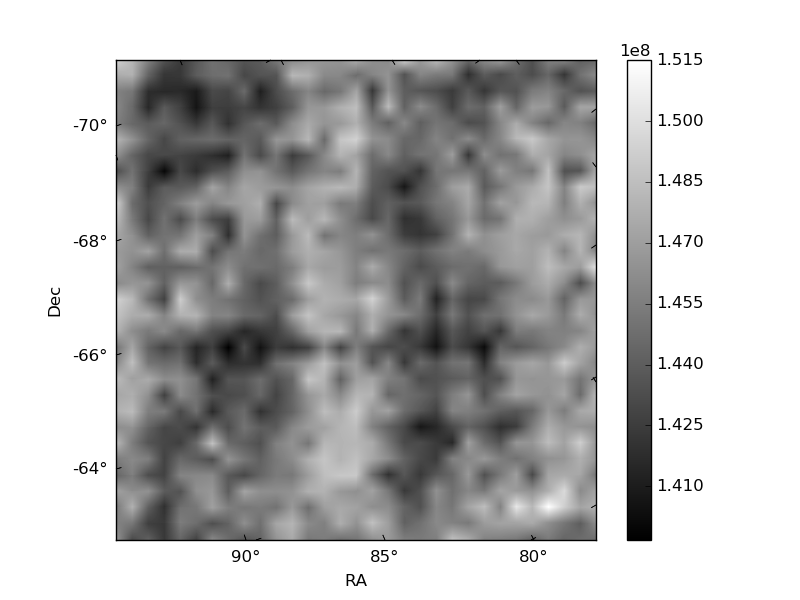
Histogram calculated using DETX and DETY for each event in the final _common_clean file
| Quadrant A | 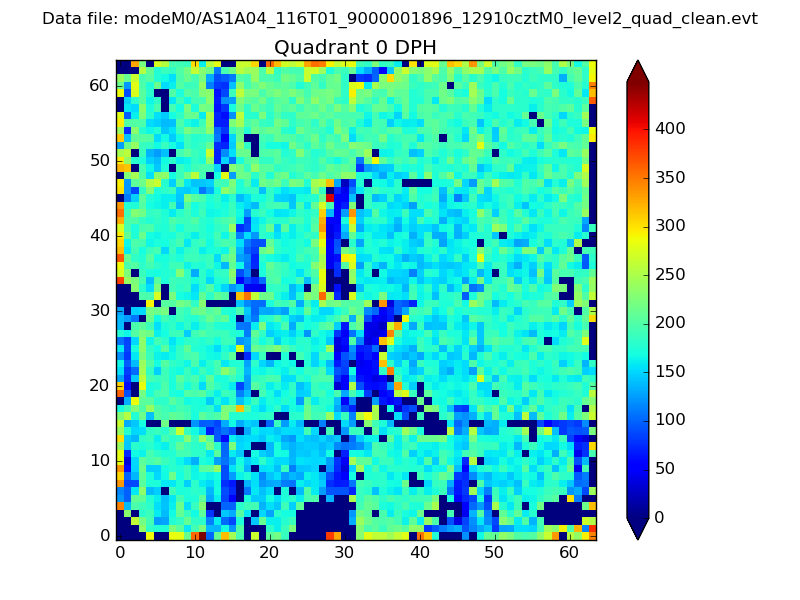 |
 |
Quadrant B |
|---|---|---|---|
| Quadrant D |  |
 |
Quadrant C |
| Plot type | Count rate plots | Images |
|---|---|---|
| Comparison with Poisson distribution Blue bars denote a histogram of data divided into 1 sec bins. Red curve is a Poisson curve with rate = median count rate of data. |
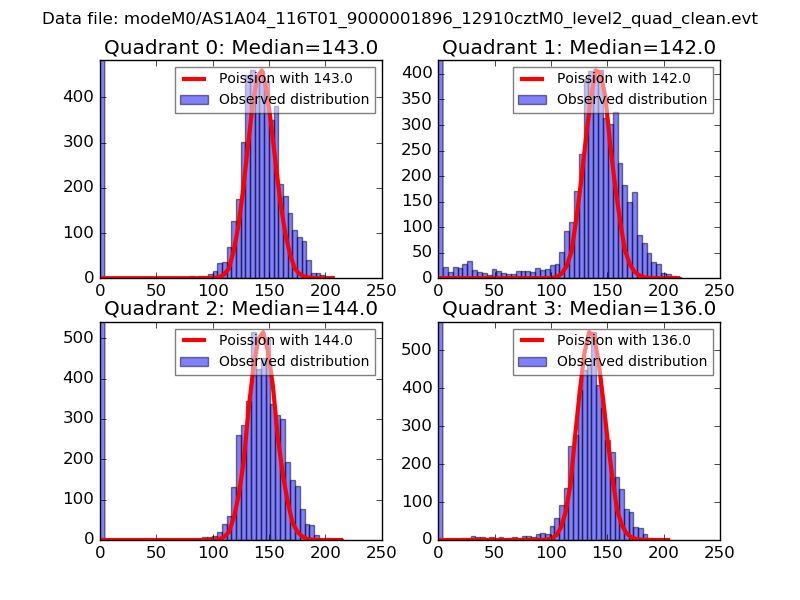 |
 |
| Quadrant-wise count rates Data is divided into 100 sec bins |
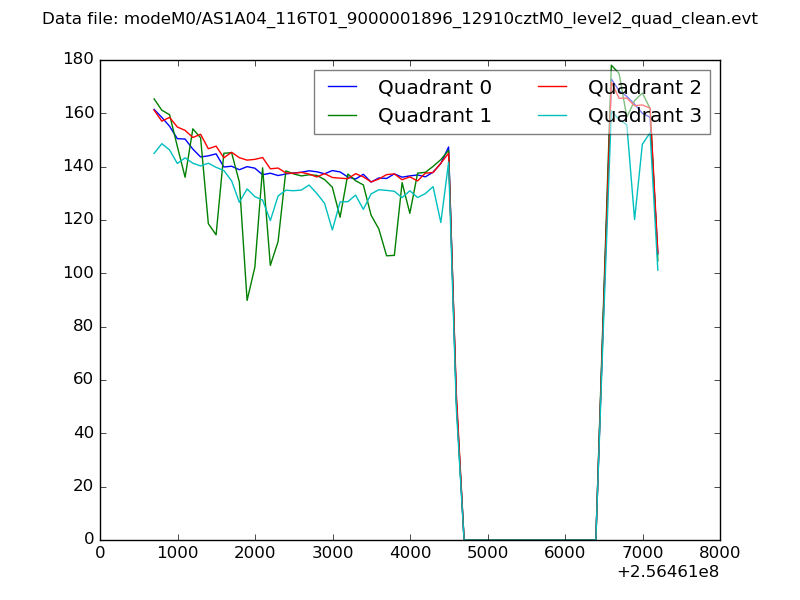 |
|
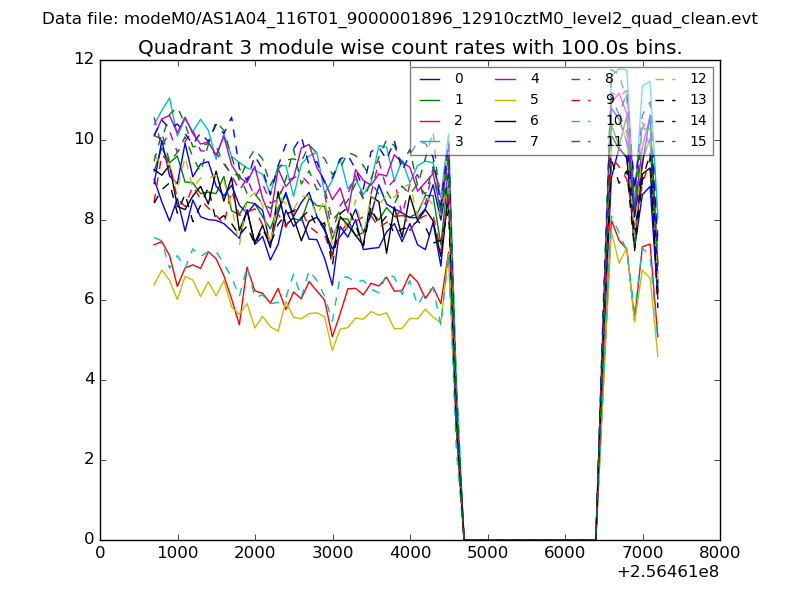
| Module-wise count rates for Quadrant A Data is divided into 100 sec bins |
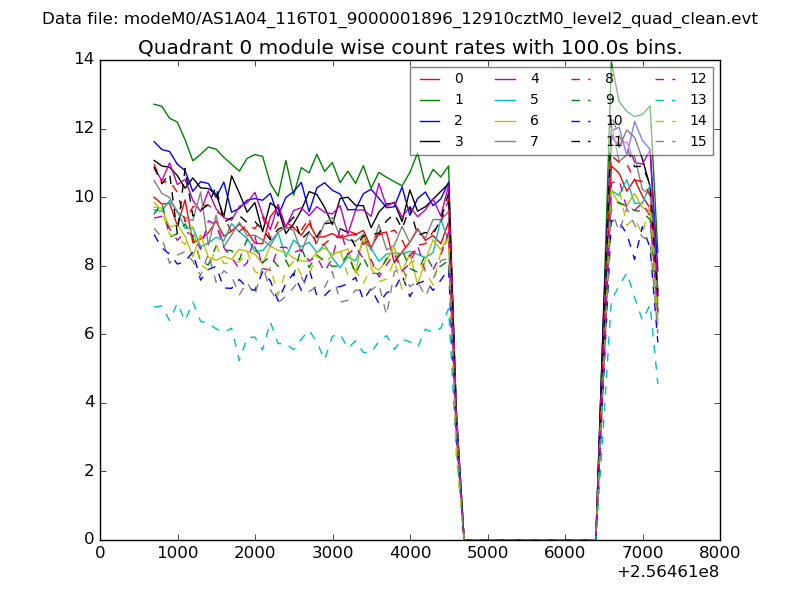 |
 |
| Module-wise count rates for Quadrant B Data is divided into 100 sec bins |
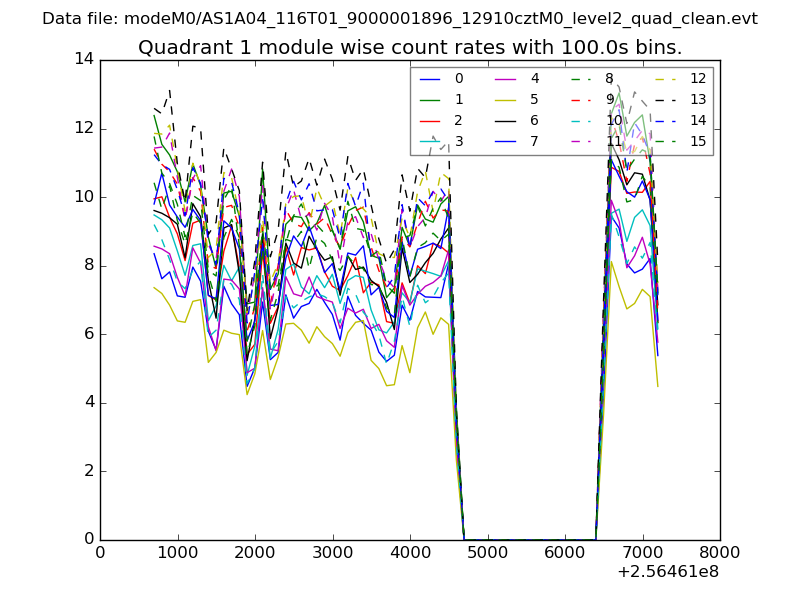 |
 |
| Module-wise count rates for Quadrant C Data is divided into 100 sec bins |
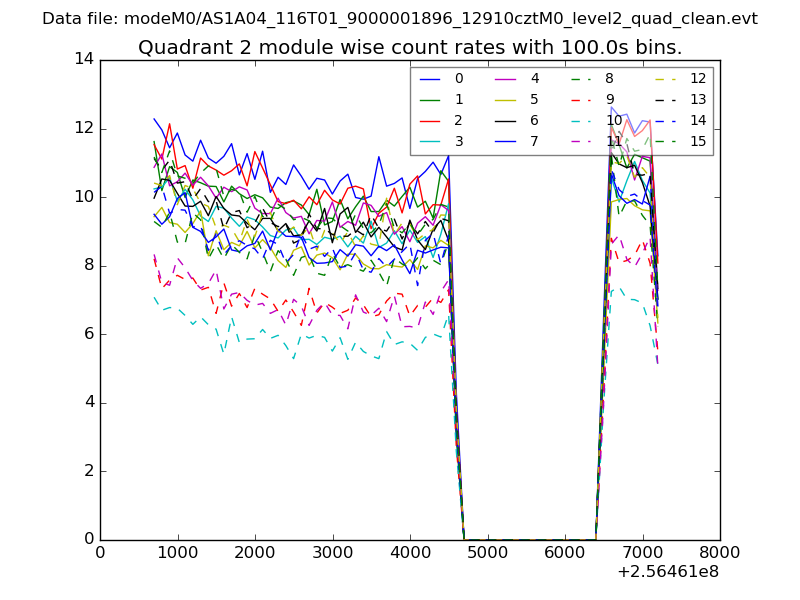 |
 |
| Module-wise count rates for Quadrant D Data is divided into 100 sec bins |
 |
 |
| Parameter | Plot |
|---|---|
| CZT HV Monitor | 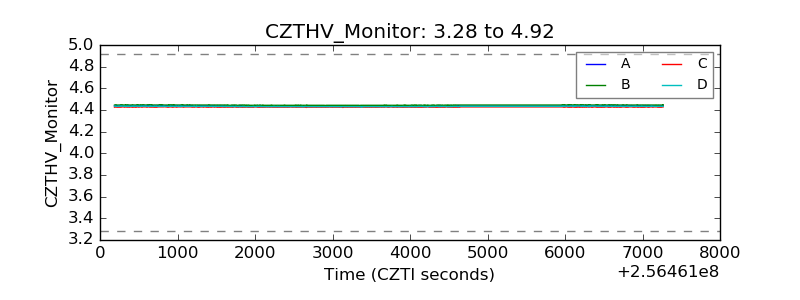 |
| D_VDD | 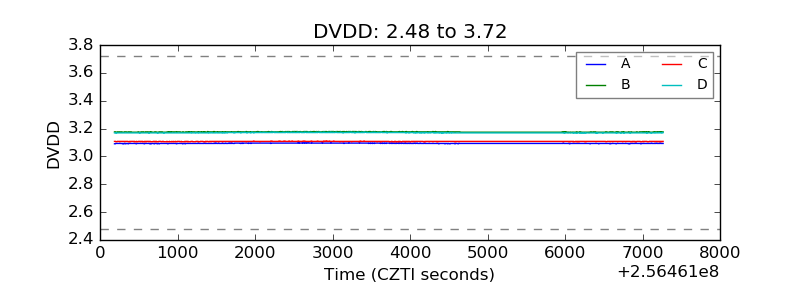 |
| Temperature 1 | 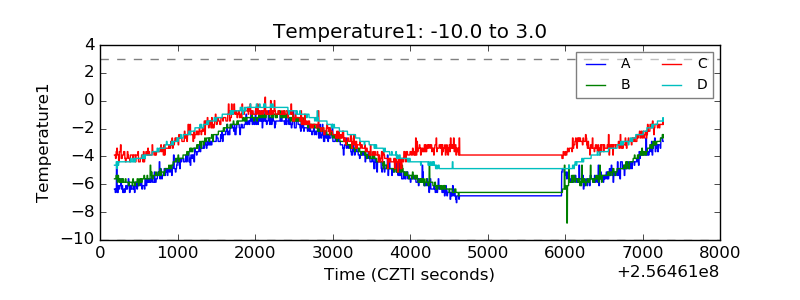 |
| Veto HV Monitor | 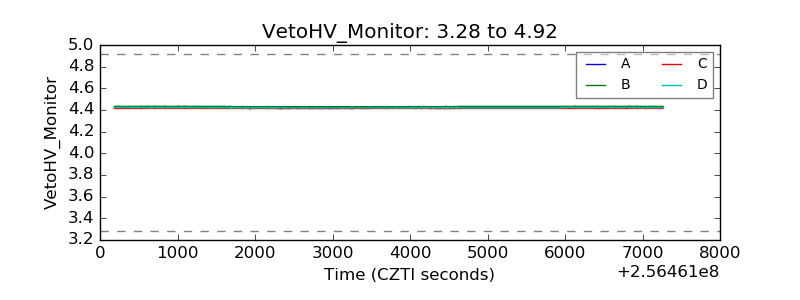 |
| Veto LLD | 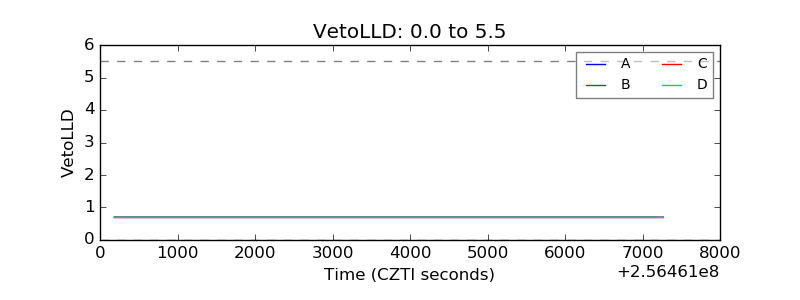 |
| Alpha Counter | 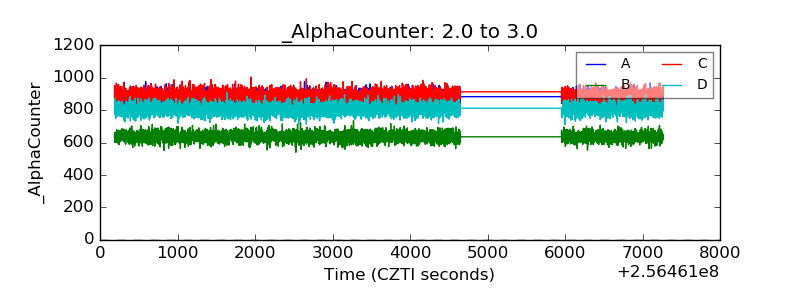 |
| _CPM_Rate | 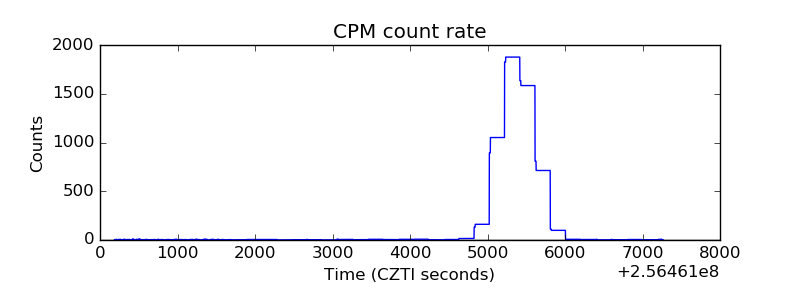 |
| CZT Counter | 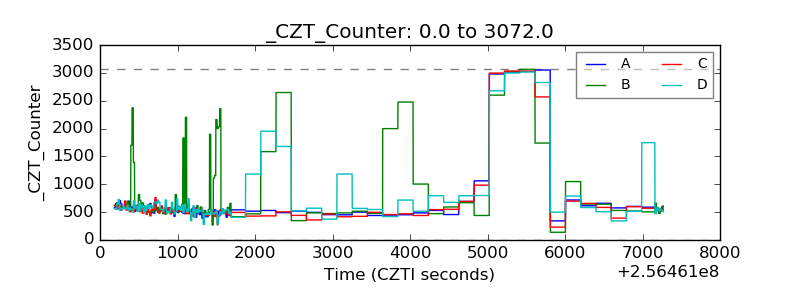 |
| +2.5 Volts monitor |  |
| +5 Volts monitor |  |
| _ROLL_ROT | 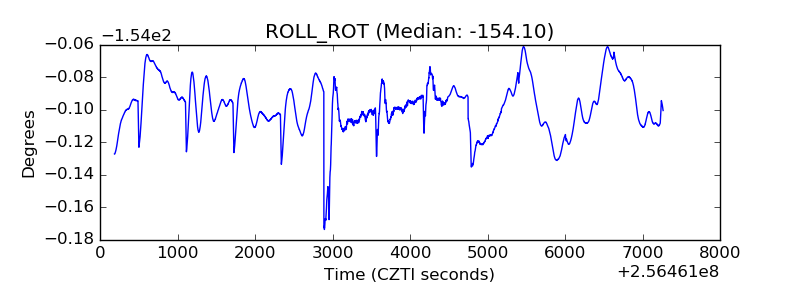 |
| _Roll_DEC | 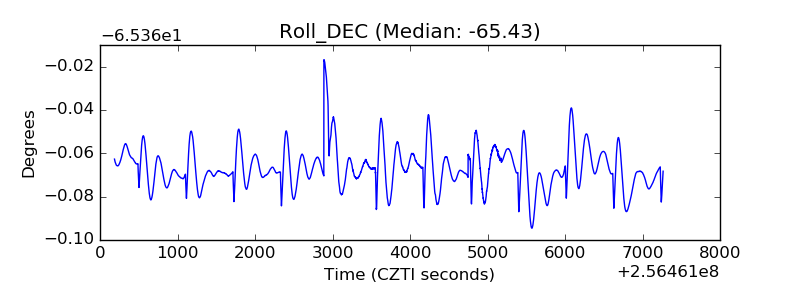 |
| _Roll_RA |  |
| Veto Counter | 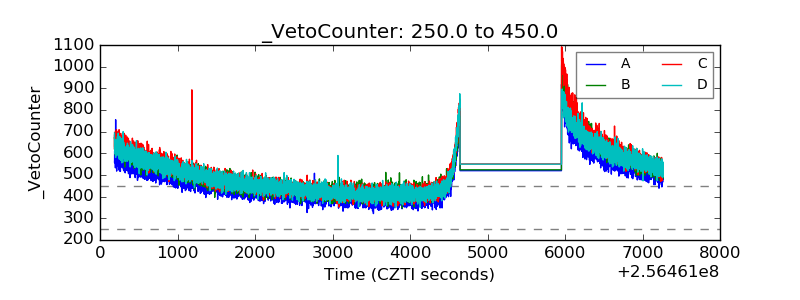 |