| Param | Original file | Final file |
|---|---|---|
| Filename | modeM0/AS1A04_116T01_9000001896_12913cztM0_level2.evt | modeM0/AS1A04_116T01_9000001896_12913cztM0_level2_quad_clean.evt |
| Size (bytes) | 506,767,680 | 113,688,000 |
| Size | 483.3 MB | 108.4 MB |
| Events in quadrant A | 3,345,583 | 775,946 |
| Events in quadrant B | 4,713,868 | 716,250 |
| Events in quadrant C | 2,891,167 | 772,184 |
| Events in quadrant D | 3,962,273 | 732,090 |
| Mode M9 | |||
|---|---|---|---|
| Quadrant | BADHDUFLAG | Total packets | Discarded packets |
| A | 0 | 9 | 0 |
| B | 0 | 9 | 0 |
| C | 0 | 9 | 0 |
| D | 0 | 9 | 0 |
| Mode SS | |||
|---|---|---|---|
| Quadrant | BADHDUFLAG | Total packets | Discarded packets |
| A | 0 | 130 | 0 |
| B | 0 | 130 | 0 |
| C | 0 | 130 | 0 |
| D | 0 | 130 | 0 |
| Mode M0 | |||
|---|---|---|---|
| Quadrant | BADHDUFLAG | Total packets | Discarded packets |
| A | 0 | 13921 | 2 |
| B | 0 | 18157 | 1 |
| C | 0 | 13098 | 1 |
| D | 0 | 16036 | 1 |
| Quadrant | Total seconds | Saturated seconds | Saturation percentage |
|---|---|---|---|
| A | 6399 | 118 | 1.844038% |
| B | 6399 | 829 | 12.955149% |
| C | 6399 | 64 | 1.000156% |
| D | 6399 | 174 | 2.719175% |
Noise dominated data is calculated using 1-second bins in cleaned event files. If a bin has >2000 counts, and if more than 50% of those come from <1% of pixels, then it is considered to be noise-dominated and hence unusable.
| Quadrant | # 1 sec bins | Bins with >0 counts | Bins with >2000 counts | High rate bins dominated by noise | Noise dominated (total time) | Noise dominated (detector-on time) | Marked lightcurve |
|---|---|---|---|---|---|---|---|
| A | 7315 | 6401 | 16 | 16 | 0.22% | 0.25% | 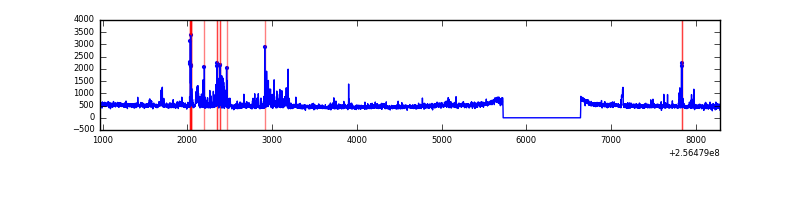 |
| B | 7315 | 6400 | 391 | 391 | 5.35% | 6.11% | 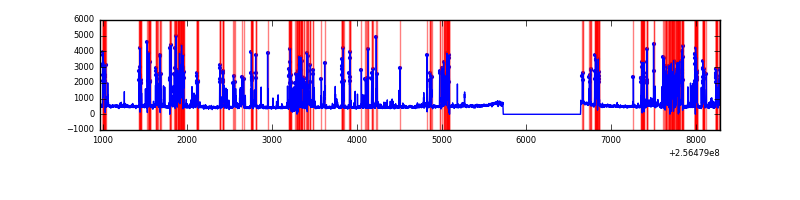 |
| C | 7315 | 6401 | 1 | 1 | 0.01% | 0.02% |  |
| D | 7315 | 6401 | 89 | 89 | 1.22% | 1.39% | 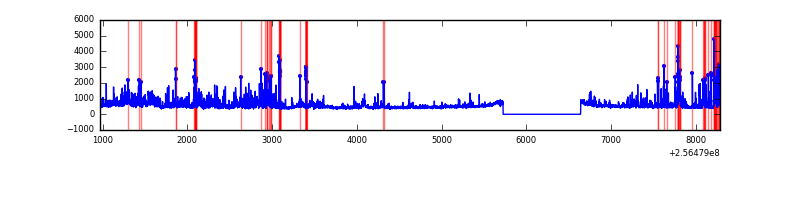 |
Top three noisy pixels from each quadrant. If the there are fewer than three noisy pixels in the level2.evt file, extra rows are filled as -1
| Pixel properties | Quadrant properties | ||||||
|---|---|---|---|---|---|---|---|
| Quadrant | DetID | PixID | Counts | Sigma | Mean | Median | Sigma |
| A | 13 | 248 | 222734 | 1418.85 | 771 | 756 | 156.4 |
| A | 1 | 162 | 47322 | 297.64 | 771 | 756 | 156.4 |
| A | 1 | 178 | 23327 | 144.27 | 771 | 756 | 156.4 |
| B | 4 | 239 | 1659367 | 12510.06 | 714 | 697 | 132.6 |
| B | 3 | 64 | 179738 | 1350.37 | 714 | 697 | 132.6 |
| B | 0 | 214 | 27956 | 205.59 | 714 | 697 | 132.6 |
| C | 13 | 61 | 5527 | 28.37 | 740 | 745 | 168.5 |
| C | 14 | 234 | 3080 | 13.85 | 740 | 745 | 168.5 |
| C | 8 | 222 | 2273 | 9.07 | 740 | 745 | 168.5 |
| D | 1 | 52 | 930384 | 5210.39 | 738 | 715 | 178.4 |
| D | 8 | 195 | 176066 | 982.77 | 738 | 715 | 178.4 |
| D | 13 | 104 | 37666 | 207.09 | 738 | 715 | 178.4 |
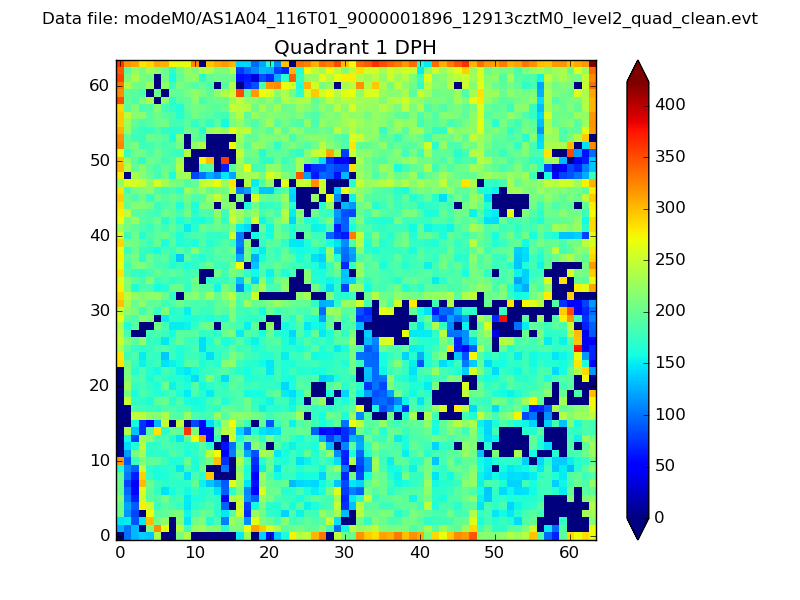
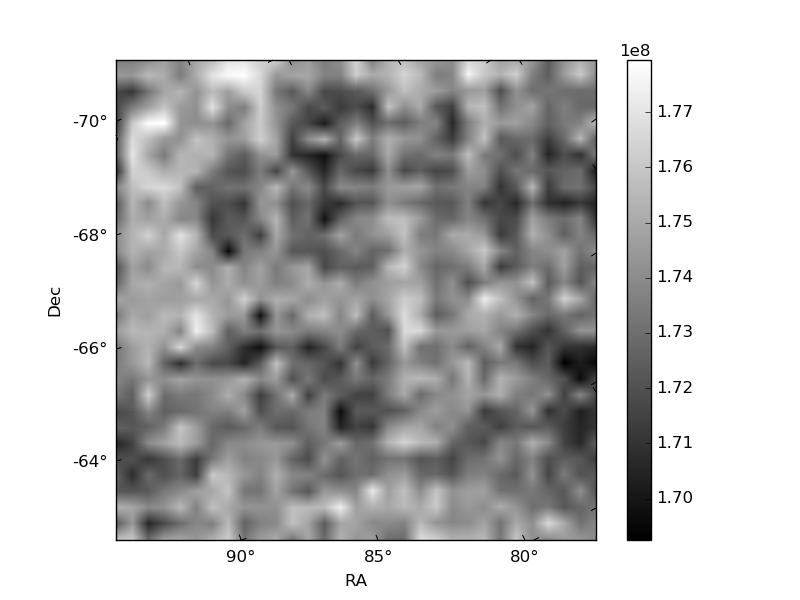
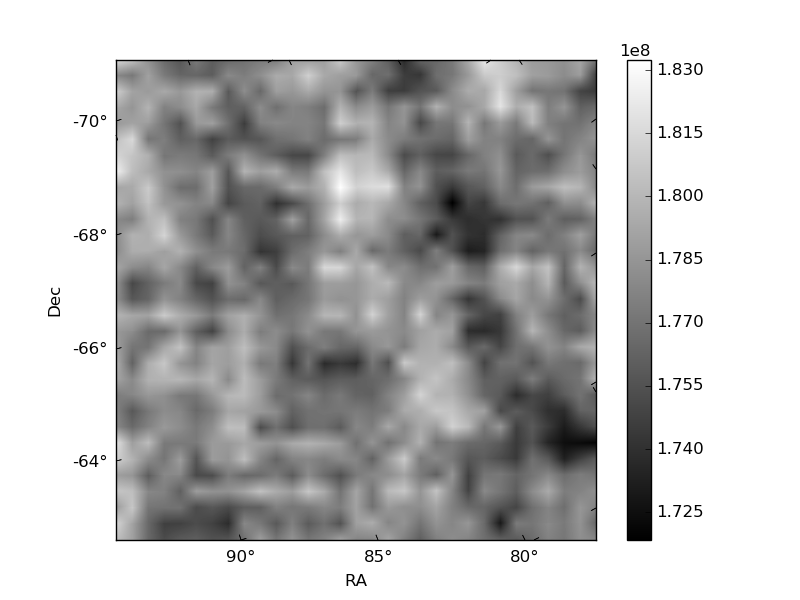
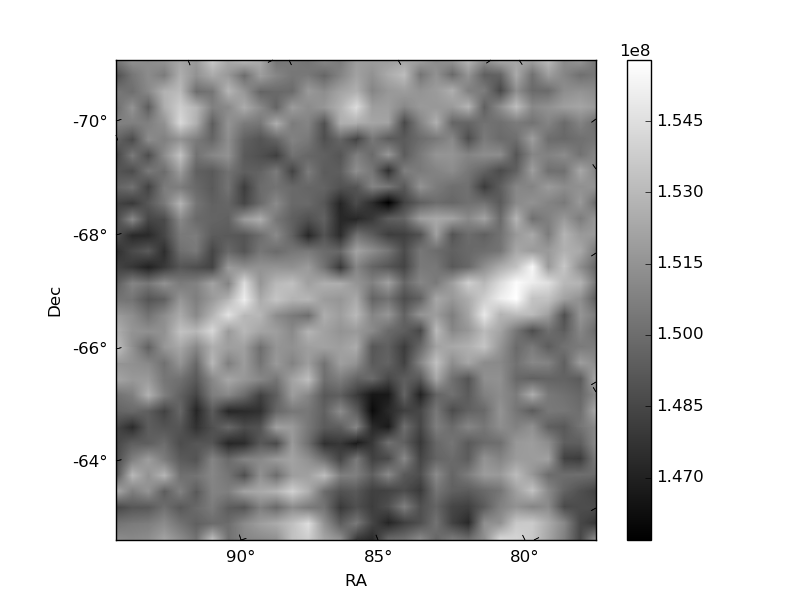
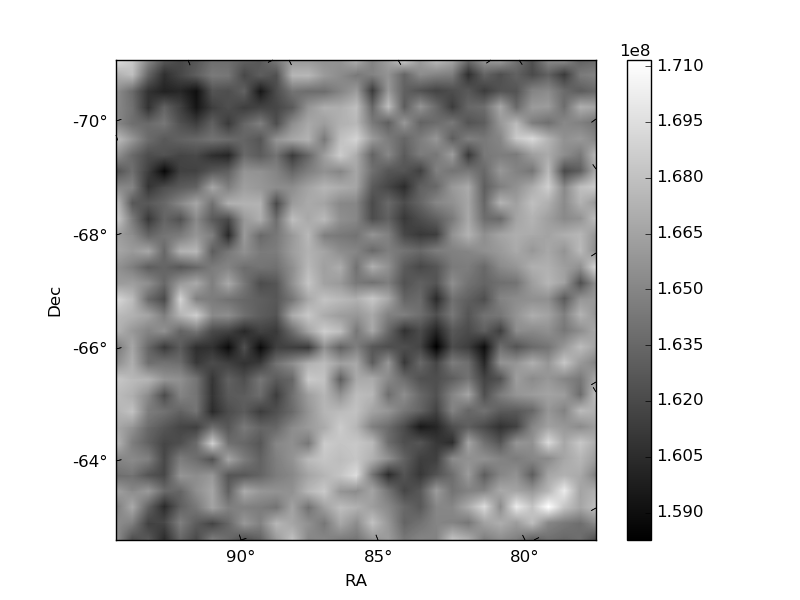
Histogram calculated using DETX and DETY for each event in the final _common_clean file
| Quadrant A | 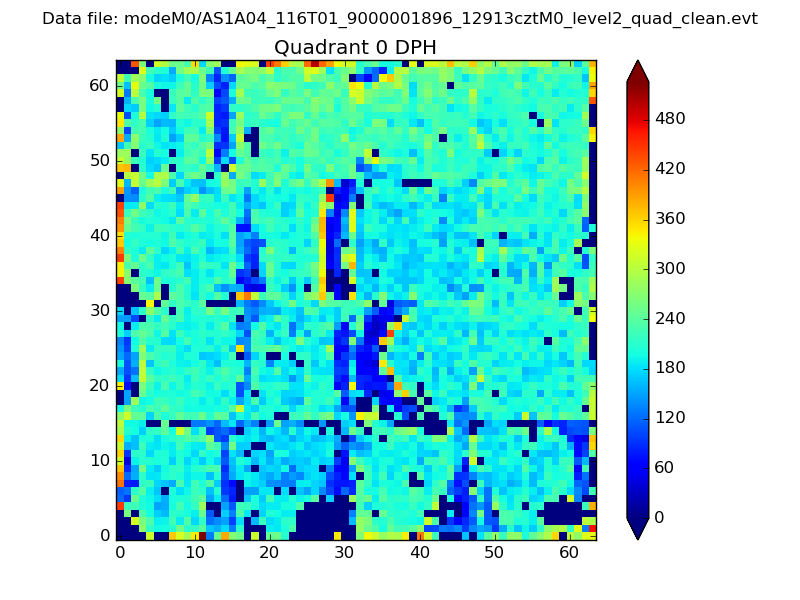 |
 |
Quadrant B |
|---|---|---|---|
| Quadrant D | 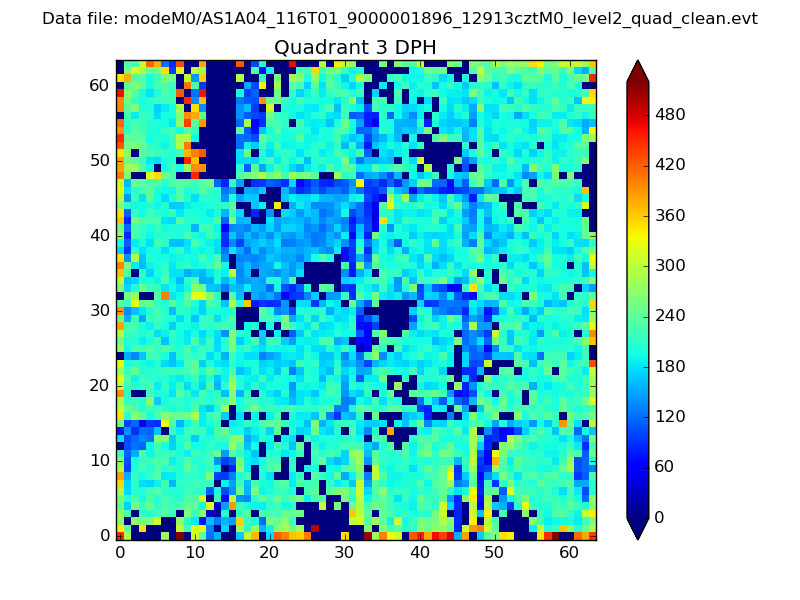 |
 |
Quadrant C |
| Plot type | Count rate plots | Images |
|---|---|---|
| Comparison with Poisson distribution Blue bars denote a histogram of data divided into 1 sec bins. Red curve is a Poisson curve with rate = median count rate of data. |
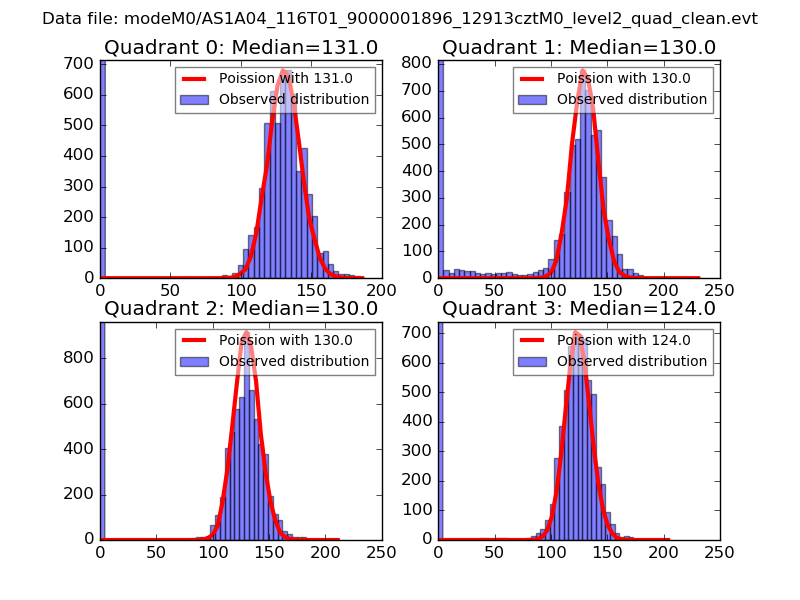 |
 |
| Quadrant-wise count rates Data is divided into 100 sec bins |
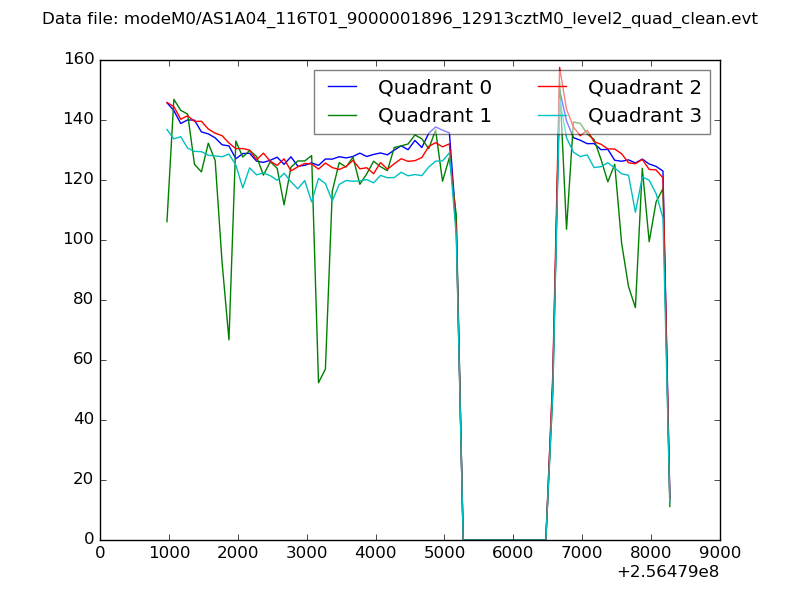 |
|
| Module-wise count rates for Quadrant A Data is divided into 100 sec bins |
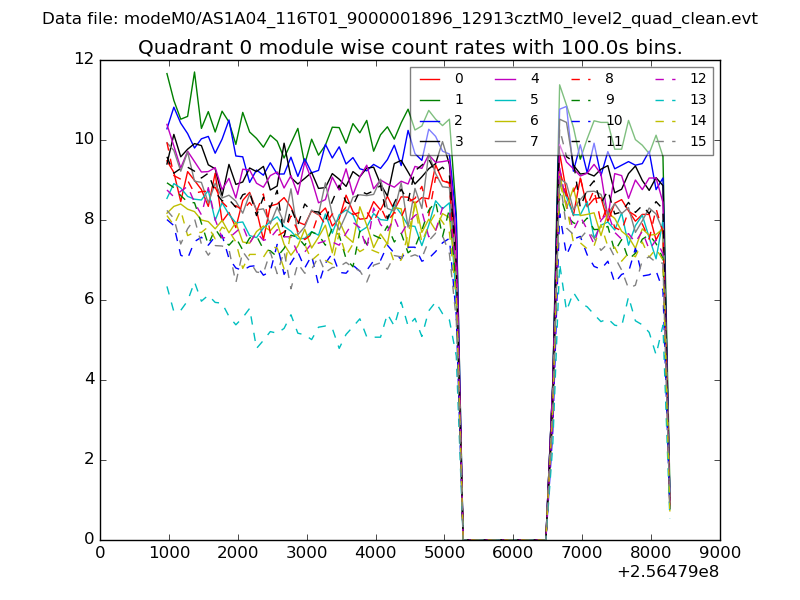 |
 |
| Module-wise count rates for Quadrant B Data is divided into 100 sec bins |
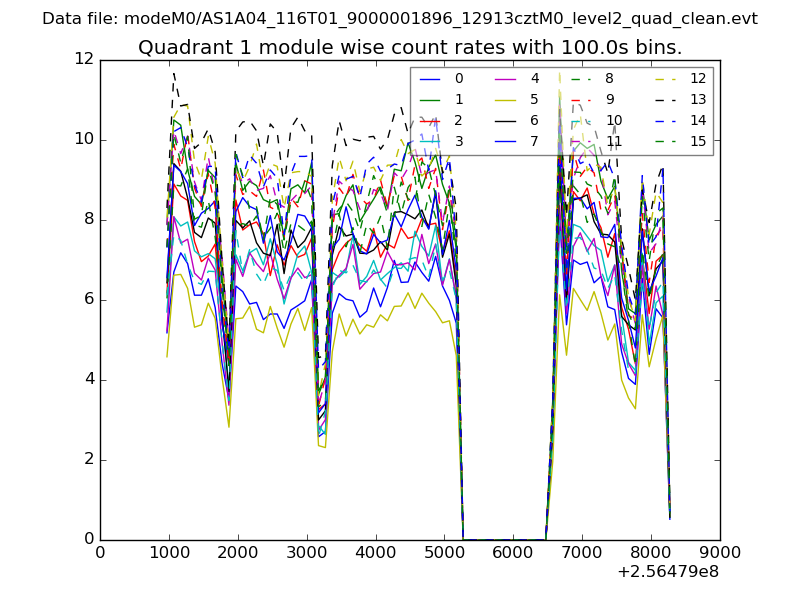 |
 |
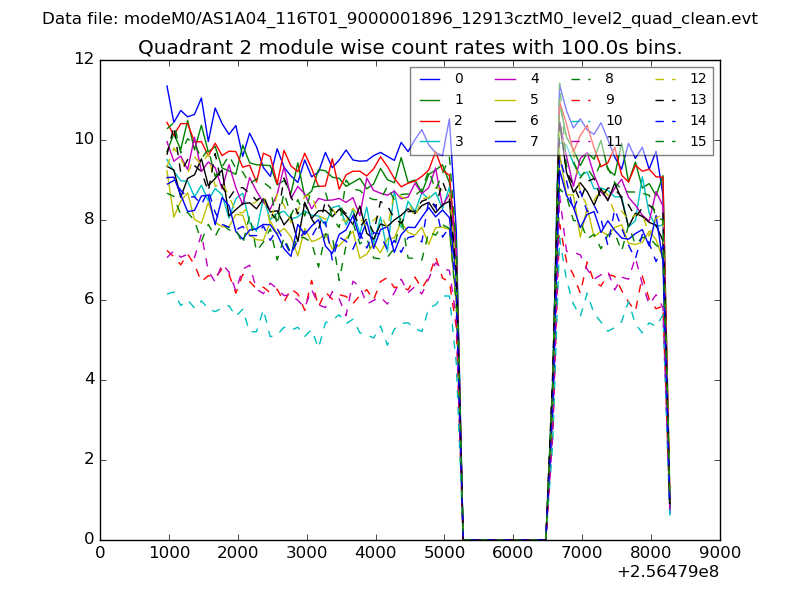
| Module-wise count rates for Quadrant C Data is divided into 100 sec bins |
 |
 |
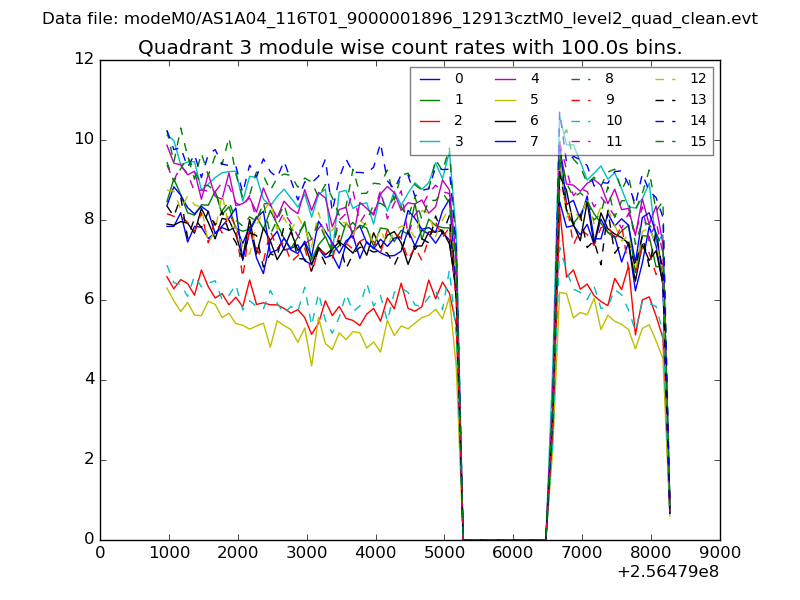
| Module-wise count rates for Quadrant D Data is divided into 100 sec bins |
 |
 |
| Parameter | Plot |
|---|---|
| CZT HV Monitor | 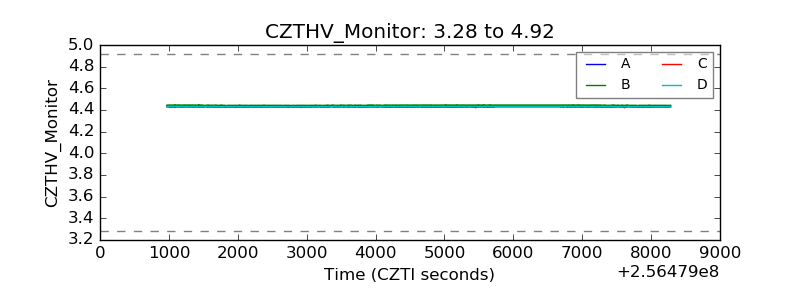 |
| D_VDD | 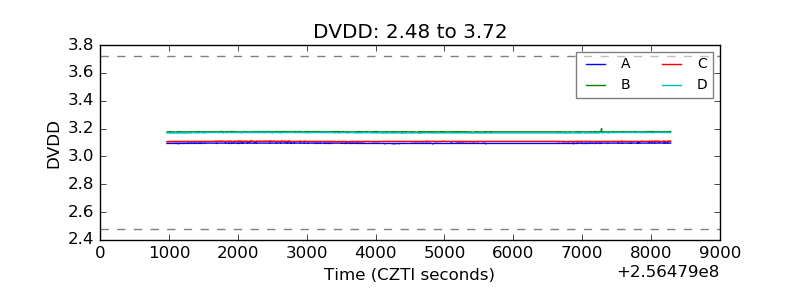 |
| Temperature 1 | 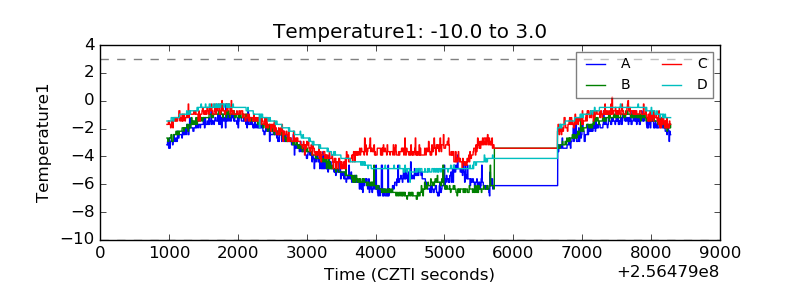 |
| Veto HV Monitor | 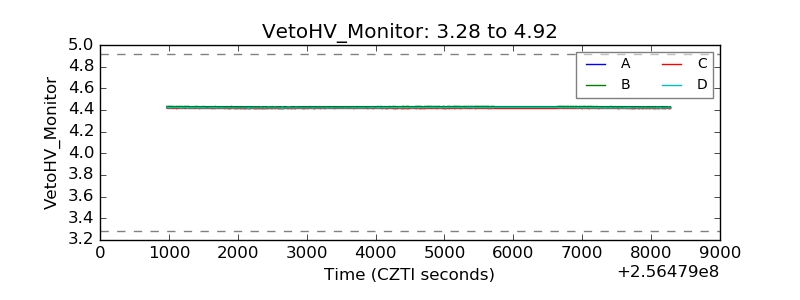 |
| Veto LLD | 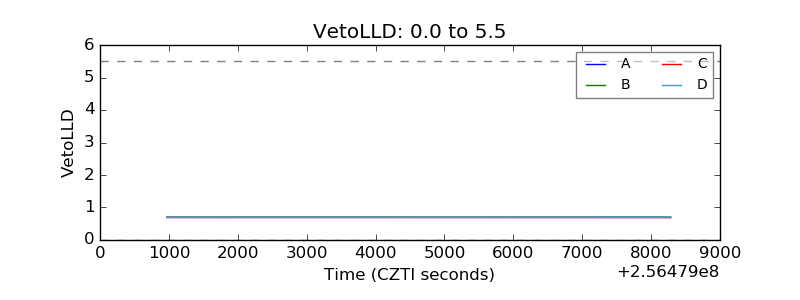 |
| Alpha Counter | 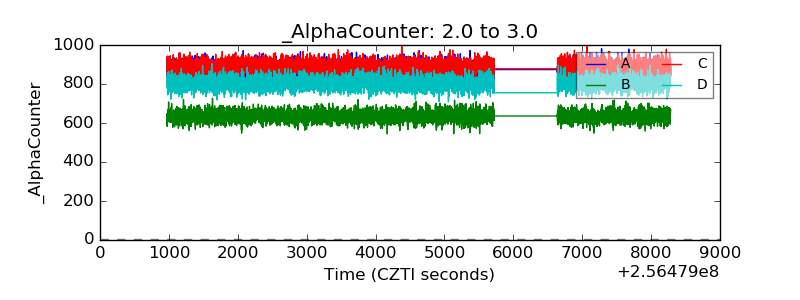 |
| _CPM_Rate | 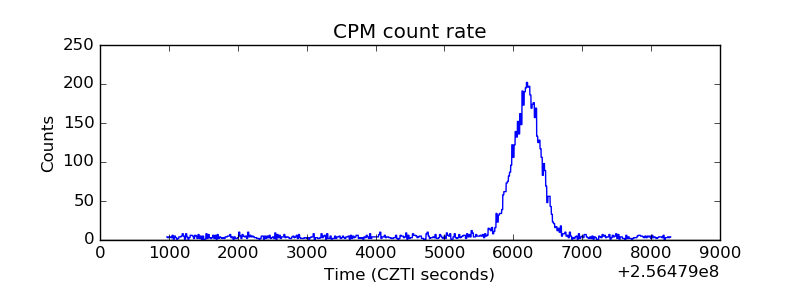 |
| CZT Counter |  |
| +2.5 Volts monitor |  |
| +5 Volts monitor |  |
| _ROLL_ROT | 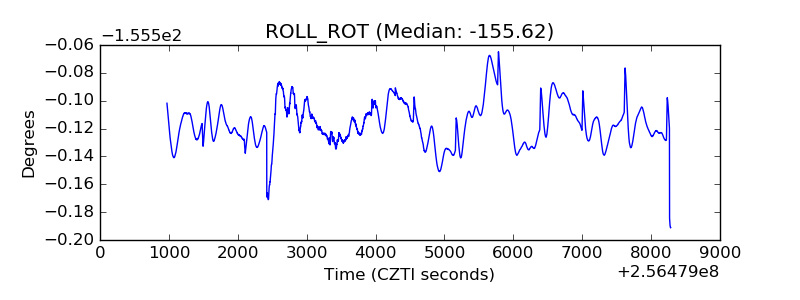 |
| _Roll_DEC |  |
| _Roll_RA | 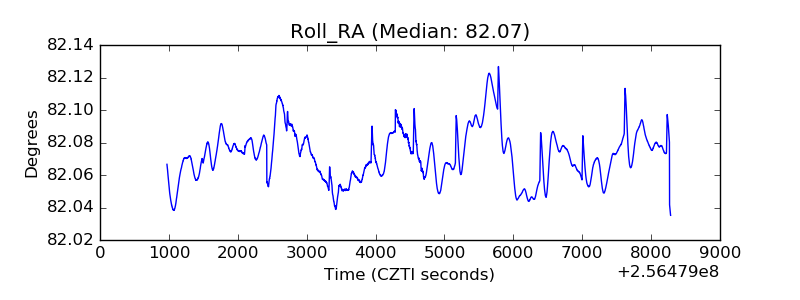 |
| Veto Counter | 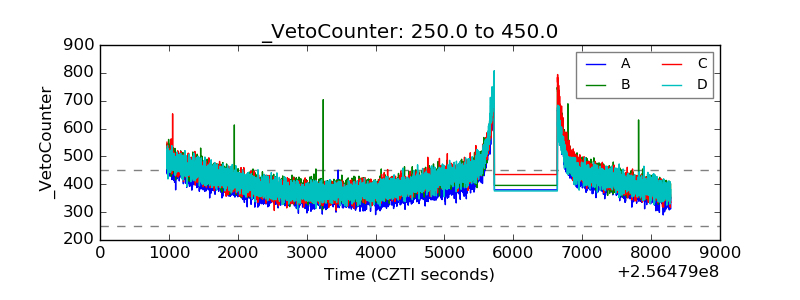 |