| Param | Original file | Final file |
|---|---|---|
| Filename | modeM0/AS1A04_116T01_9000001896_12914cztM0_level2.evt | modeM0/AS1A04_116T01_9000001896_12914cztM0_level2_quad_clean.evt |
| Size (bytes) | 566,654,400 | 114,122,880 |
| Size | 540.4 MB | 108.8 MB |
| Events in quadrant A | 3,379,497 | 769,498 |
| Events in quadrant B | 5,068,079 | 709,281 |
| Events in quadrant C | 3,107,921 | 768,089 |
| Events in quadrant D | 5,129,308 | 719,936 |
| Mode M9 | |||
|---|---|---|---|
| Quadrant | BADHDUFLAG | Total packets | Discarded packets |
| A | 0 | 5 | 0 |
| B | 0 | 5 | 0 |
| C | 0 | 5 | 0 |
| D | 0 | 5 | 0 |
| Mode SS | |||
|---|---|---|---|
| Quadrant | BADHDUFLAG | Total packets | Discarded packets |
| A | 0 | 142 | 0 |
| B | 0 | 142 | 0 |
| C | 0 | 142 | 0 |
| D | 0 | 142 | 0 |
| Mode M0 | |||
|---|---|---|---|
| Quadrant | BADHDUFLAG | Total packets | Discarded packets |
| A | 0 | 14797 | 2 |
| B | 0 | 19734 | 1 |
| C | 0 | 14365 | 1 |
| D | 0 | 19943 | 1 |
| Quadrant | Total seconds | Saturated seconds | Saturation percentage |
|---|---|---|---|
| A | 7020 | 124 | 1.766382% |
| B | 7020 | 895 | 12.749288% |
| C | 7020 | 46 | 0.655271% |
| D | 7020 | 396 | 5.641026% |
Noise dominated data is calculated using 1-second bins in cleaned event files. If a bin has >2000 counts, and if more than 50% of those come from <1% of pixels, then it is considered to be noise-dominated and hence unusable.
| Quadrant | # 1 sec bins | Bins with >0 counts | Bins with >2000 counts | High rate bins dominated by noise | Noise dominated (total time) | Noise dominated (detector-on time) | Marked lightcurve |
|---|---|---|---|---|---|---|---|
| A | 7491 | 7022 | 9 | 9 | 0.12% | 0.13% |  |
| B | 7491 | 7022 | 435 | 435 | 5.81% | 6.19% | 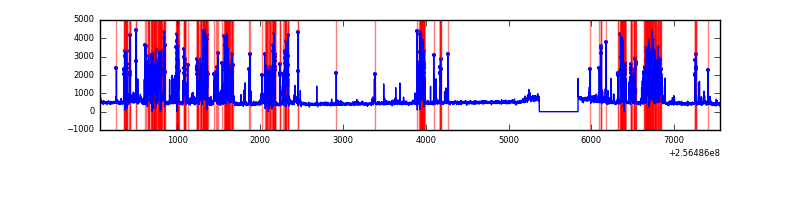 |
| C | 7491 | 7022 | 1 | 1 | 0.01% | 0.01% | 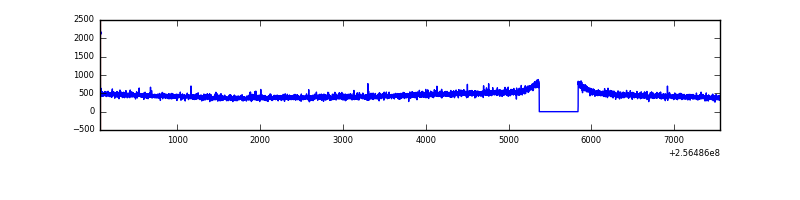 |
| D | 7491 | 7022 | 295 | 295 | 3.94% | 4.20% | 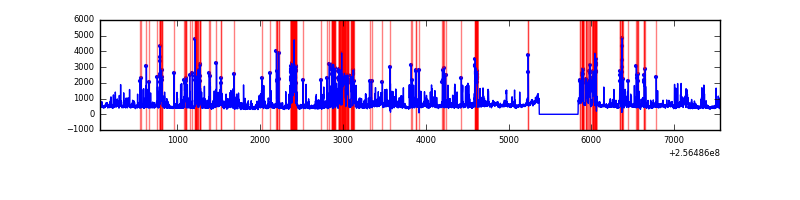 |
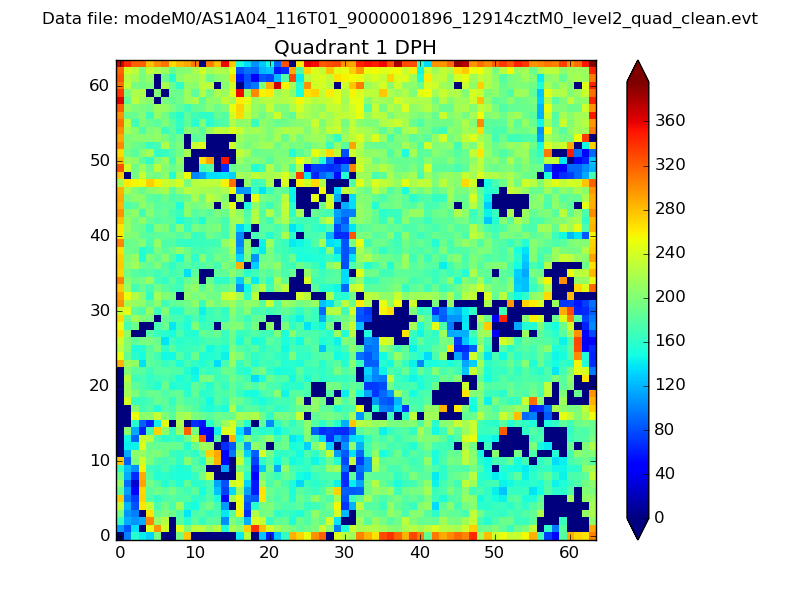
Top three noisy pixels from each quadrant. If the there are fewer than three noisy pixels in the level2.evt file, extra rows are filled as -1
| Pixel properties | Quadrant properties | ||||||
|---|---|---|---|---|---|---|---|
| Quadrant | DetID | PixID | Counts | Sigma | Mean | Median | Sigma |
| A | 1 | 162 | 38321 | 223.09 | 828 | 810 | 168.1 |
| A | 13 | 248 | 36578 | 212.72 | 828 | 810 | 168.1 |
| A | 15 | 174 | 27218 | 157.06 | 828 | 810 | 168.1 |
| B | 4 | 239 | 1823077 | 12588.4 | 771 | 752 | 144.8 |
| B | 3 | 64 | 140733 | 966.97 | 771 | 752 | 144.8 |
| B | 0 | 214 | 46868 | 318.56 | 771 | 752 | 144.8 |
| C | 13 | 61 | 5943 | 28.18 | 795 | 795 | 182.7 |
| C | 12 | 4 | 4341 | 19.41 | 795 | 795 | 182.7 |
| C | 8 | 222 | 3167 | 12.98 | 795 | 795 | 182.7 |
| D | 1 | 52 | 1973349 | 10460.36 | 781 | 756 | 188.6 |
| D | 8 | 195 | 116263 | 612.52 | 781 | 756 | 188.6 |
| D | 10 | 157 | 34711 | 180.06 | 781 | 756 | 188.6 |
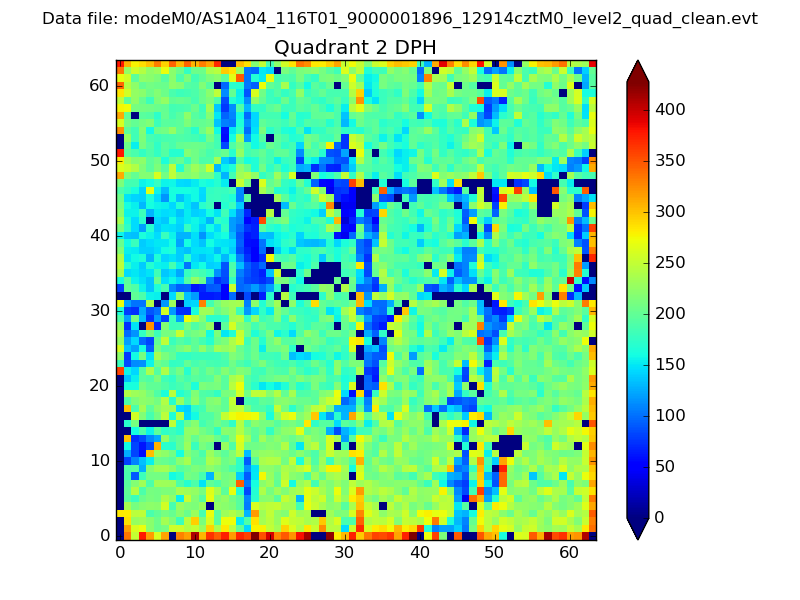
Histogram calculated using DETX and DETY for each event in the final _common_clean file
| Quadrant A |  |
 |
Quadrant B |
|---|---|---|---|
| Quadrant D | 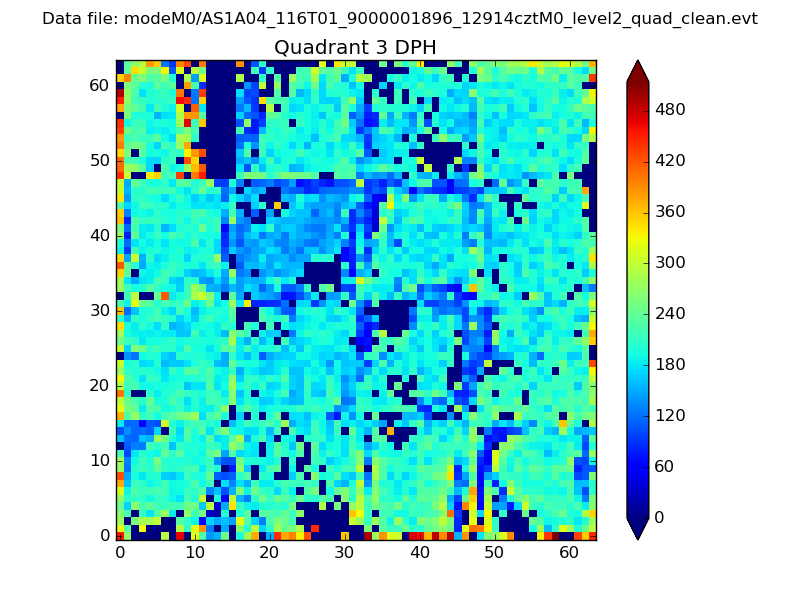 |
 |
Quadrant C |
| Plot type | Count rate plots | Images |
|---|---|---|
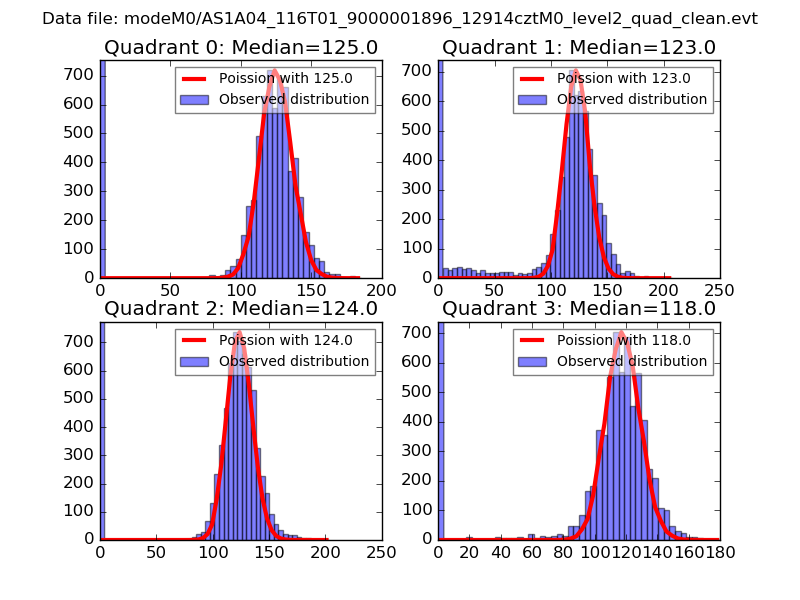
| Comparison with Poisson distribution Blue bars denote a histogram of data divided into 1 sec bins. Red curve is a Poisson curve with rate = median count rate of data. |
 |
 |
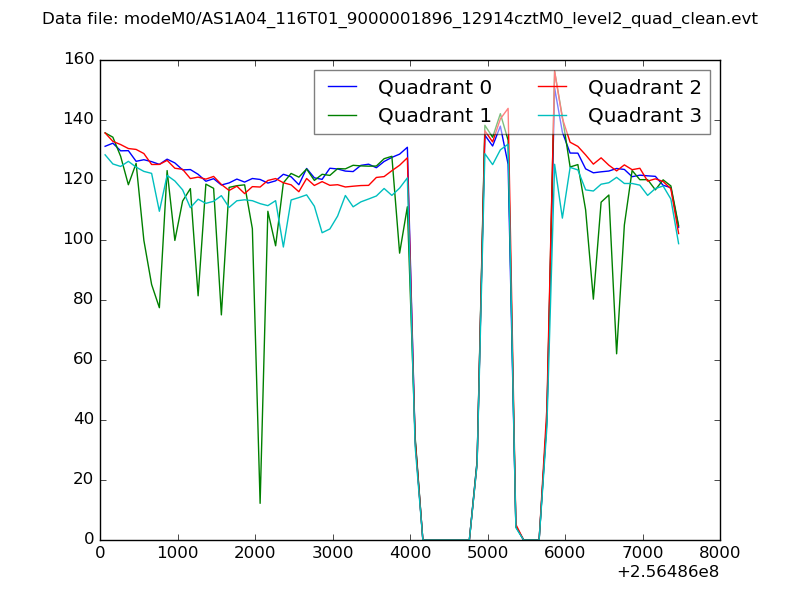
| Quadrant-wise count rates Data is divided into 100 sec bins |
 |
|
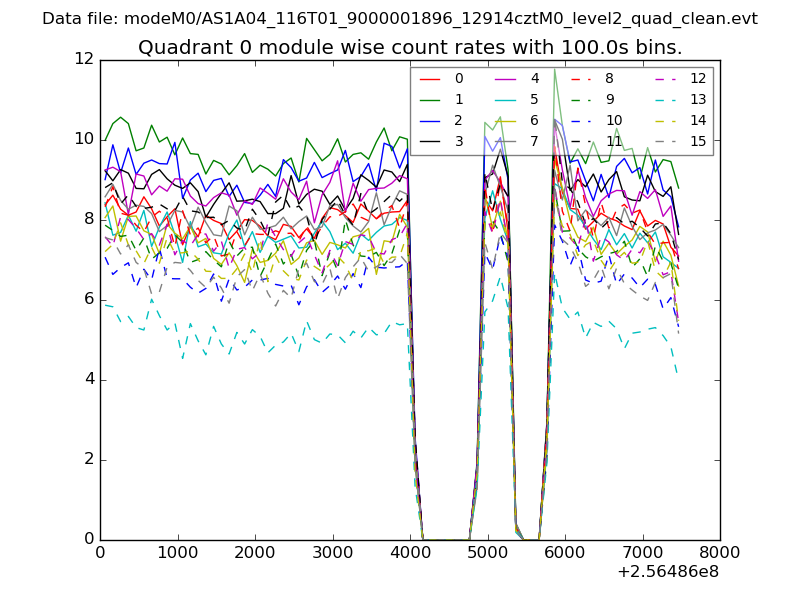
| Module-wise count rates for Quadrant A Data is divided into 100 sec bins |
 |
 |
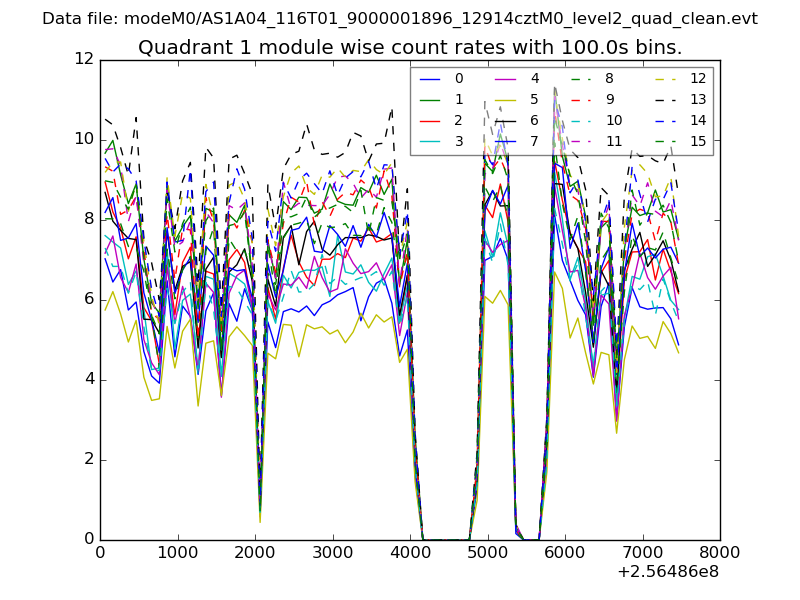
| Module-wise count rates for Quadrant B Data is divided into 100 sec bins |
 |
 |
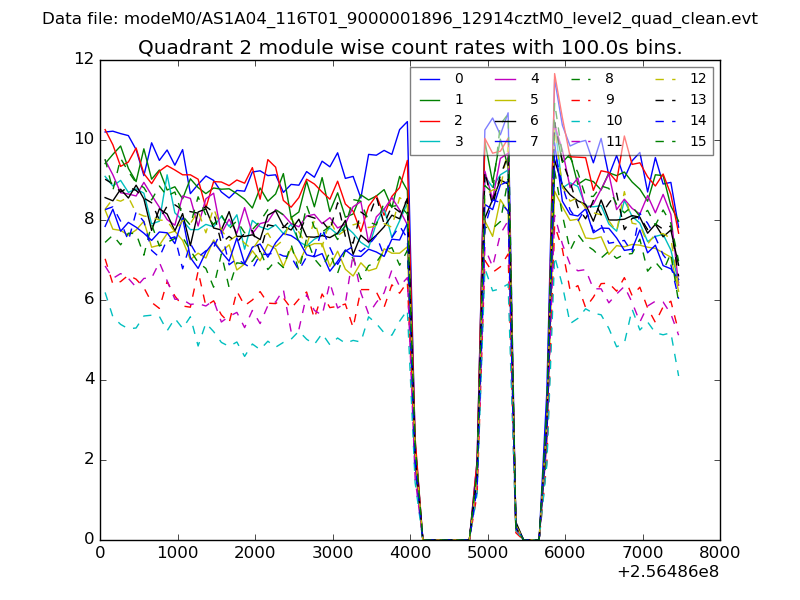
| Module-wise count rates for Quadrant C Data is divided into 100 sec bins |
 |
 |
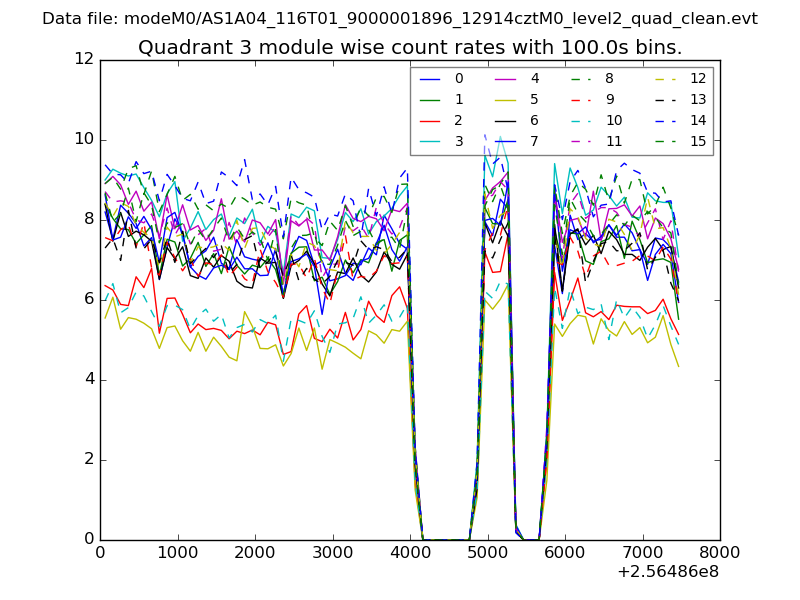
| Module-wise count rates for Quadrant D Data is divided into 100 sec bins |
 |
 |
| Parameter | Plot |
|---|---|
| CZT HV Monitor | 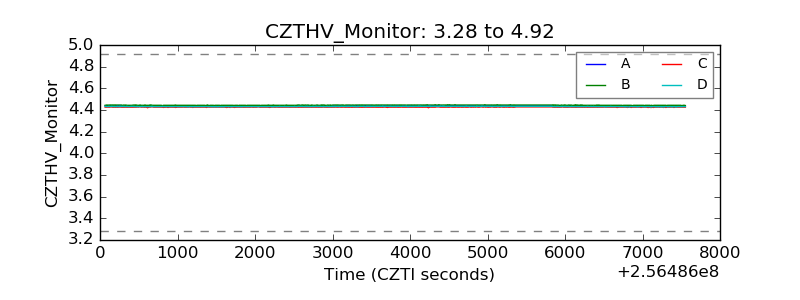 |
| D_VDD | 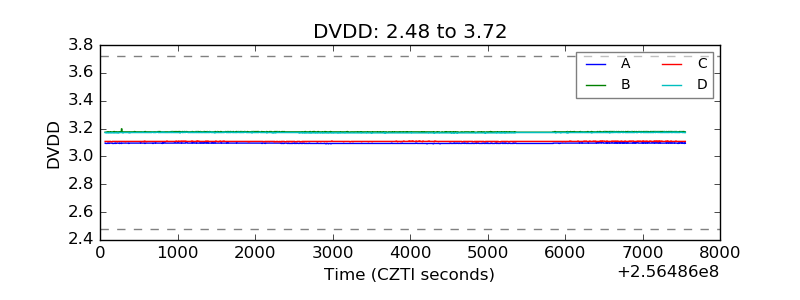 |
| Temperature 1 | 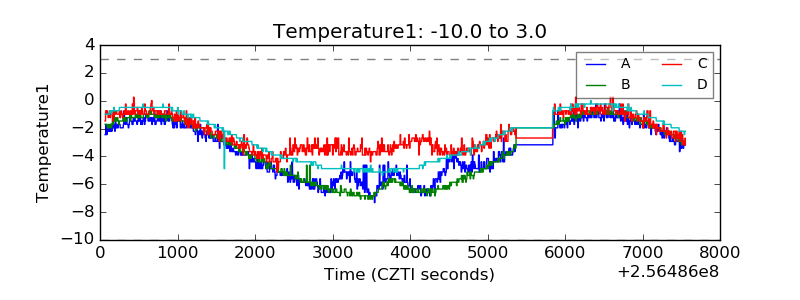 |
| Veto HV Monitor | 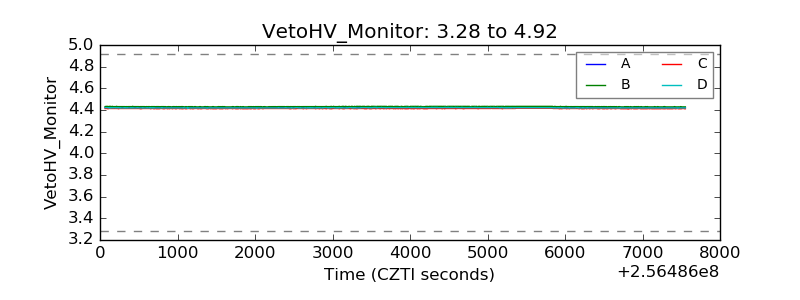 |
| Veto LLD | 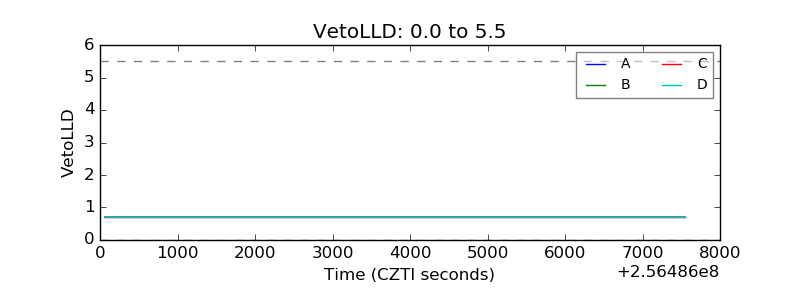 |
| Alpha Counter | 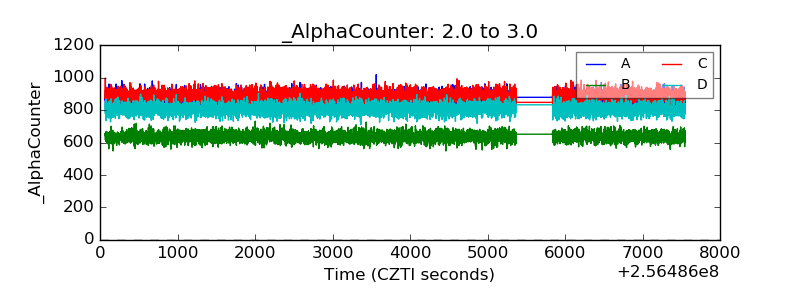 |
| _CPM_Rate | 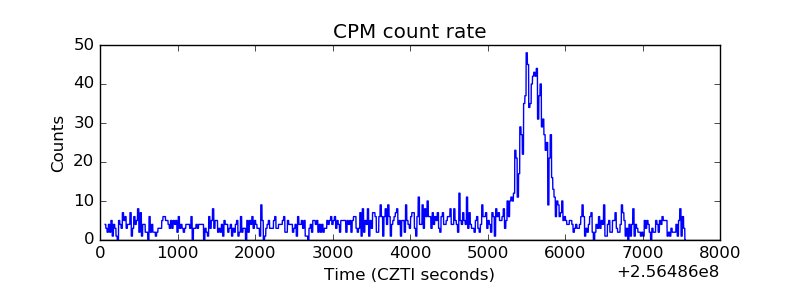 |
| CZT Counter | 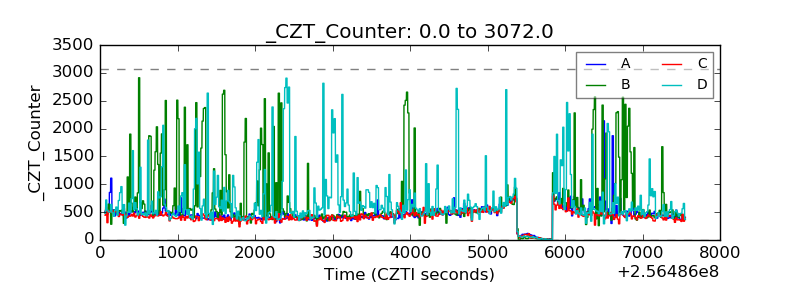 |
| +2.5 Volts monitor |  |
| +5 Volts monitor |  |
| _ROLL_ROT | 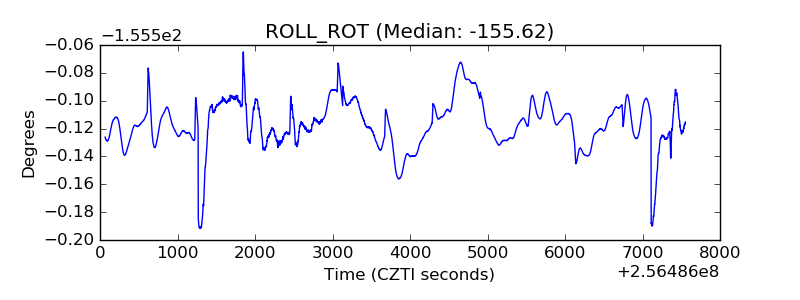 |
| _Roll_DEC | 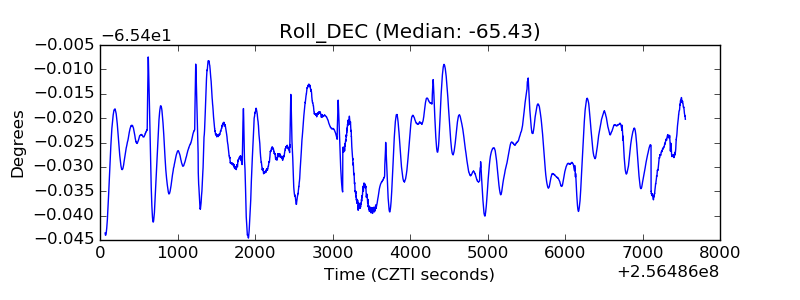 |
| _Roll_RA | 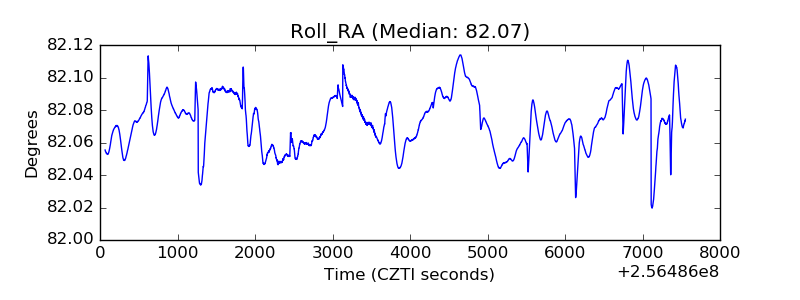 |
| Veto Counter | 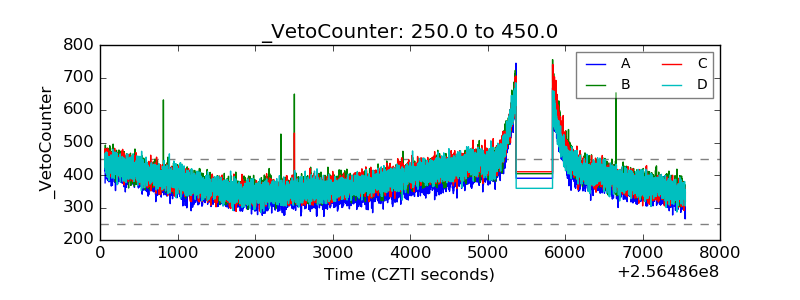 |