| Param | Original file | Final file |
|---|---|---|
| Filename | modeM0/AS1A04_116T01_9000001896_12915cztM0_level2.evt | modeM0/AS1A04_116T01_9000001896_12915cztM0_level2_quad_clean.evt |
| Size (bytes) | 600,456,960 | 120,839,040 |
| Size | 572.6 MB | 115.2 MB |
| Events in quadrant A | 4,447,048 | 797,786 |
| Events in quadrant B | 5,194,655 | 765,109 |
| Events in quadrant C | 3,310,722 | 810,441 |
| Events in quadrant D | 4,726,501 | 766,915 |
| Mode M9 | |||
|---|---|---|---|
| Quadrant | BADHDUFLAG | Total packets | Discarded packets |
| A | 0 | 1 | 0 |
| B | 0 | 1 | 0 |
| C | 0 | 1 | 0 |
| D | 0 | 1 | 0 |
| Mode SS | |||
|---|---|---|---|
| Quadrant | BADHDUFLAG | Total packets | Discarded packets |
| A | 0 | 150 | 0 |
| B | 0 | 150 | 0 |
| C | 0 | 150 | 0 |
| D | 0 | 150 | 0 |
| Mode M0 | |||
|---|---|---|---|
| Quadrant | BADHDUFLAG | Total packets | Discarded packets |
| A | 0 | 18218 | 3 |
| B | 0 | 20406 | 2 |
| C | 0 | 15240 | 2 |
| D | 0 | 19156 | 2 |
| Quadrant | Total seconds | Saturated seconds | Saturation percentage |
|---|---|---|---|
| A | 7463 | 311 | 4.167225% |
| B | 7463 | 807 | 10.813346% |
| C | 7463 | 25 | 0.334986% |
| D | 7463 | 283 | 3.792041% |
Noise dominated data is calculated using 1-second bins in cleaned event files. If a bin has >2000 counts, and if more than 50% of those come from <1% of pixels, then it is considered to be noise-dominated and hence unusable.
| Quadrant | # 1 sec bins | Bins with >0 counts | Bins with >2000 counts | High rate bins dominated by noise | Noise dominated (total time) | Noise dominated (detector-on time) | Marked lightcurve |
|---|---|---|---|---|---|---|---|
| A | 7574 | 7467 | 143 | 143 | 1.89% | 1.92% | 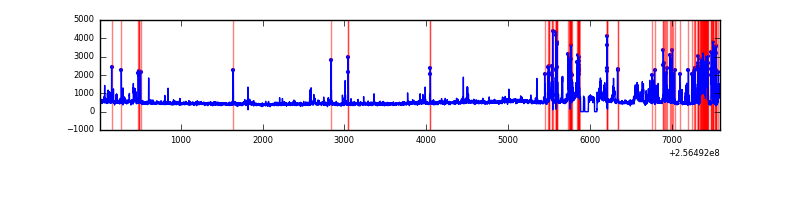 |
| B | 7574 | 7467 | 371 | 371 | 4.90% | 4.97% | 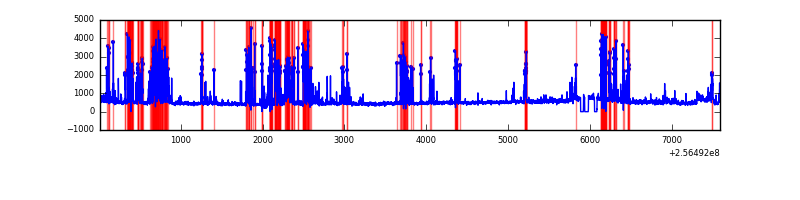 |
| C | 7574 | 7467 | 3 | 3 | 0.04% | 0.04% | 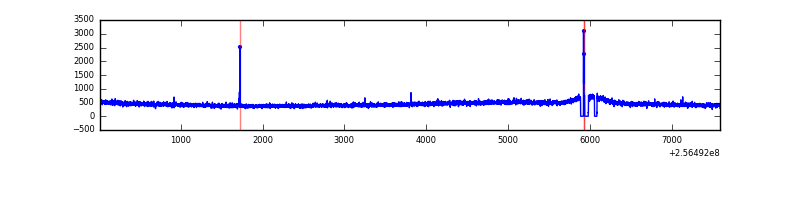 |
| D | 7574 | 7467 | 133 | 133 | 1.76% | 1.78% | 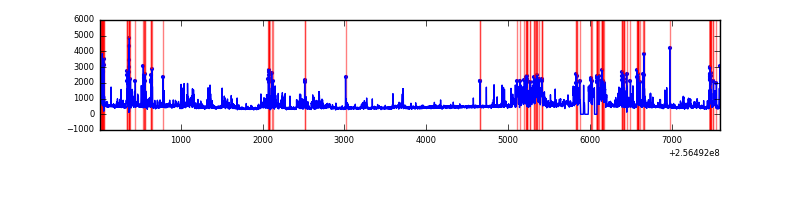 |
Top three noisy pixels from each quadrant. If the there are fewer than three noisy pixels in the level2.evt file, extra rows are filled as -1
| Pixel properties | Quadrant properties | ||||||
|---|---|---|---|---|---|---|---|
| Quadrant | DetID | PixID | Counts | Sigma | Mean | Median | Sigma |
| A | 15 | 223 | 591112 | 3339.01 | 866 | 849 | 176.8 |
| A | 15 | 239 | 235039 | 1324.77 | 866 | 849 | 176.8 |
| A | 15 | 174 | 54530 | 303.66 | 866 | 849 | 176.8 |
| B | 4 | 239 | 1576992 | 10091.36 | 829 | 806 | 156.2 |
| B | 3 | 64 | 228848 | 1460.01 | 829 | 806 | 156.2 |
| B | 3 | 209 | 83782 | 531.24 | 829 | 806 | 156.2 |
| C | 3 | 233 | 6810 | 30.47 | 844 | 848 | 195.7 |
| C | 13 | 61 | 6274 | 27.73 | 844 | 848 | 195.7 |
| C | 8 | 222 | 5993 | 26.3 | 844 | 848 | 195.7 |
| D | 1 | 52 | 1361810 | 6827.36 | 833 | 808 | 199.3 |
| D | 8 | 195 | 123494 | 615.44 | 833 | 808 | 199.3 |
| D | 2 | 234 | 38374 | 188.45 | 833 | 808 | 199.3 |
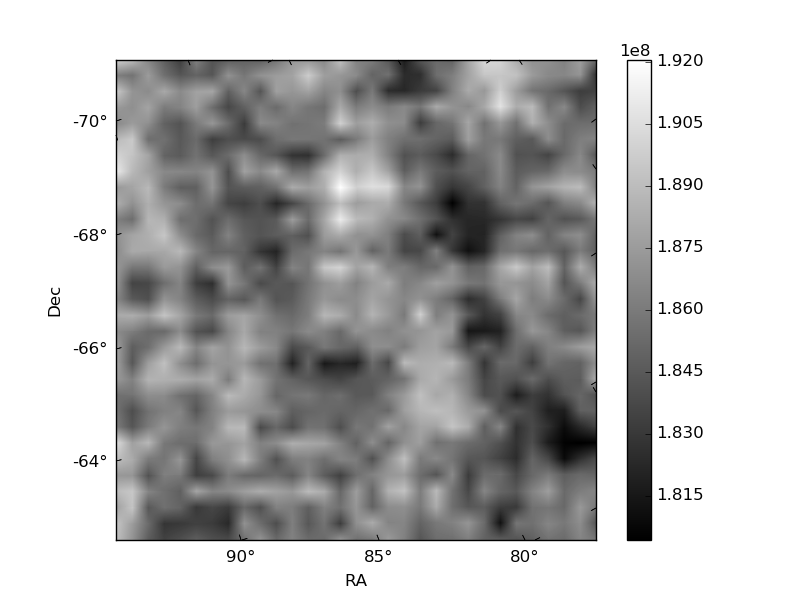
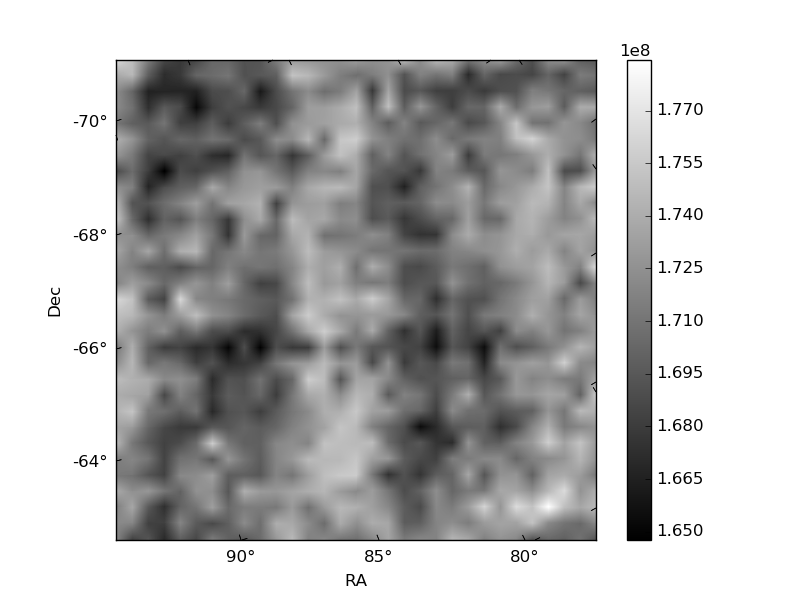
Histogram calculated using DETX and DETY for each event in the final _common_clean file
| Quadrant A | 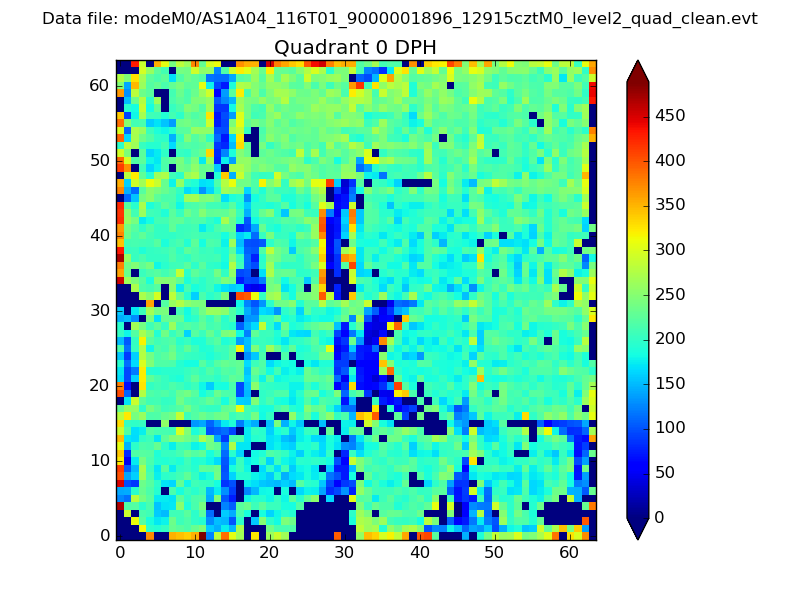 |
 |
Quadrant B |
|---|---|---|---|
| Quadrant D |  |
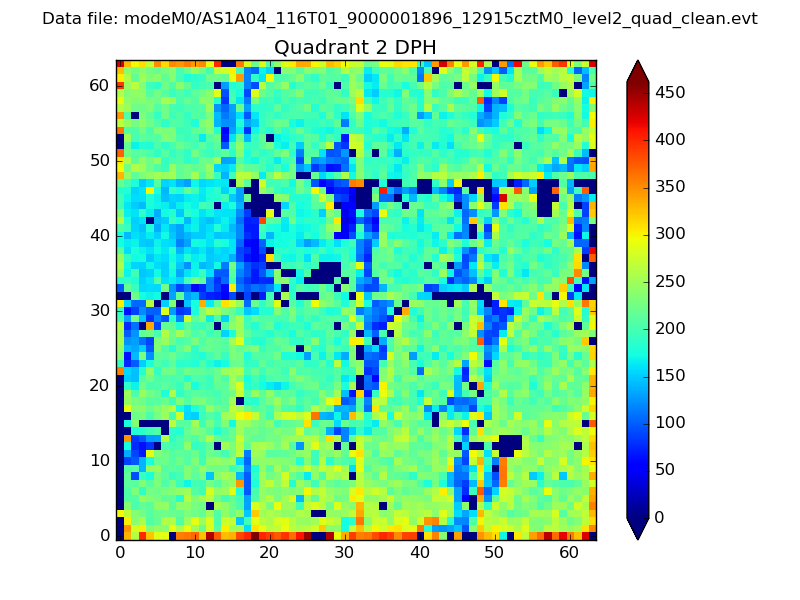 |
Quadrant C |
| Plot type | Count rate plots | Images |
|---|---|---|
| Comparison with Poisson distribution Blue bars denote a histogram of data divided into 1 sec bins. Red curve is a Poisson curve with rate = median count rate of data. |
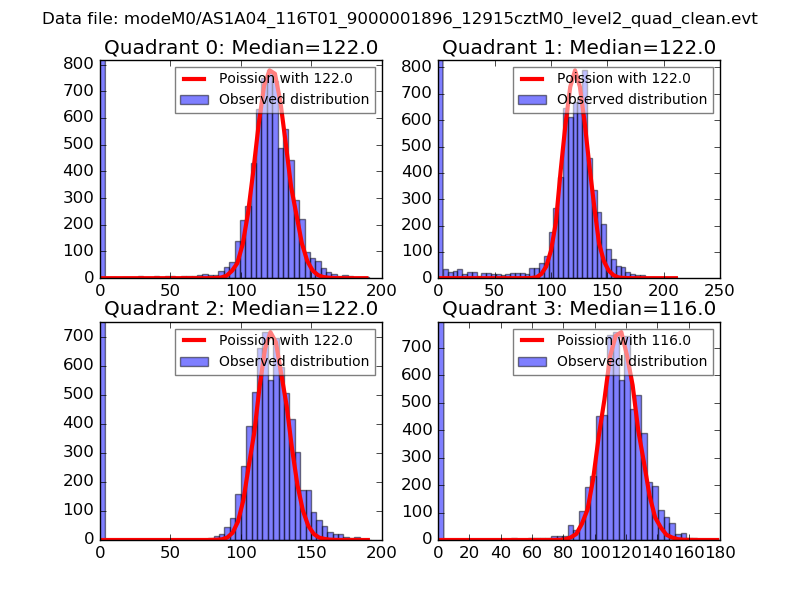 |
 |
| Quadrant-wise count rates Data is divided into 100 sec bins |
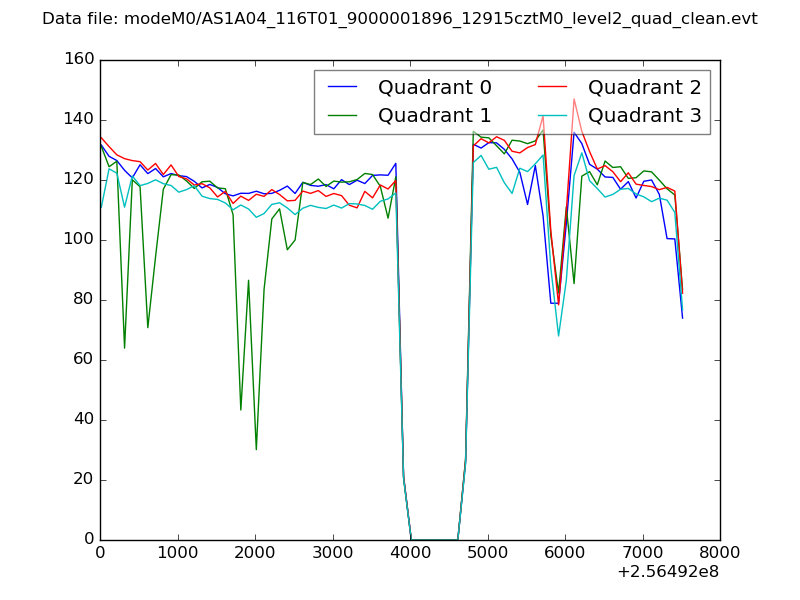 |
|
| Module-wise count rates for Quadrant A Data is divided into 100 sec bins |
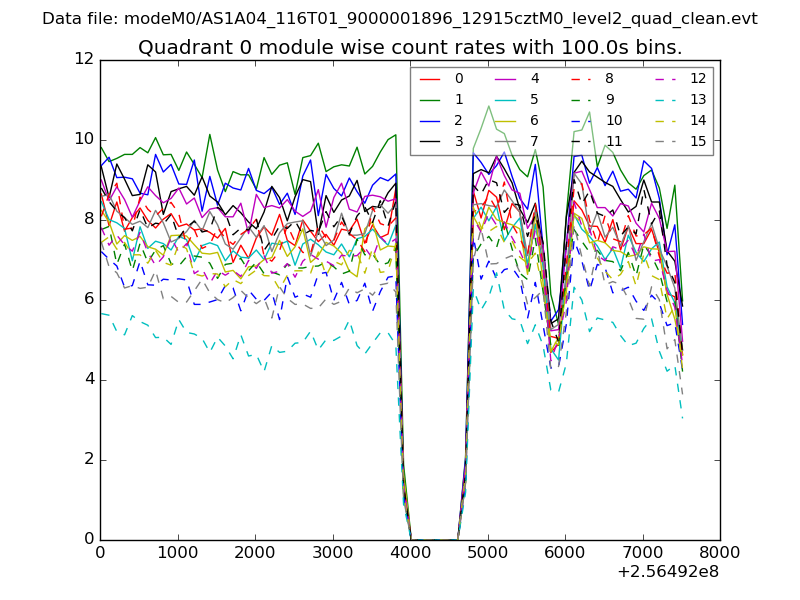 |
 |
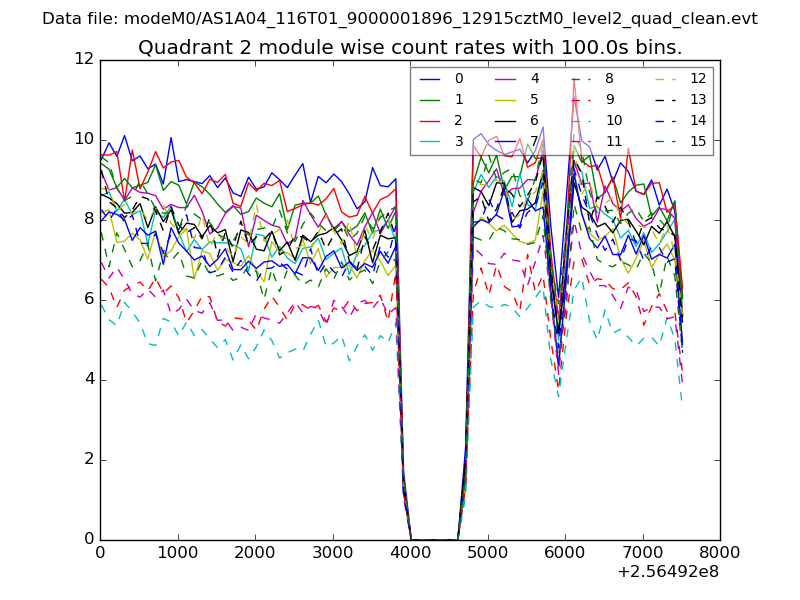
| Module-wise count rates for Quadrant B Data is divided into 100 sec bins |
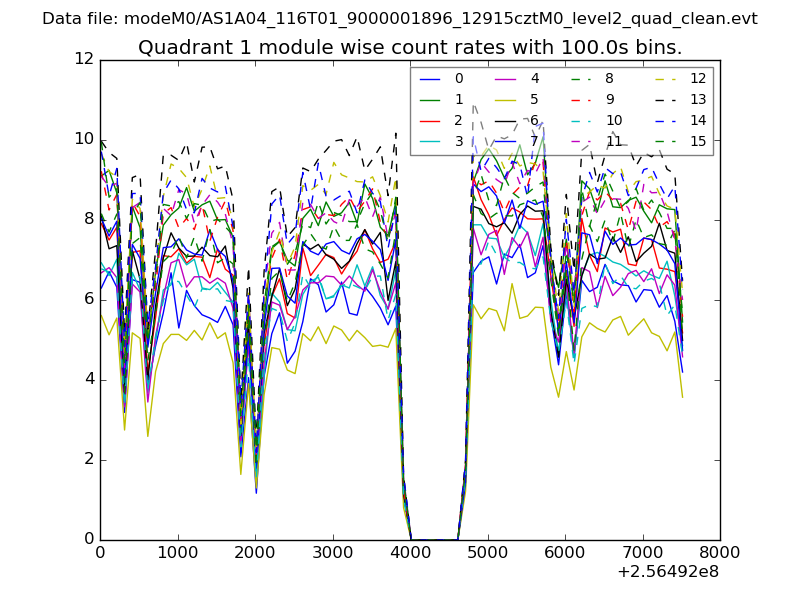 |
 |
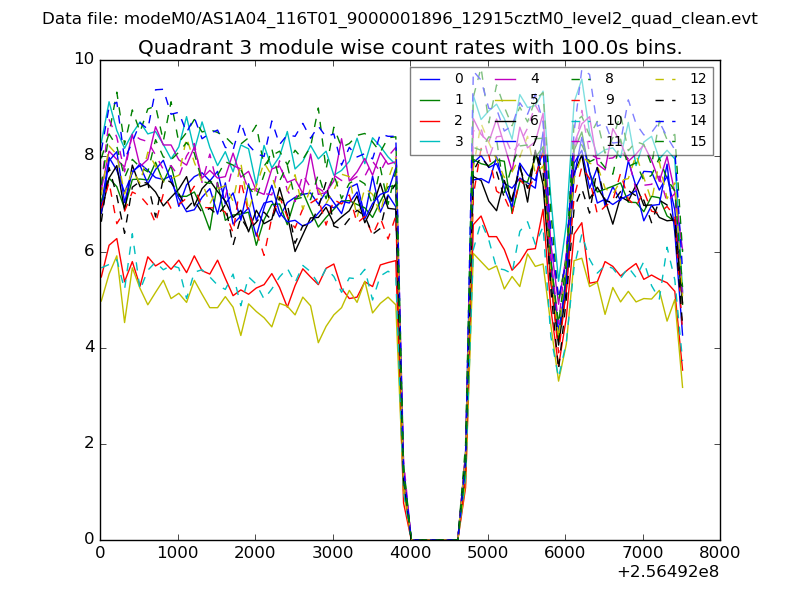
| Module-wise count rates for Quadrant C Data is divided into 100 sec bins |
 |
 |
| Module-wise count rates for Quadrant D Data is divided into 100 sec bins |
 |
 |
| Parameter | Plot |
|---|---|
| CZT HV Monitor | 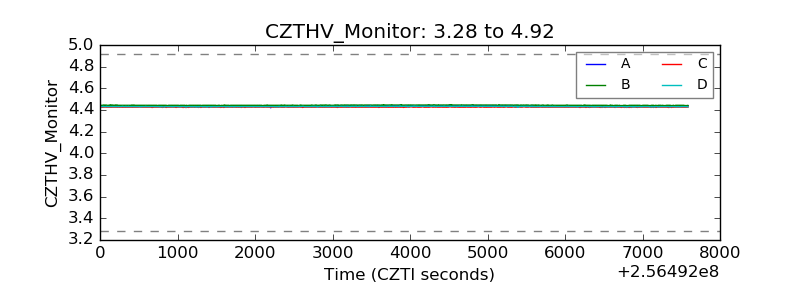 |
| D_VDD | 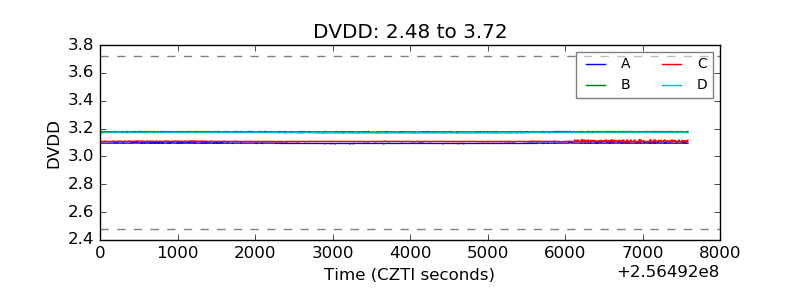 |
| Temperature 1 | 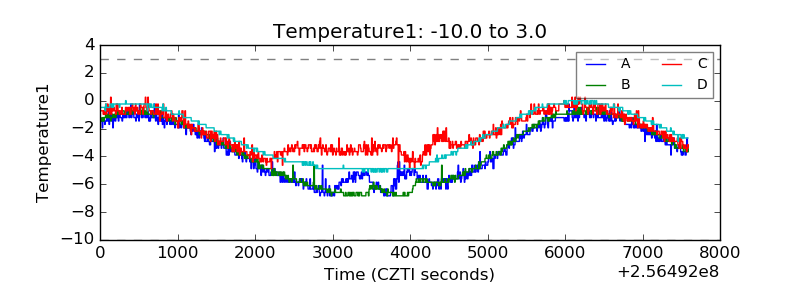 |
| Veto HV Monitor | 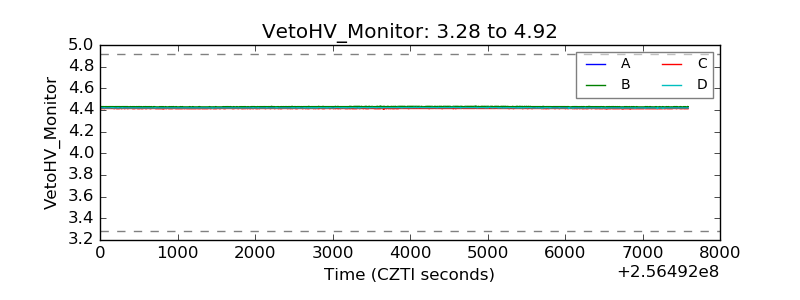 |
| Veto LLD | 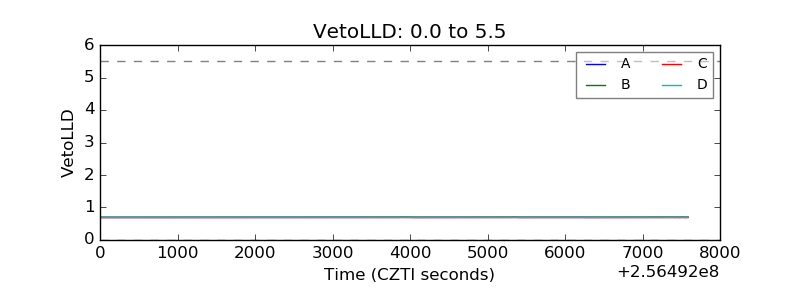 |
| Alpha Counter | 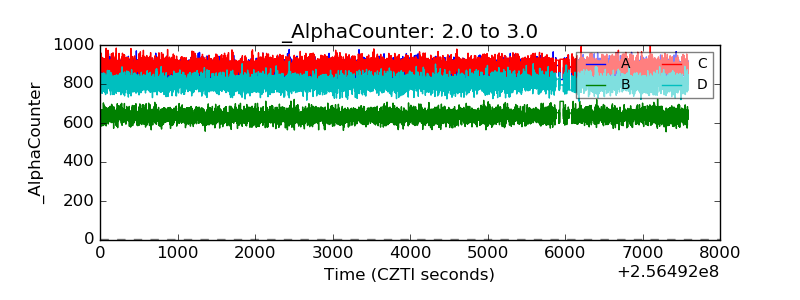 |
| _CPM_Rate | 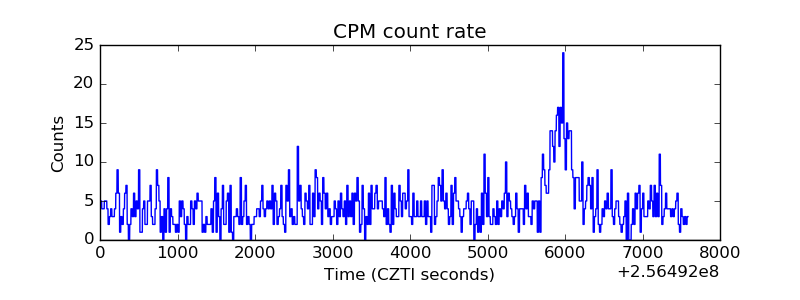 |
| CZT Counter | 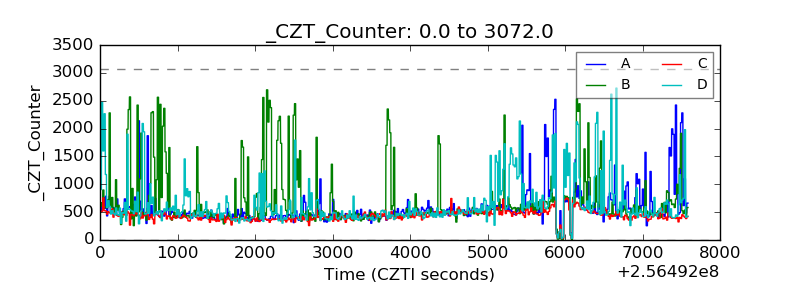 |
| +2.5 Volts monitor |  |
| +5 Volts monitor |  |
| _ROLL_ROT | 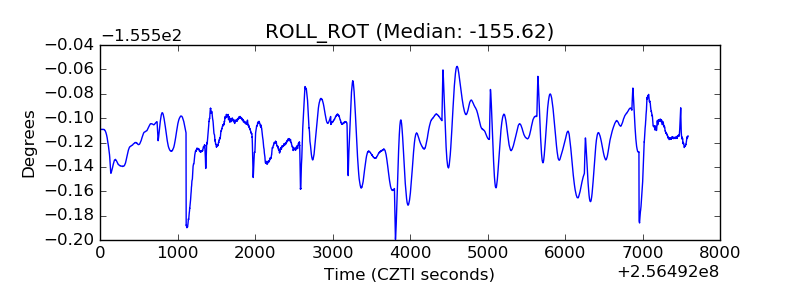 |
| _Roll_DEC | 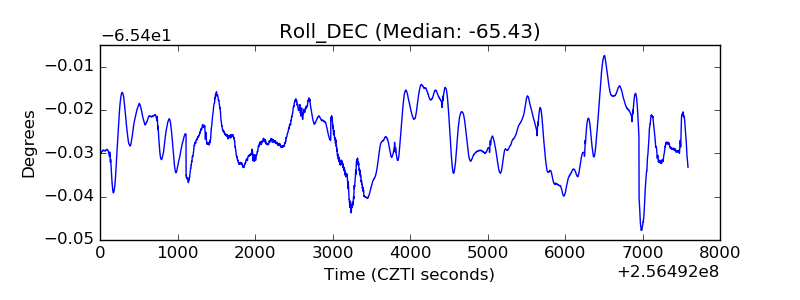 |
| _Roll_RA | 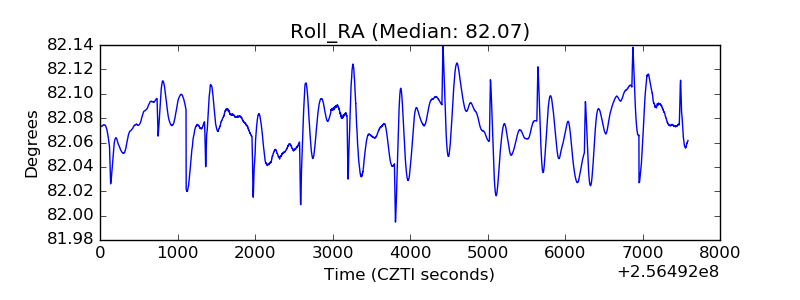 |
| Veto Counter | 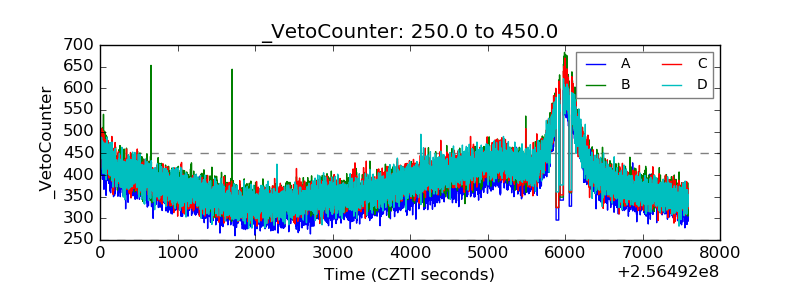 |