| Param | Original file | Final file |
|---|---|---|
| Filename | modeM0/AS1A04_116T01_9000001896_12916cztM0_level2.evt | modeM0/AS1A04_116T01_9000001896_12916cztM0_level2_quad_clean.evt |
| Size (bytes) | 656,573,760 | 127,175,040 |
| Size | 626.2 MB | 121.3 MB |
| Events in quadrant A | 4,714,547 | 844,608 |
| Events in quadrant B | 4,964,881 | 811,273 |
| Events in quadrant C | 3,493,426 | 855,253 |
| Events in quadrant D | 6,176,944 | 791,625 |
| Mode M9 | |||
|---|---|---|---|
| Quadrant | BADHDUFLAG | Total packets | Discarded packets |
| A | 0 | 2 | 0 |
| B | 0 | 2 | 0 |
| C | 0 | 2 | 0 |
| D | 0 | 2 | 0 |
| Mode SS | |||
|---|---|---|---|
| Quadrant | BADHDUFLAG | Total packets | Discarded packets |
| A | 0 | 162 | 0 |
| B | 0 | 162 | 0 |
| C | 0 | 162 | 0 |
| D | 0 | 162 | 0 |
| Mode M0 | |||
|---|---|---|---|
| Quadrant | BADHDUFLAG | Total packets | Discarded packets |
| A | 0 | 19249 | 4 |
| B | 0 | 19991 | 3 |
| C | 0 | 16192 | 3 |
| D | 0 | 23781 | 3 |
| Quadrant | Total seconds | Saturated seconds | Saturation percentage |
|---|---|---|---|
| A | 7881 | 361 | 4.580637% |
| B | 7881 | 781 | 9.909910% |
| C | 7881 | 31 | 0.393351% |
| D | 7881 | 561 | 7.118386% |
Noise dominated data is calculated using 1-second bins in cleaned event files. If a bin has >2000 counts, and if more than 50% of those come from <1% of pixels, then it is considered to be noise-dominated and hence unusable.
| Quadrant | # 1 sec bins | Bins with >0 counts | Bins with >2000 counts | High rate bins dominated by noise | Noise dominated (total time) | Noise dominated (detector-on time) | Marked lightcurve |
|---|---|---|---|---|---|---|---|
| A | 8177 | 7886 | 168 | 168 | 2.05% | 2.13% | 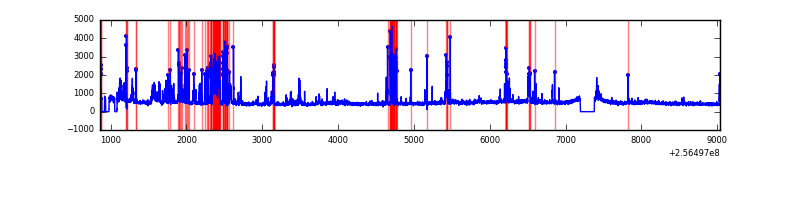 |
| B | 8177 | 7886 | 249 | 249 | 3.05% | 3.16% | 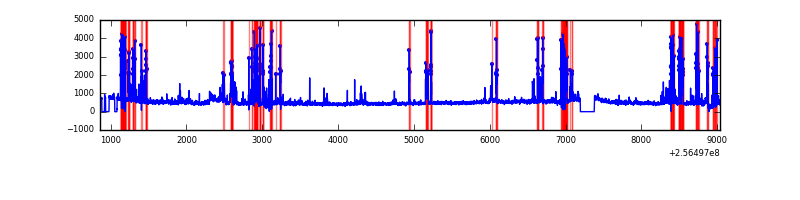 |
| C | 8177 | 7886 | 2 | 2 | 0.02% | 0.03% | 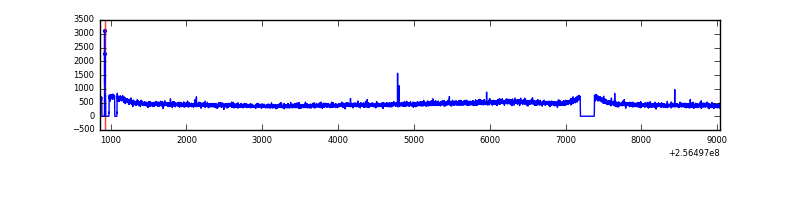 |
| D | 8177 | 7886 | 415 | 415 | 5.08% | 5.26% | 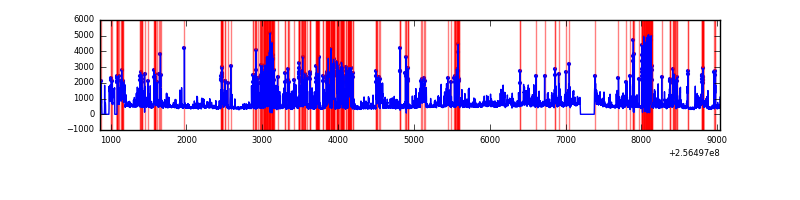 |
Top three noisy pixels from each quadrant. If the there are fewer than three noisy pixels in the level2.evt file, extra rows are filled as -1
| Pixel properties | Quadrant properties | ||||||
|---|---|---|---|---|---|---|---|
| Quadrant | DetID | PixID | Counts | Sigma | Mean | Median | Sigma |
| A | 15 | 223 | 524702 | 2829.76 | 913 | 893 | 185.1 |
| A | 15 | 174 | 222945 | 1199.59 | 913 | 893 | 185.1 |
| A | 15 | 239 | 206235 | 1109.32 | 913 | 893 | 185.1 |
| B | 4 | 239 | 1193083 | 7161.52 | 878 | 854 | 166.5 |
| B | 3 | 209 | 136862 | 816.98 | 878 | 854 | 166.5 |
| B | 3 | 64 | 136737 | 816.23 | 878 | 854 | 166.5 |
| C | 3 | 233 | 6898 | 29.14 | 890 | 892 | 206.1 |
| C | 13 | 61 | 6566 | 27.53 | 890 | 892 | 206.1 |
| C | 8 | 128 | 4548 | 17.74 | 890 | 892 | 206.1 |
| D | 1 | 52 | 2652368 | 12650.22 | 864 | 840 | 209.6 |
| D | 8 | 195 | 171447 | 813.95 | 864 | 840 | 209.6 |
| D | 12 | 221 | 43087 | 201.56 | 864 | 840 | 209.6 |
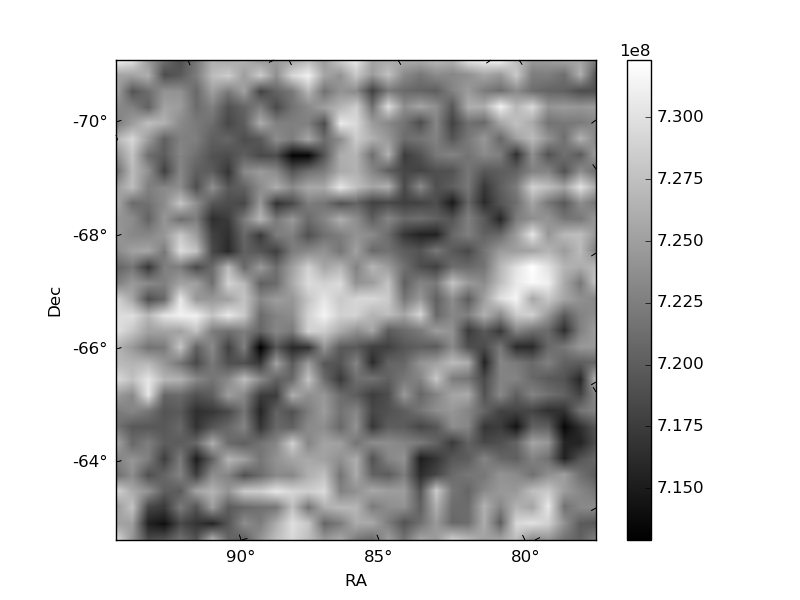
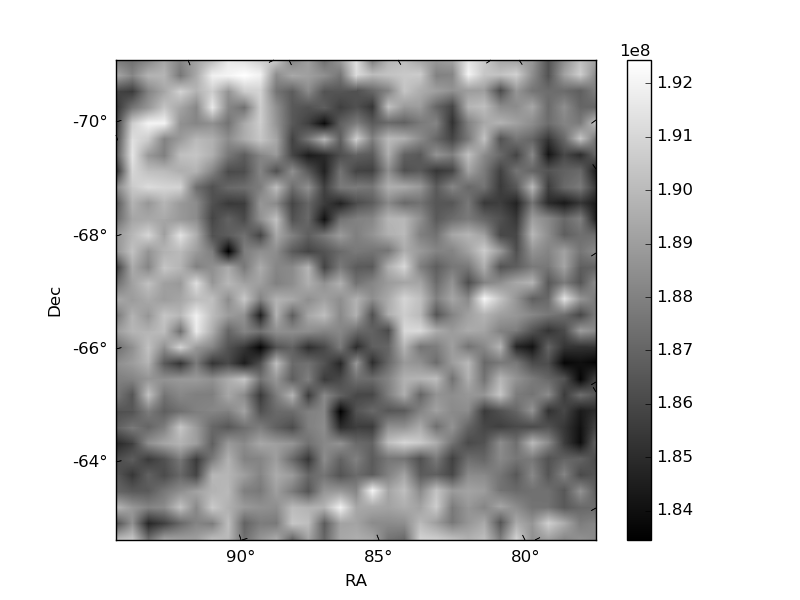
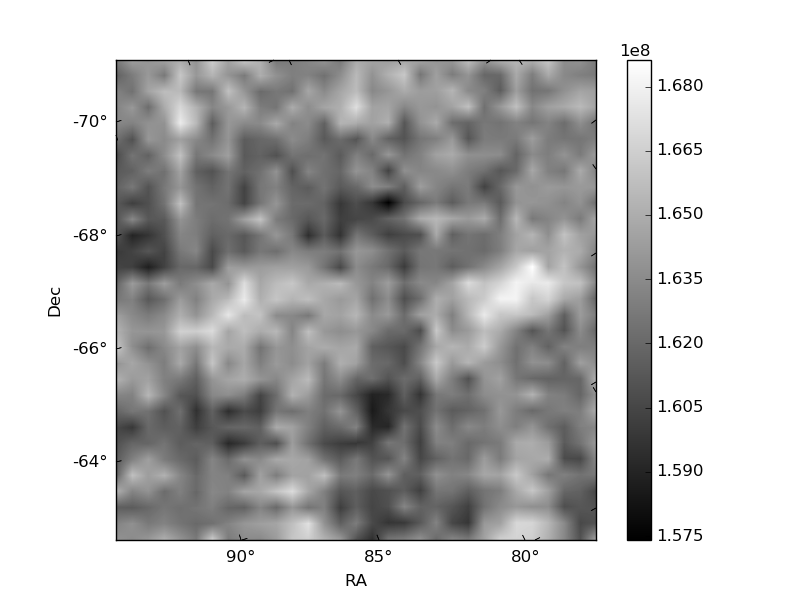
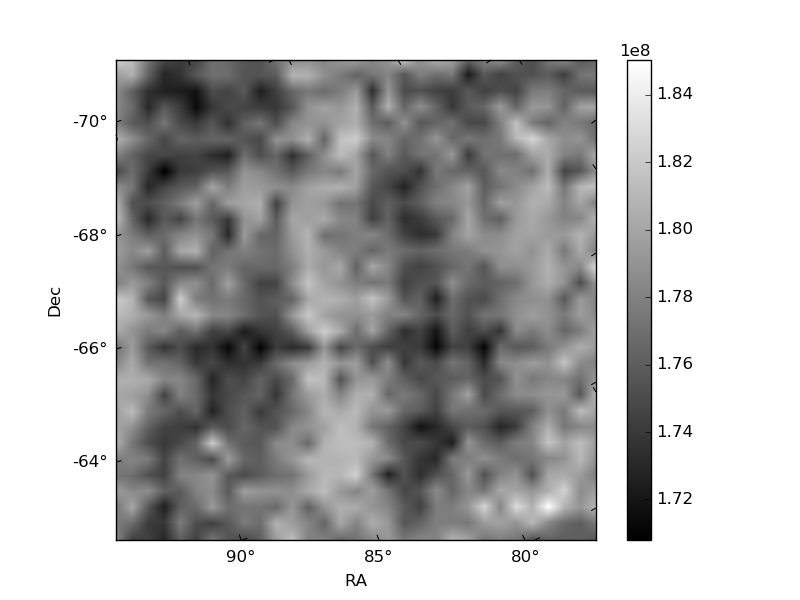
Histogram calculated using DETX and DETY for each event in the final _common_clean file
| Quadrant A | 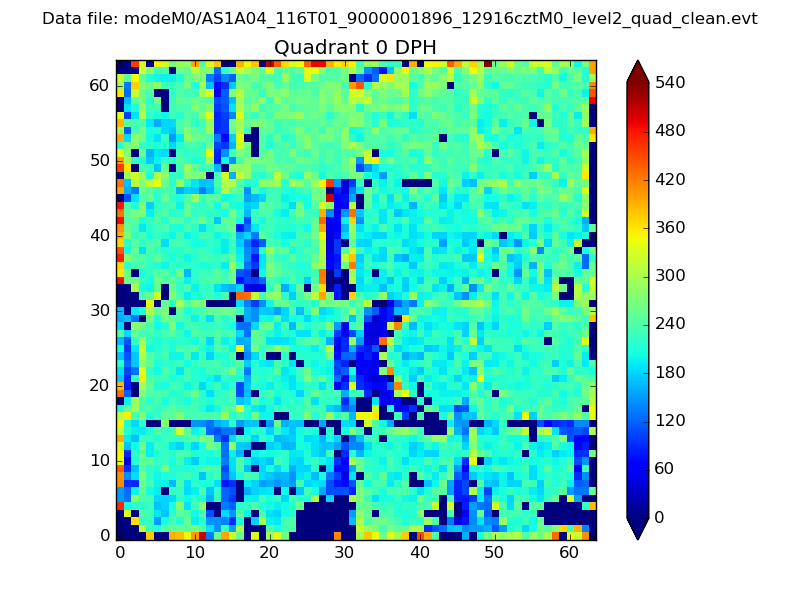 |
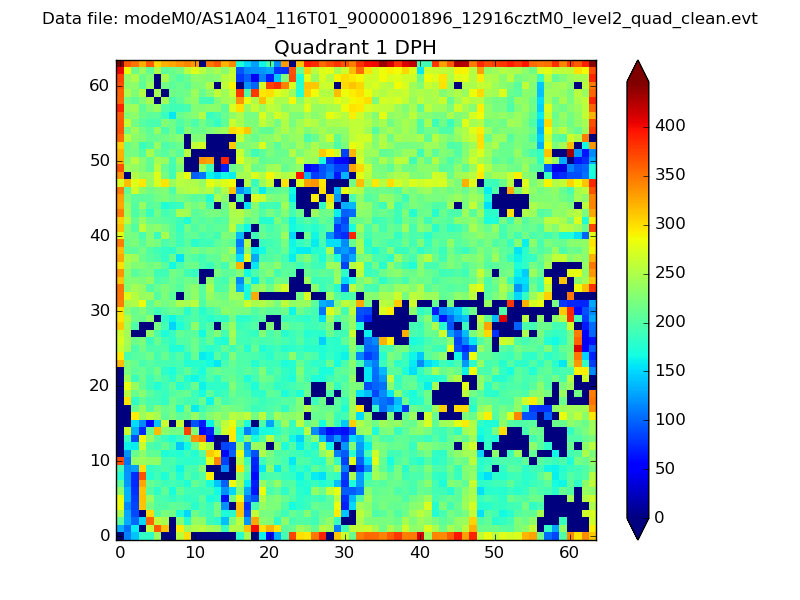 |
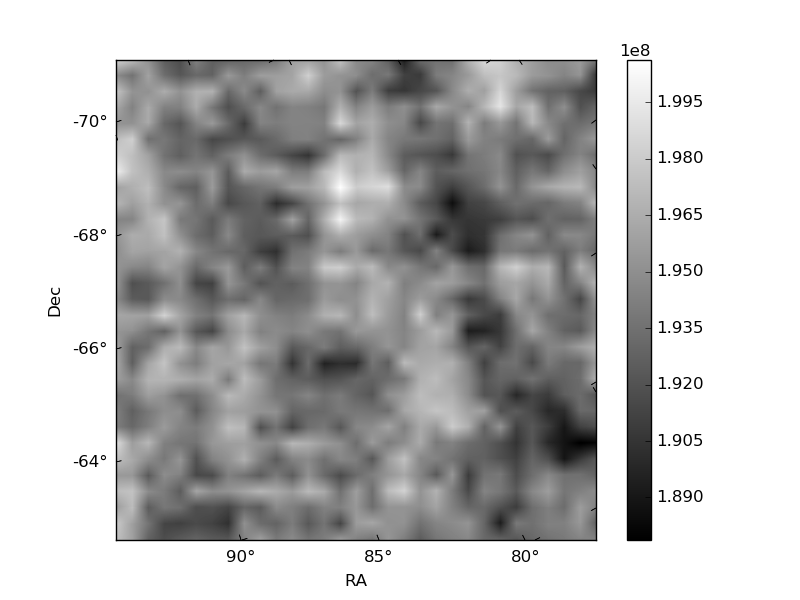
Quadrant B |
|---|---|---|---|
| Quadrant D | 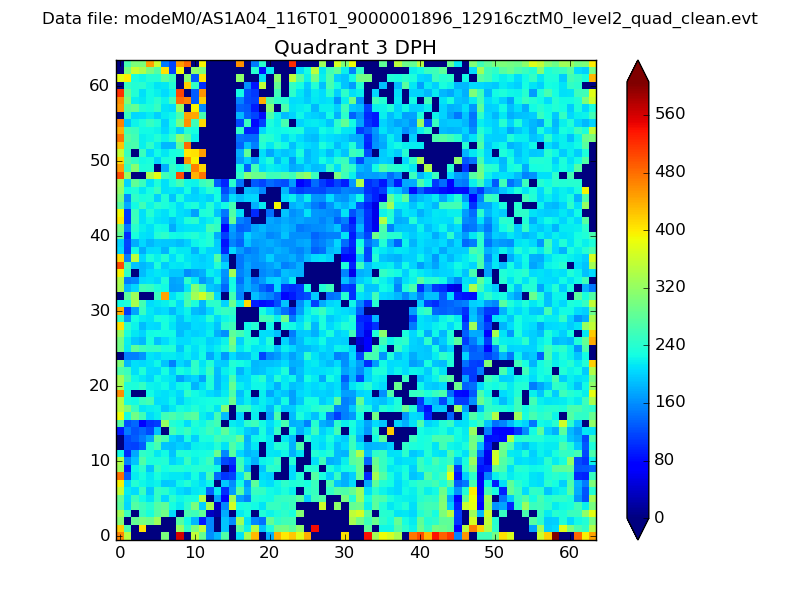 |
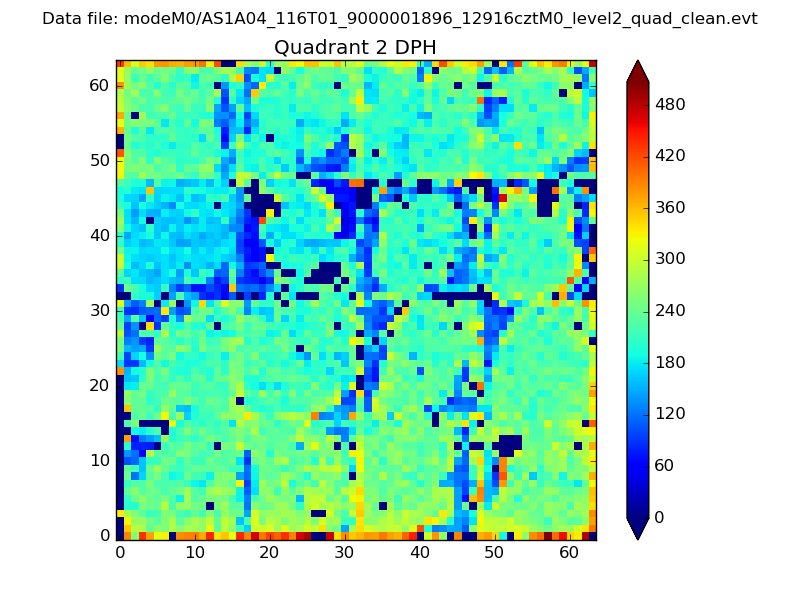 |
Quadrant C |
| Plot type | Count rate plots | Images |
|---|---|---|
| Comparison with Poisson distribution Blue bars denote a histogram of data divided into 1 sec bins. Red curve is a Poisson curve with rate = median count rate of data. |
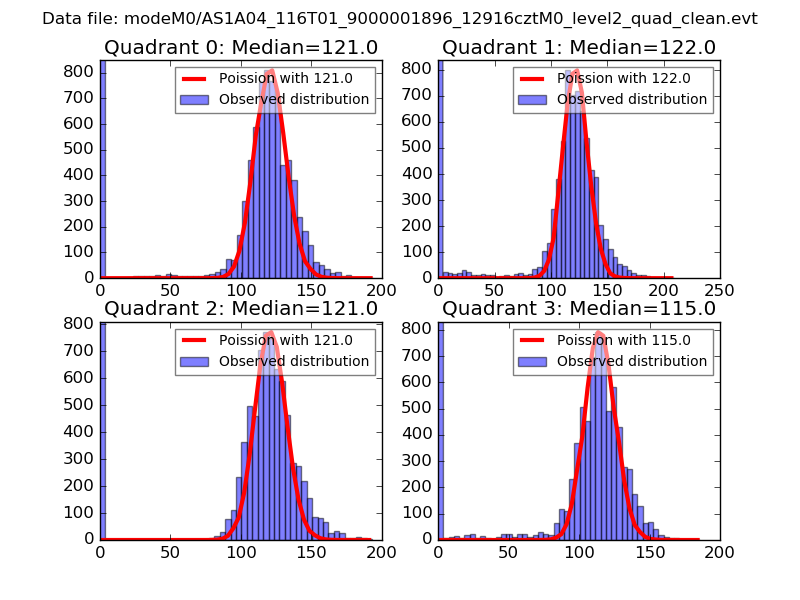 |
 |
| Quadrant-wise count rates Data is divided into 100 sec bins |
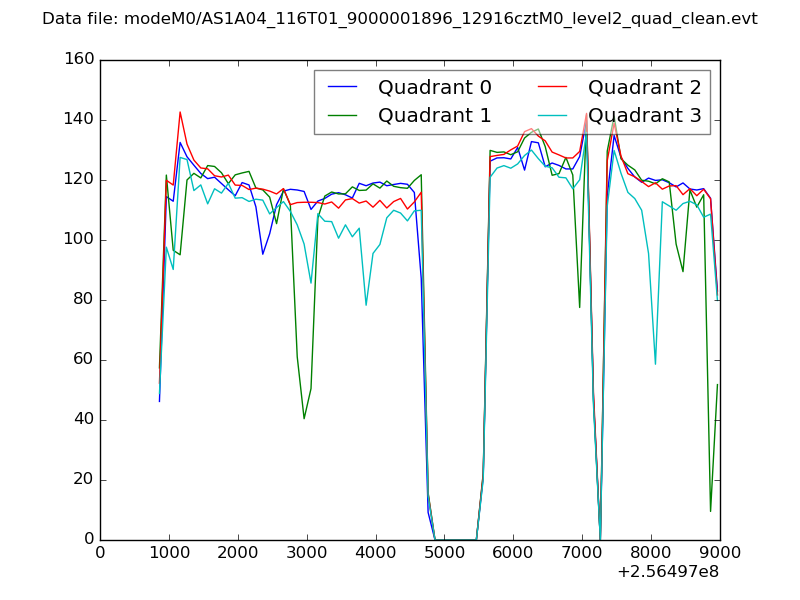 |
|
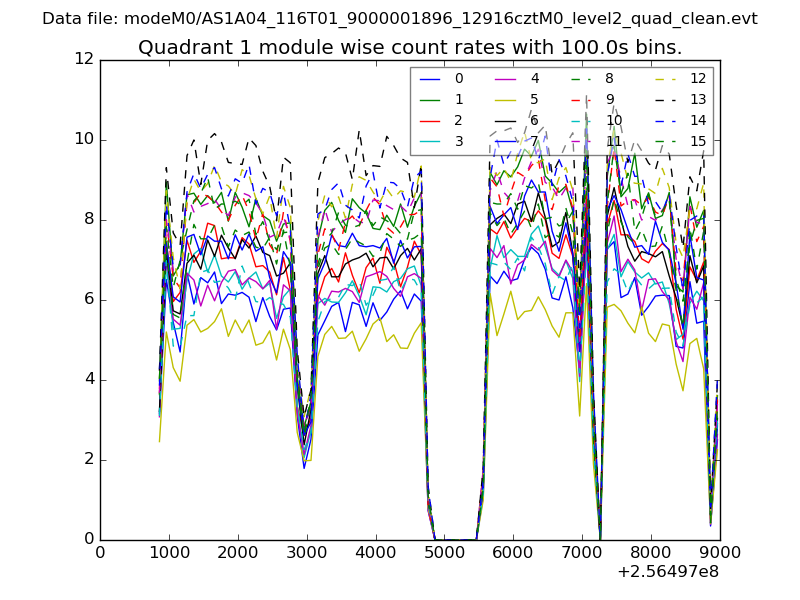
| Module-wise count rates for Quadrant A Data is divided into 100 sec bins |
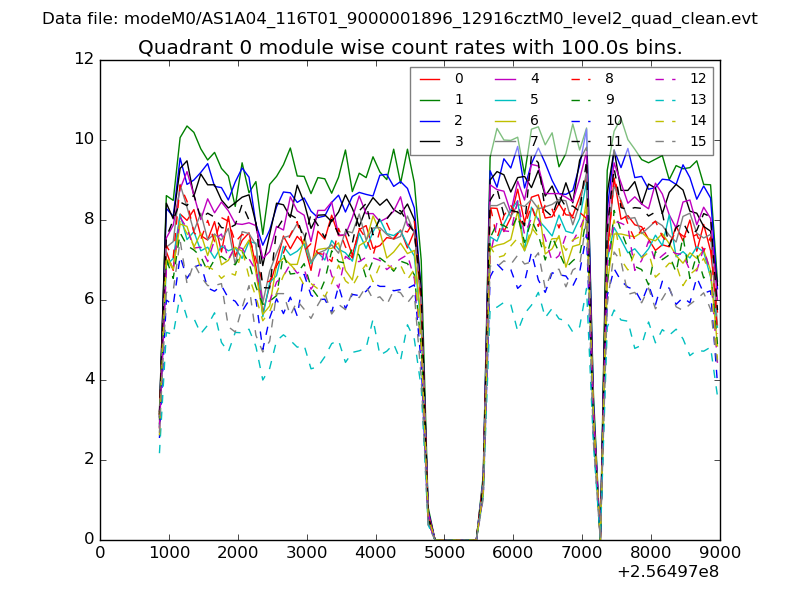 |
 |
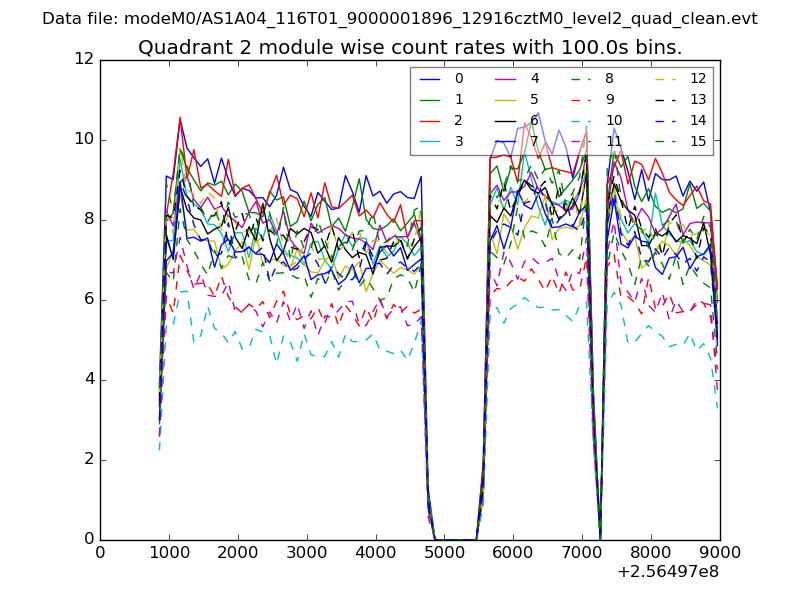
| Module-wise count rates for Quadrant B Data is divided into 100 sec bins |
 |
 |
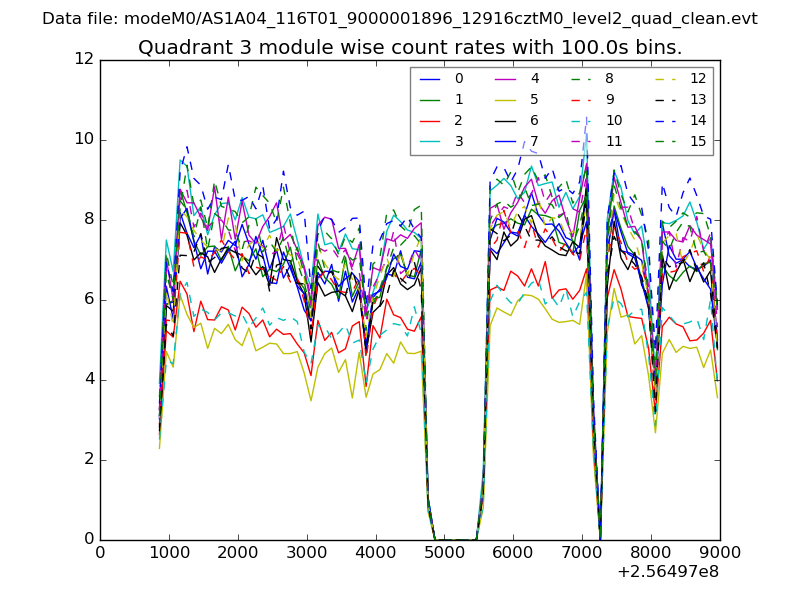
| Module-wise count rates for Quadrant C Data is divided into 100 sec bins |
 |
 |
| Module-wise count rates for Quadrant D Data is divided into 100 sec bins |
 |
 |
| Parameter | Plot |
|---|---|
| CZT HV Monitor | 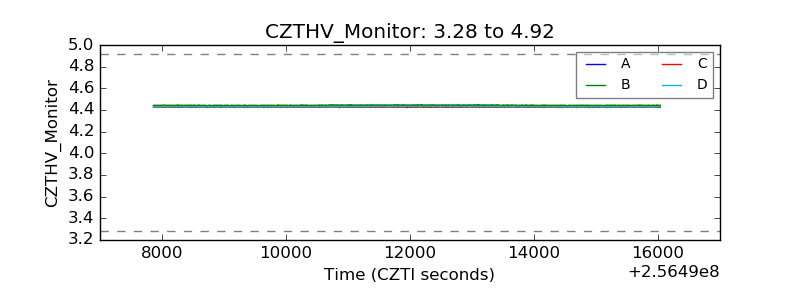 |
| D_VDD | 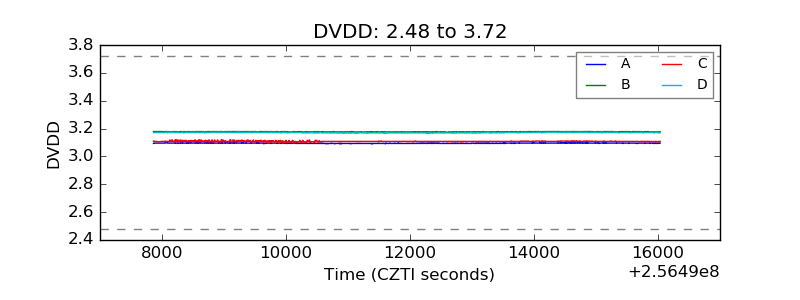 |
| Temperature 1 | 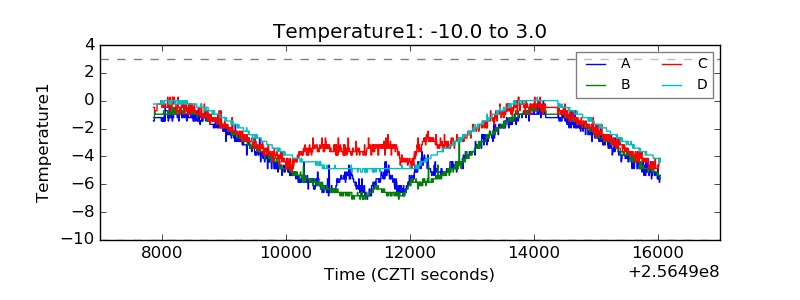 |
| Veto HV Monitor | 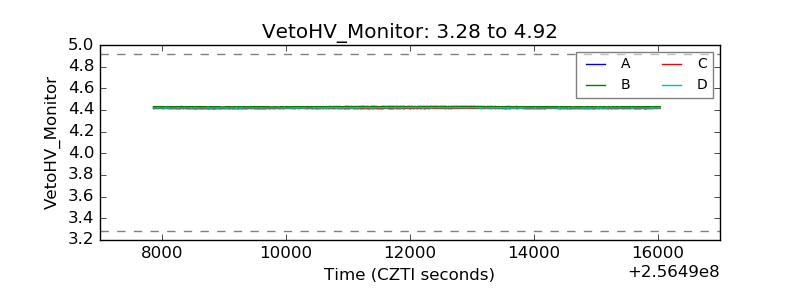 |
| Veto LLD | 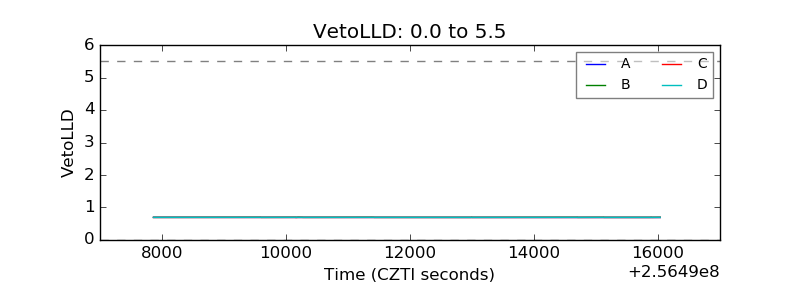 |
| Alpha Counter | 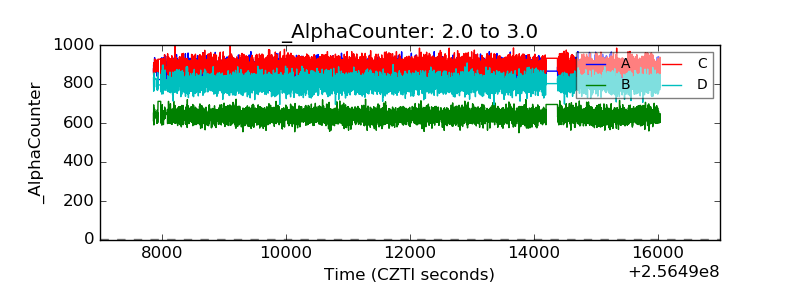 |
| _CPM_Rate | 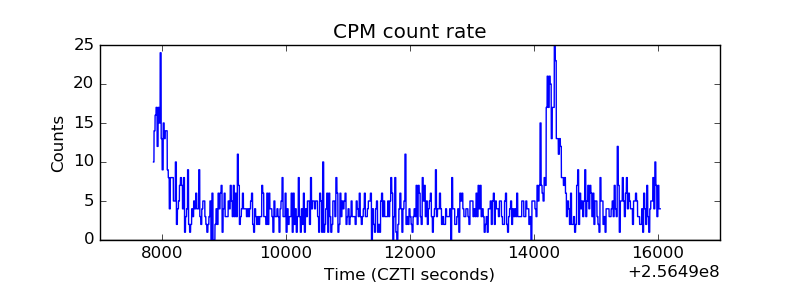 |
| CZT Counter | 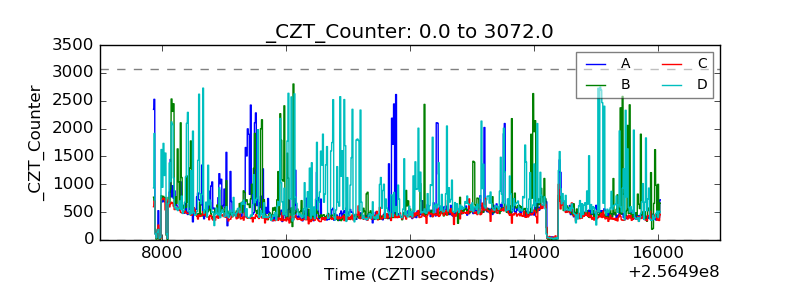 |
| +2.5 Volts monitor |  |
| +5 Volts monitor |  |
| _ROLL_ROT | 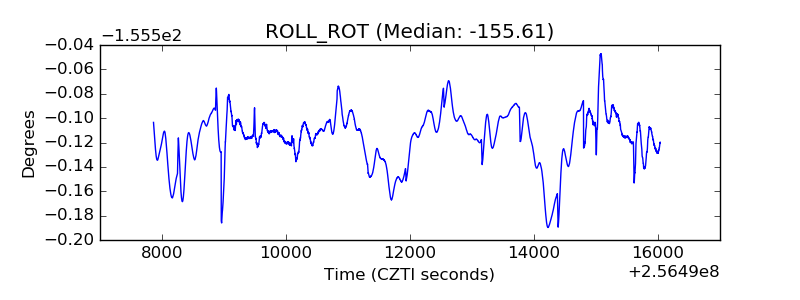 |
| _Roll_DEC | 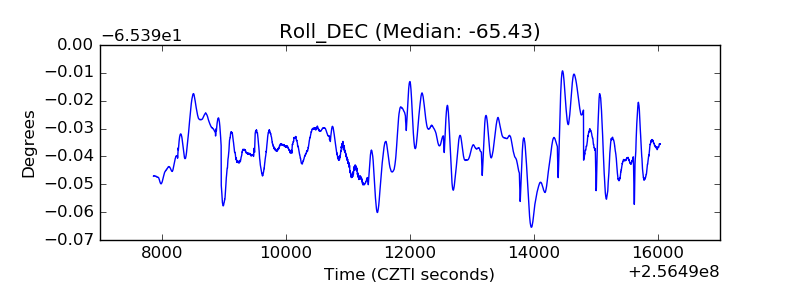 |
| _Roll_RA | 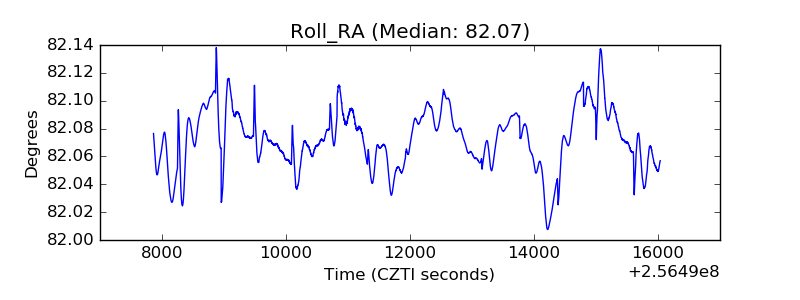 |
| Veto Counter | 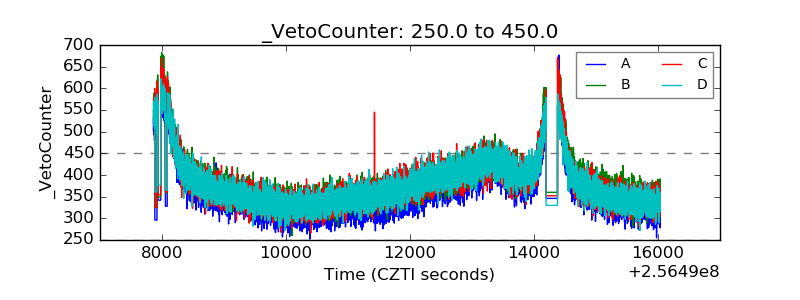 |