| Param | Original file | Final file |
|---|---|---|
| Filename | modeM0/AS1A04_116T01_9000001896_12922cztM0_level2.evt | modeM0/AS1A04_116T01_9000001896_12922cztM0_level2_quad_clean.evt |
| Size (bytes) | 469,520,640 | 89,075,520 |
| Size | 447.8 MB | 84.9 MB |
| Events in quadrant A | 3,061,544 | 587,291 |
| Events in quadrant B | 4,175,623 | 547,485 |
| Events in quadrant C | 2,746,048 | 594,678 |
| Events in quadrant D | 3,830,556 | 550,631 |
| Mode M9 | |||
|---|---|---|---|
| Quadrant | BADHDUFLAG | Total packets | Discarded packets |
| A | 0 | 11 | 0 |
| B | 0 | 11 | 0 |
| C | 0 | 11 | 0 |
| D | 0 | 11 | 0 |
| Mode SS | |||
|---|---|---|---|
| Quadrant | BADHDUFLAG | Total packets | Discarded packets |
| A | 0 | 122 | 0 |
| B | 0 | 122 | 0 |
| C | 0 | 122 | 0 |
| D | 0 | 122 | 0 |
| Mode M0 | |||
|---|---|---|---|
| Quadrant | BADHDUFLAG | Total packets | Discarded packets |
| A | 0 | 12764 | 2 |
| B | 0 | 16365 | 1 |
| C | 0 | 12210 | 1 |
| D | 0 | 15379 | 1 |
| Quadrant | Total seconds | Saturated seconds | Saturation percentage |
|---|---|---|---|
| A | 5968 | 53 | 0.888070% |
| B | 5968 | 656 | 10.991957% |
| C | 5968 | 8 | 0.134048% |
| D | 5968 | 256 | 4.289544% |
Noise dominated data is calculated using 1-second bins in cleaned event files. If a bin has >2000 counts, and if more than 50% of those come from <1% of pixels, then it is considered to be noise-dominated and hence unusable.
| Quadrant | # 1 sec bins | Bins with >0 counts | Bins with >2000 counts | High rate bins dominated by noise | Noise dominated (total time) | Noise dominated (detector-on time) | Marked lightcurve |
|---|---|---|---|---|---|---|---|
| A | 7099 | 5970 | 16 | 16 | 0.23% | 0.27% | 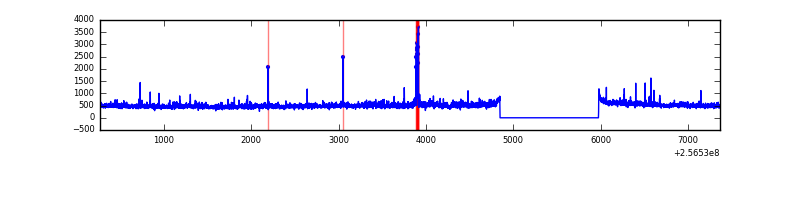 |
| B | 7099 | 5970 | 346 | 346 | 4.87% | 5.80% | 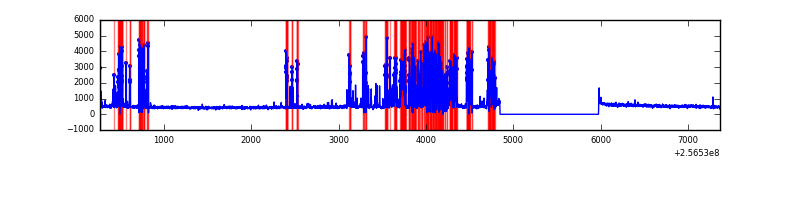 |
| C | 7099 | 5970 | 0 | 0 | 0.00% | 0.00% | 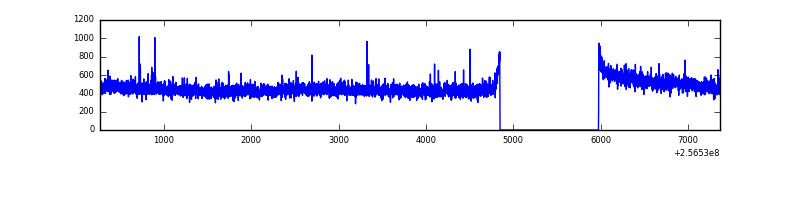 |
| D | 7099 | 5970 | 191 | 191 | 2.69% | 3.20% | 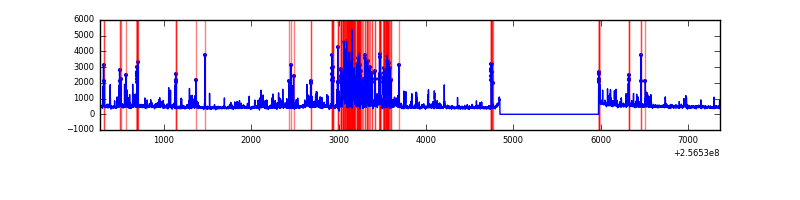 |
Top three noisy pixels from each quadrant. If the there are fewer than three noisy pixels in the level2.evt file, extra rows are filled as -1
| Pixel properties | Quadrant properties | ||||||
|---|---|---|---|---|---|---|---|
| Quadrant | DetID | PixID | Counts | Sigma | Mean | Median | Sigma |
| A | 1 | 162 | 95657 | 668.72 | 708 | 692 | 142.0 |
| A | 15 | 174 | 57914 | 402.94 | 708 | 692 | 142.0 |
| A | 1 | 178 | 46855 | 325.07 | 708 | 692 | 142.0 |
| B | 4 | 239 | 1415964 | 11286.1 | 669 | 653 | 125.4 |
| B | 3 | 64 | 115094 | 912.59 | 669 | 653 | 125.4 |
| B | 12 | 111 | 13499 | 102.44 | 669 | 653 | 125.4 |
| C | 4 | 112 | 14625 | 87.29 | 698 | 701 | 159.5 |
| C | 8 | 229 | 5094 | 27.54 | 698 | 701 | 159.5 |
| C | 13 | 61 | 5052 | 27.28 | 698 | 701 | 159.5 |
| D | 1 | 52 | 1033256 | 6387.5 | 678 | 657 | 161.7 |
| D | 8 | 195 | 80741 | 495.39 | 678 | 657 | 161.7 |
| D | 2 | 14 | 68313 | 418.51 | 678 | 657 | 161.7 |
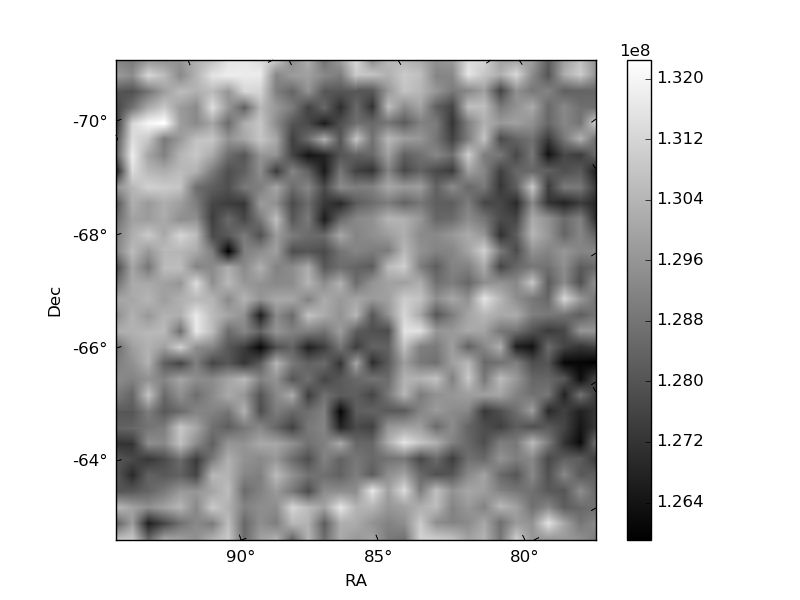
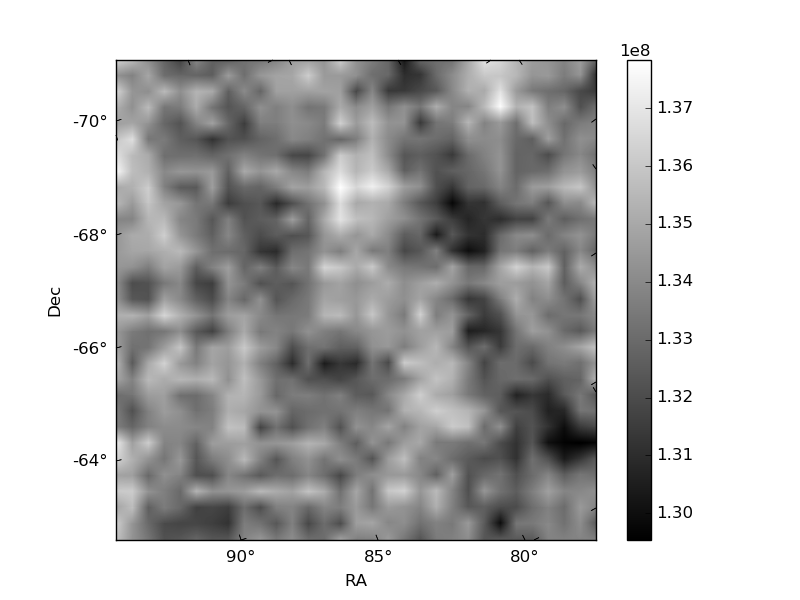
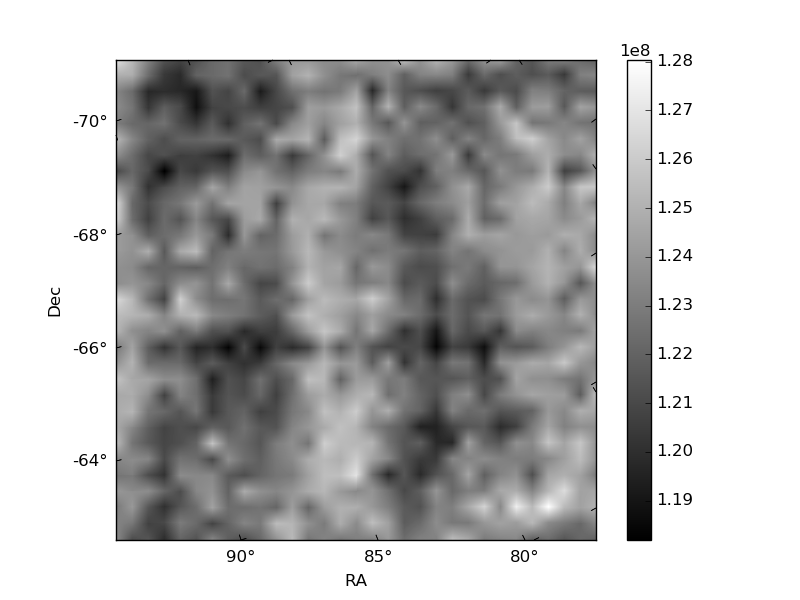
Histogram calculated using DETX and DETY for each event in the final _common_clean file
| Quadrant A | 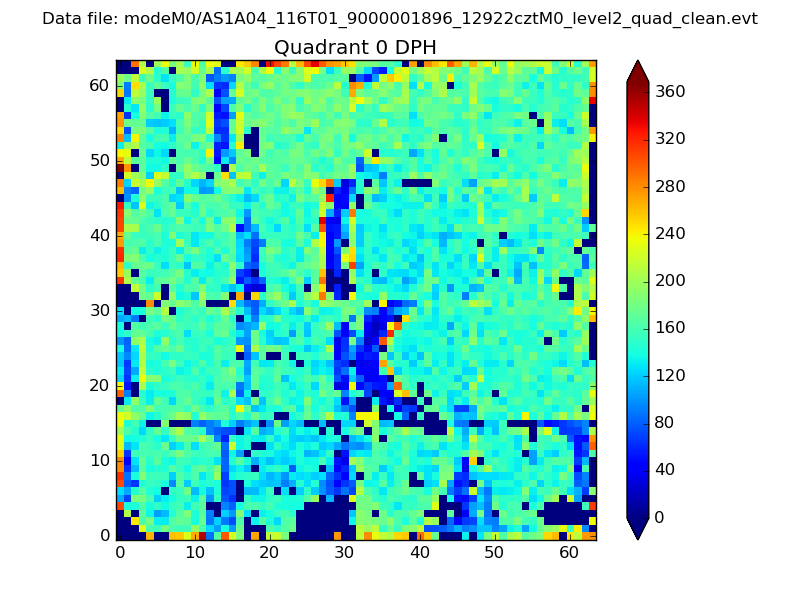 |
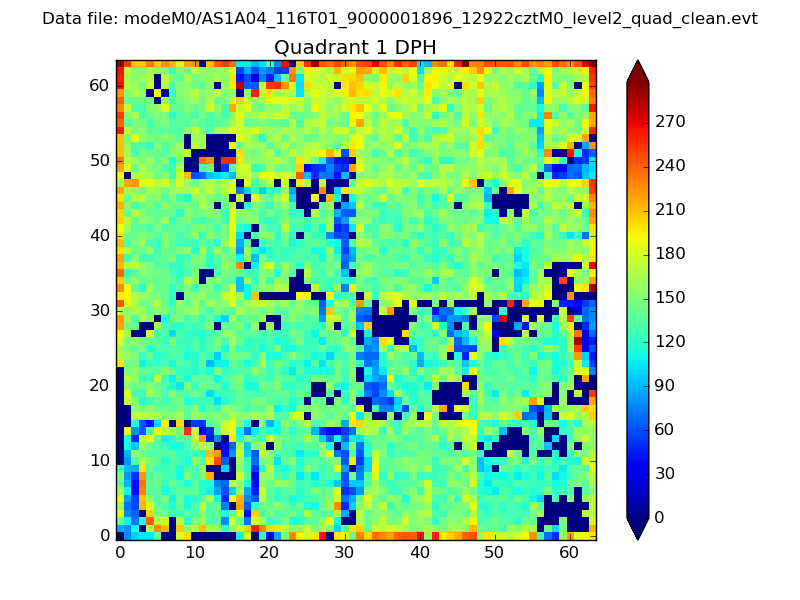 |
Quadrant B |
|---|---|---|---|
| Quadrant D | 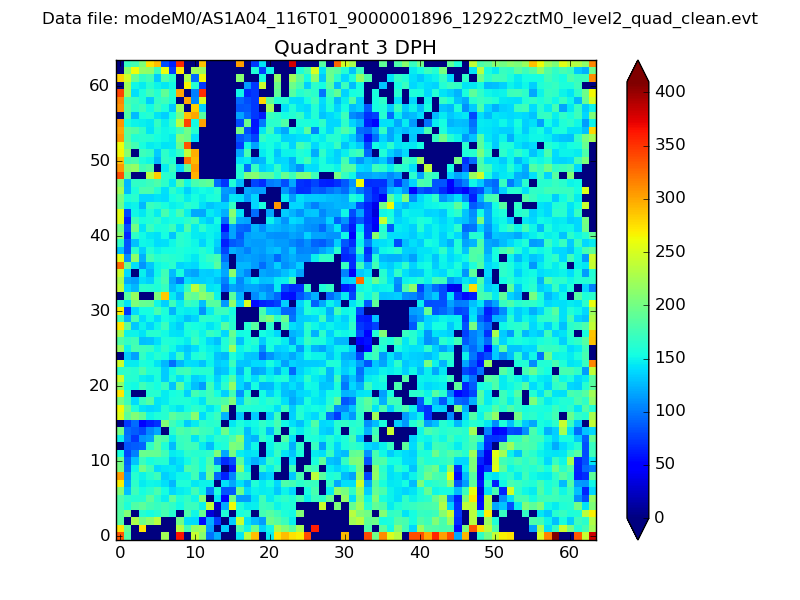 |
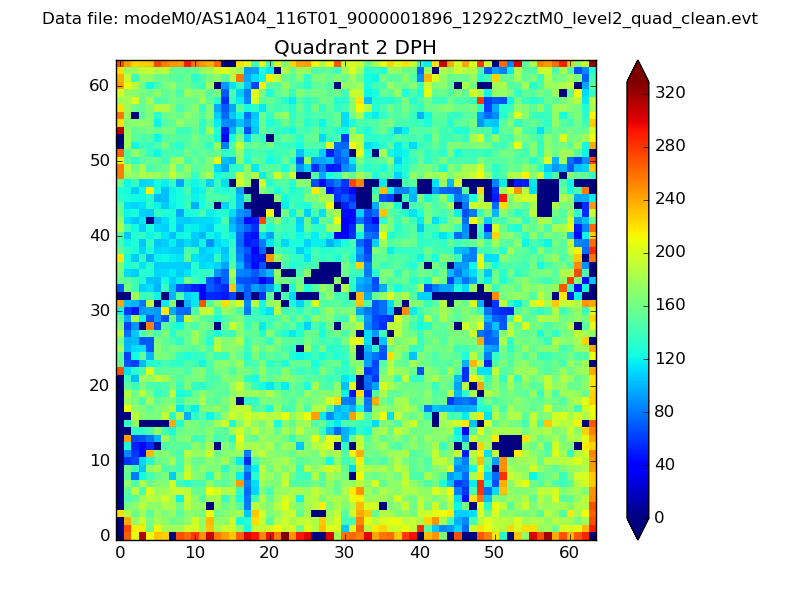 |
Quadrant C |
| Plot type | Count rate plots | Images |
|---|---|---|
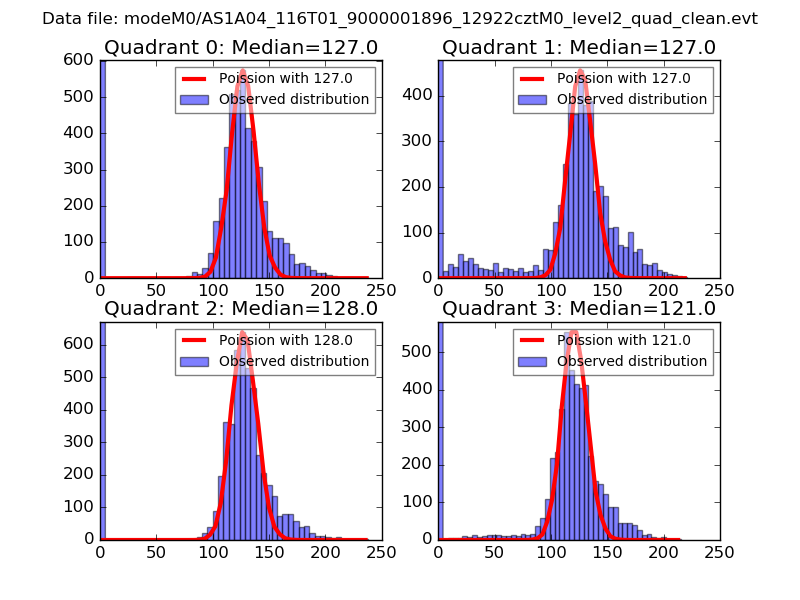
| Comparison with Poisson distribution Blue bars denote a histogram of data divided into 1 sec bins. Red curve is a Poisson curve with rate = median count rate of data. |
 |
 |
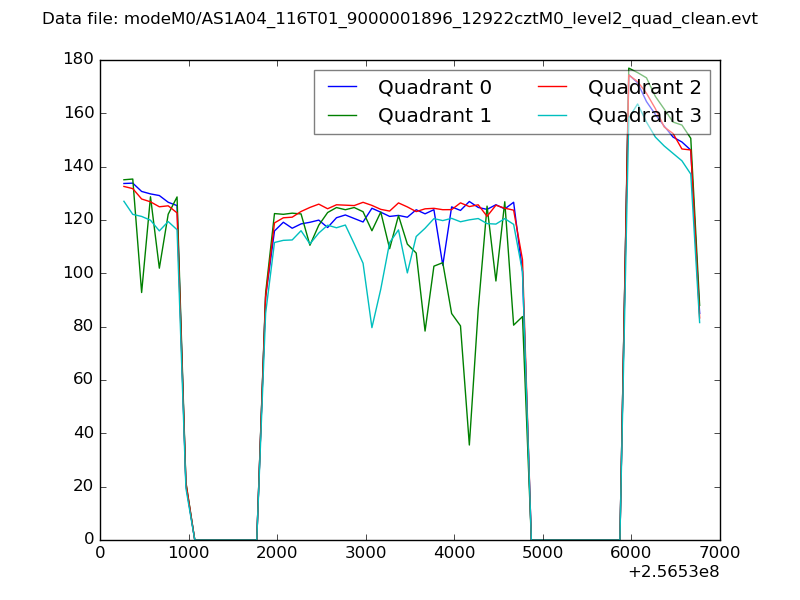
| Quadrant-wise count rates Data is divided into 100 sec bins |
 |
|
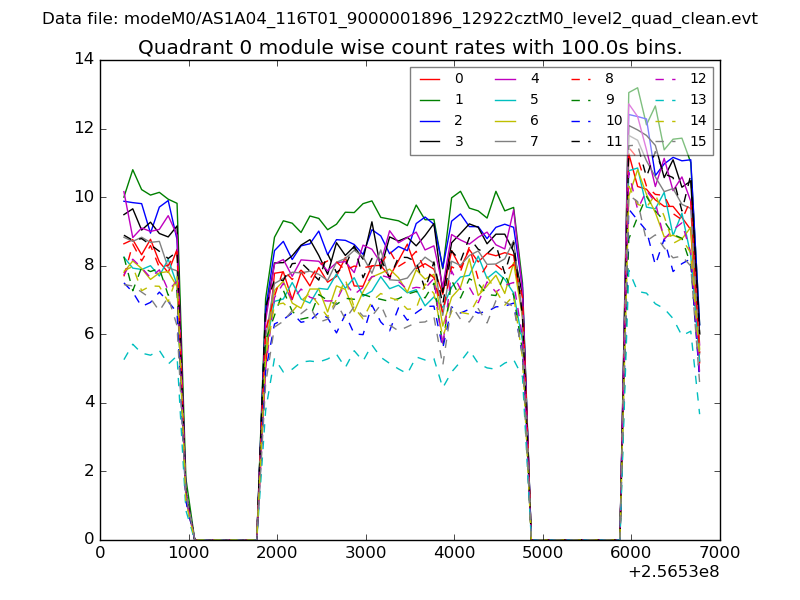
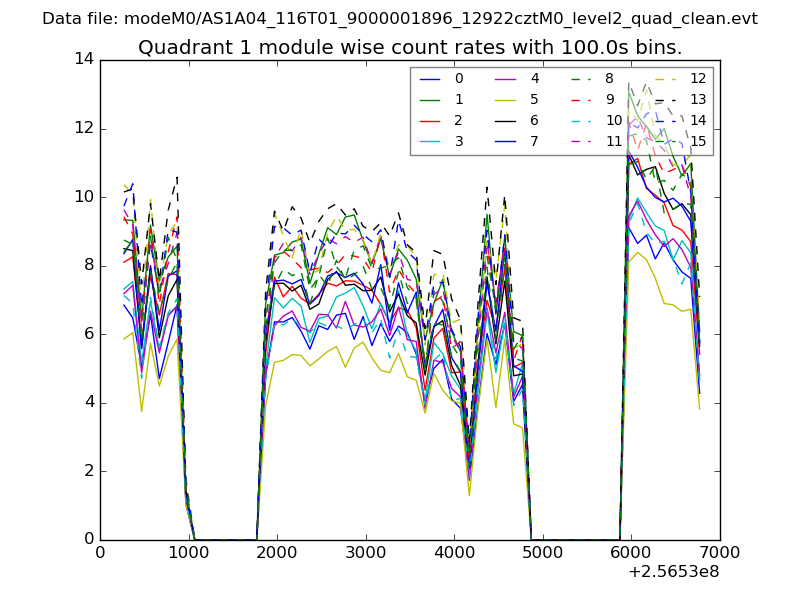
| Module-wise count rates for Quadrant A Data is divided into 100 sec bins |
 |
 |
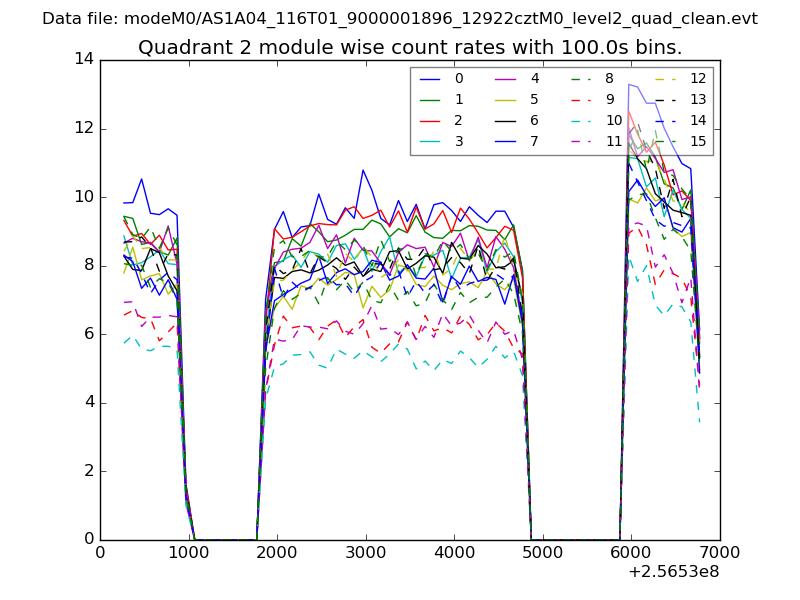
| Module-wise count rates for Quadrant B Data is divided into 100 sec bins |
 |
 |
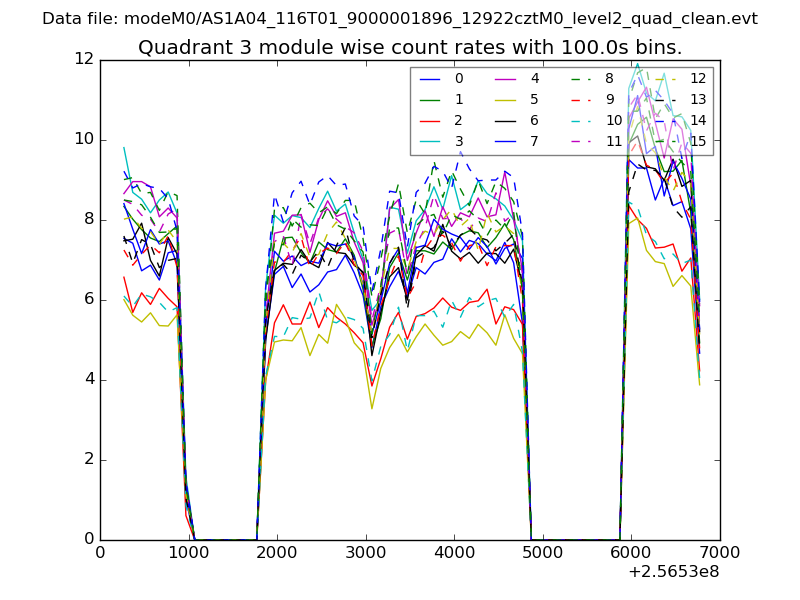
| Module-wise count rates for Quadrant C Data is divided into 100 sec bins |
 |
 |
| Module-wise count rates for Quadrant D Data is divided into 100 sec bins |
 |
 |
| Parameter | Plot |
|---|---|
| CZT HV Monitor | 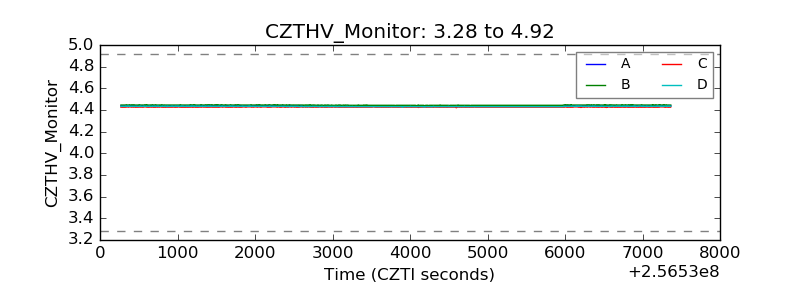 |
| D_VDD | 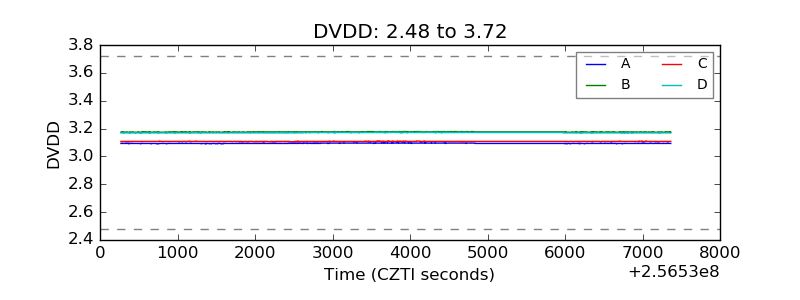 |
| Temperature 1 | 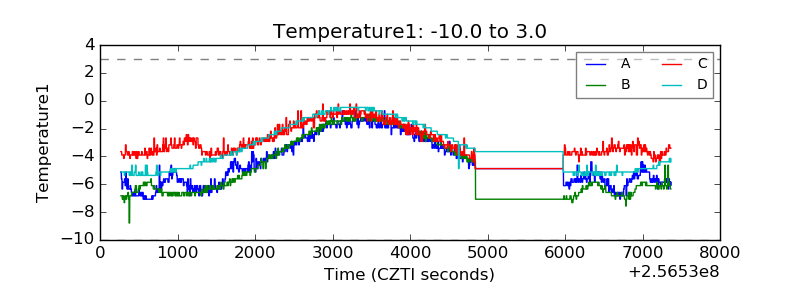 |
| Veto HV Monitor | 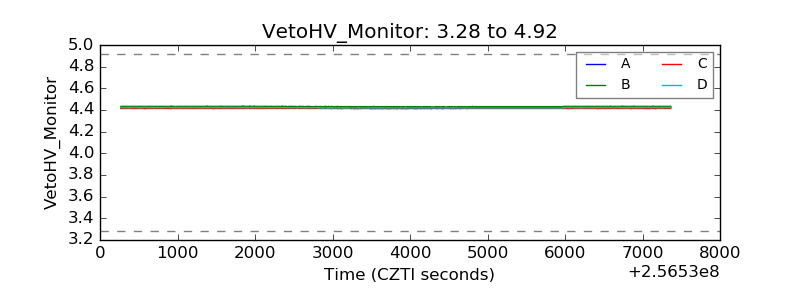 |
| Veto LLD | 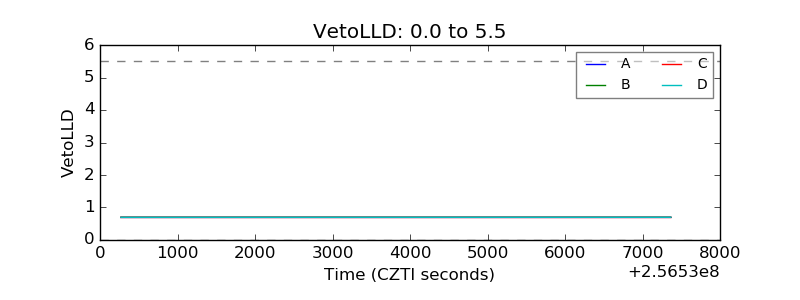 |
| Alpha Counter | 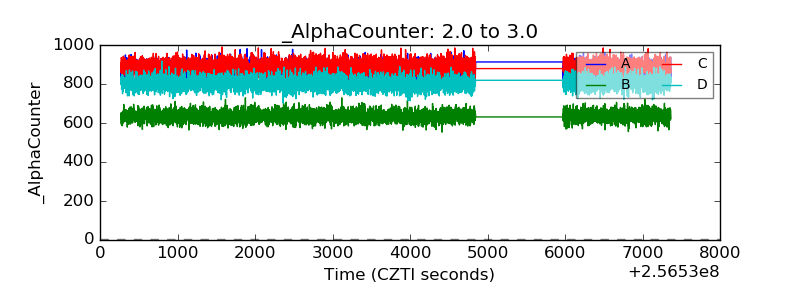 |
| _CPM_Rate | 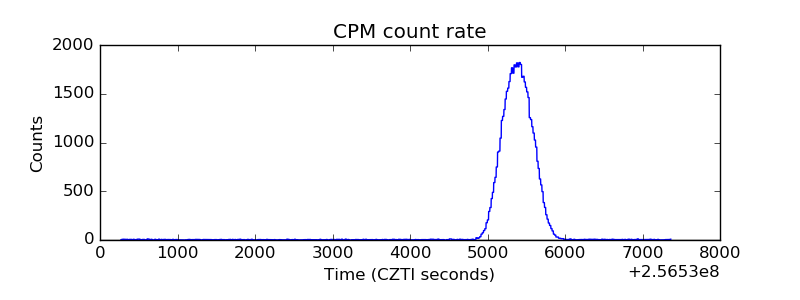 |
| CZT Counter |  |
| +2.5 Volts monitor |  |
| +5 Volts monitor |  |
| _ROLL_ROT | 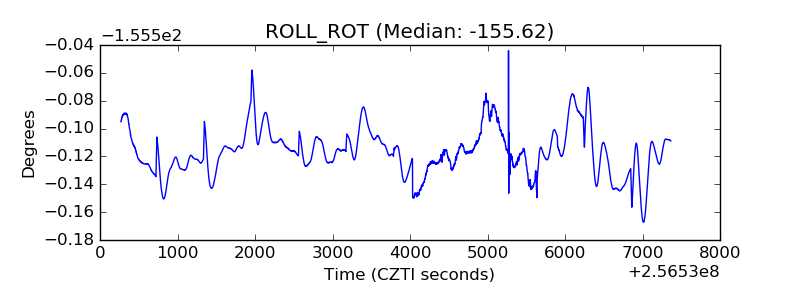 |
| _Roll_DEC | 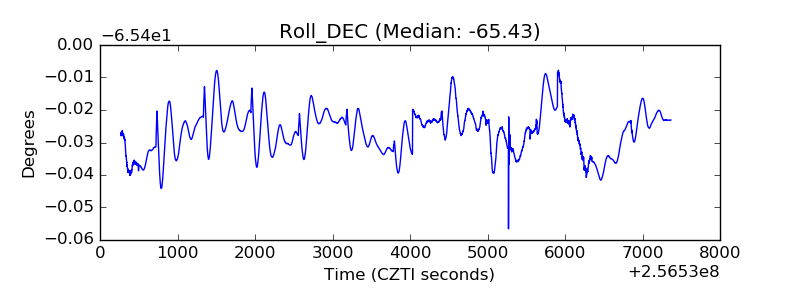 |
| _Roll_RA | 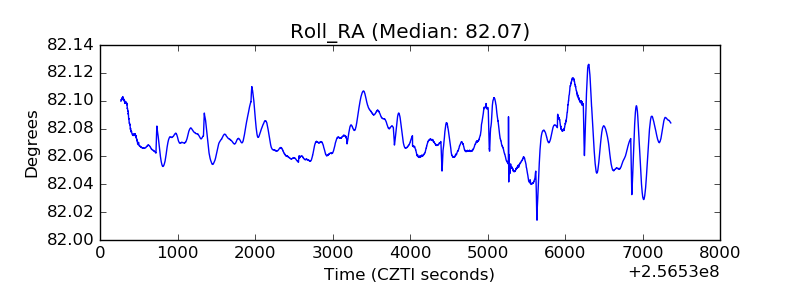 |
| Veto Counter | 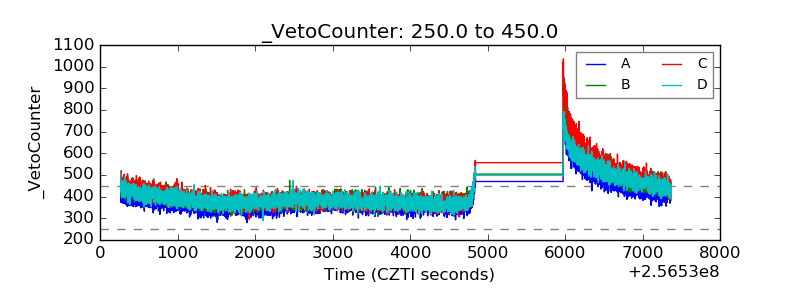 |