| Param | Original file | Final file |
|---|---|---|
| Filename | modeM0/AS1A04_116T01_9000001896_12923cztM0_level2.evt | modeM0/AS1A04_116T01_9000001896_12923cztM0_level2_quad_clean.evt |
| Size (bytes) | 493,398,720 | 96,523,200 |
| Size | 470.5 MB | 92.1 MB |
| Events in quadrant A | 3,417,104 | 631,455 |
| Events in quadrant B | 4,024,951 | 612,160 |
| Events in quadrant C | 3,082,703 | 639,115 |
| Events in quadrant D | 3,991,353 | 601,702 |
| Mode M9 | |||
|---|---|---|---|
| Quadrant | BADHDUFLAG | Total packets | Discarded packets |
| A | 0 | 12 | 0 |
| B | 0 | 12 | 0 |
| C | 0 | 12 | 0 |
| D | 0 | 12 | 0 |
| Mode SS | |||
|---|---|---|---|
| Quadrant | BADHDUFLAG | Total packets | Discarded packets |
| A | 0 | 128 | 0 |
| B | 0 | 128 | 0 |
| C | 0 | 128 | 0 |
| D | 0 | 128 | 0 |
| Mode M0 | |||
|---|---|---|---|
| Quadrant | BADHDUFLAG | Total packets | Discarded packets |
| A | 0 | 14193 | 2 |
| B | 0 | 15994 | 1 |
| C | 0 | 13245 | 1 |
| D | 0 | 15881 | 1 |
| Quadrant | Total seconds | Saturated seconds | Saturation percentage |
|---|---|---|---|
| A | 6281 | 52 | 0.827894% |
| B | 6281 | 472 | 7.514727% |
| C | 6281 | 34 | 0.541315% |
| D | 6281 | 166 | 2.642891% |
Noise dominated data is calculated using 1-second bins in cleaned event files. If a bin has >2000 counts, and if more than 50% of those come from <1% of pixels, then it is considered to be noise-dominated and hence unusable.
| Quadrant | # 1 sec bins | Bins with >0 counts | Bins with >2000 counts | High rate bins dominated by noise | Noise dominated (total time) | Noise dominated (detector-on time) | Marked lightcurve |
|---|---|---|---|---|---|---|---|
| A | 7502 | 6284 | 1 | 1 | 0.01% | 0.02% | 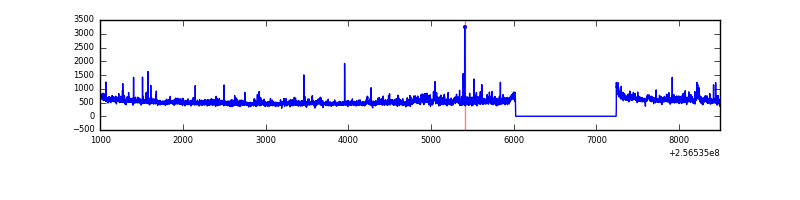 |
| B | 7502 | 6283 | 195 | 195 | 2.60% | 3.10% | 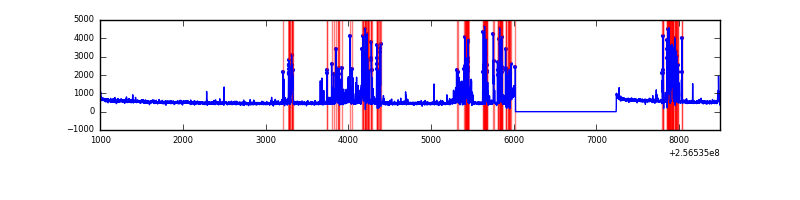 |
| C | 7502 | 6284 | 0 | 0 | 0.00% | 0.00% | 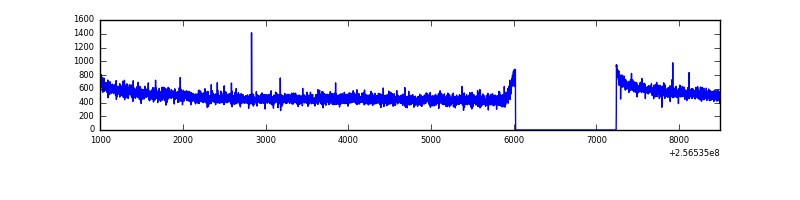 |
| D | 7502 | 6284 | 112 | 112 | 1.49% | 1.78% | 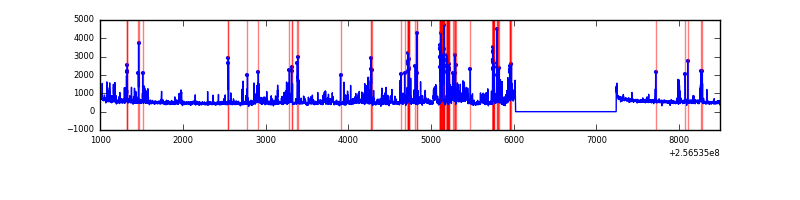 |
Top three noisy pixels from each quadrant. If the there are fewer than three noisy pixels in the level2.evt file, extra rows are filled as -1
| Pixel properties | Quadrant properties | ||||||
|---|---|---|---|---|---|---|---|
| Quadrant | DetID | PixID | Counts | Sigma | Mean | Median | Sigma |
| A | 1 | 162 | 93800 | 588.5 | 793 | 778 | 158.1 |
| A | 15 | 239 | 61523 | 384.3 | 793 | 778 | 158.1 |
| A | 12 | 189 | 46904 | 291.81 | 793 | 778 | 158.1 |
| B | 4 | 239 | 826102 | 5906.75 | 760 | 742 | 139.7 |
| B | 3 | 64 | 150204 | 1069.64 | 760 | 742 | 139.7 |
| B | 0 | 197 | 36840 | 258.34 | 760 | 742 | 139.7 |
| C | 4 | 112 | 28671 | 157.68 | 781 | 788 | 176.8 |
| C | 13 | 61 | 5871 | 28.74 | 781 | 788 | 176.8 |
| C | 8 | 222 | 4586 | 21.48 | 781 | 788 | 176.8 |
| D | 1 | 52 | 775677 | 4256.97 | 767 | 746 | 182.0 |
| D | 8 | 195 | 254358 | 1393.18 | 767 | 746 | 182.0 |
| D | 2 | 234 | 26170 | 139.66 | 767 | 746 | 182.0 |
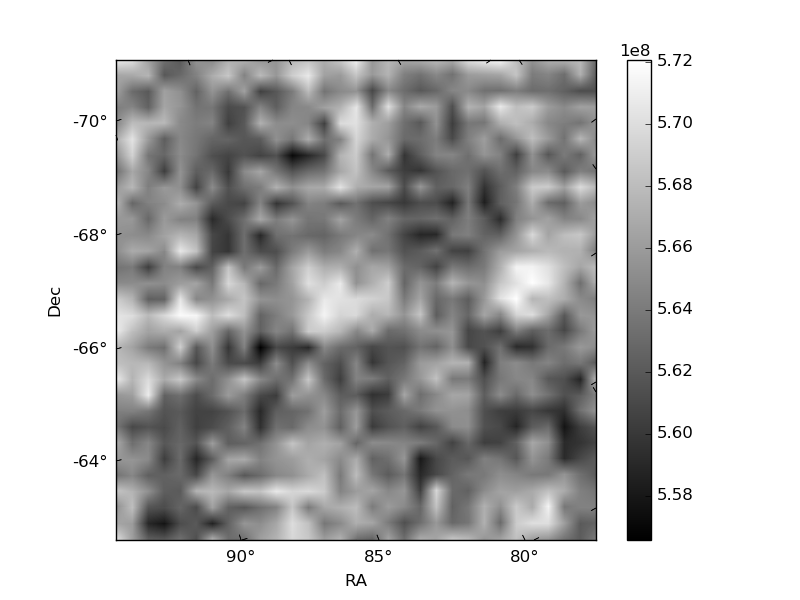
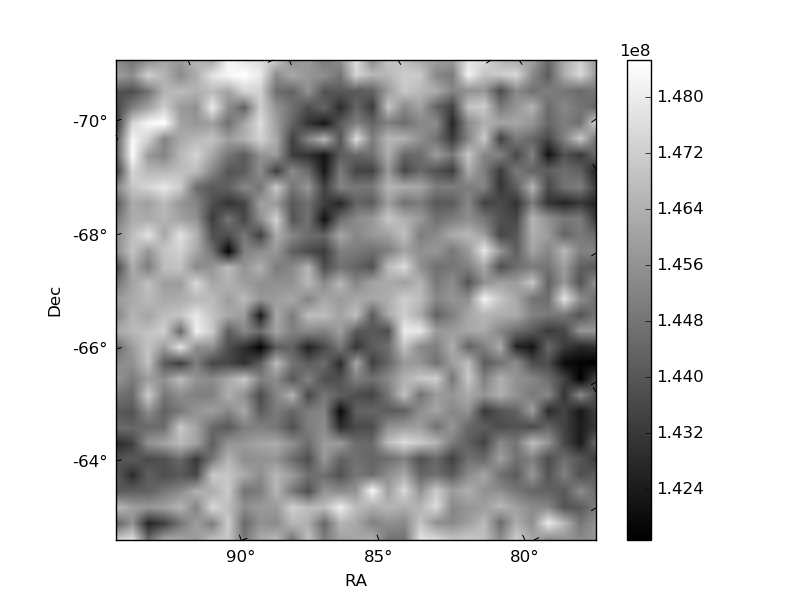
Histogram calculated using DETX and DETY for each event in the final _common_clean file
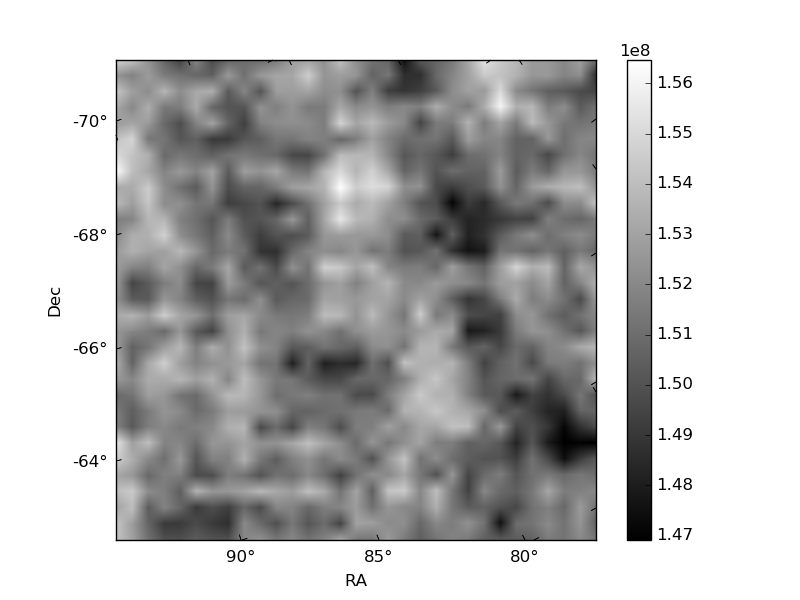
| Quadrant A | 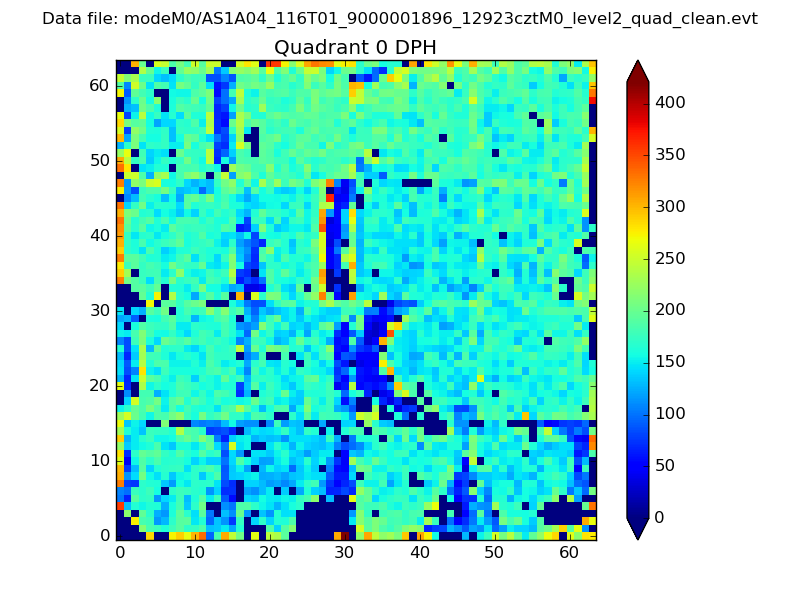 |
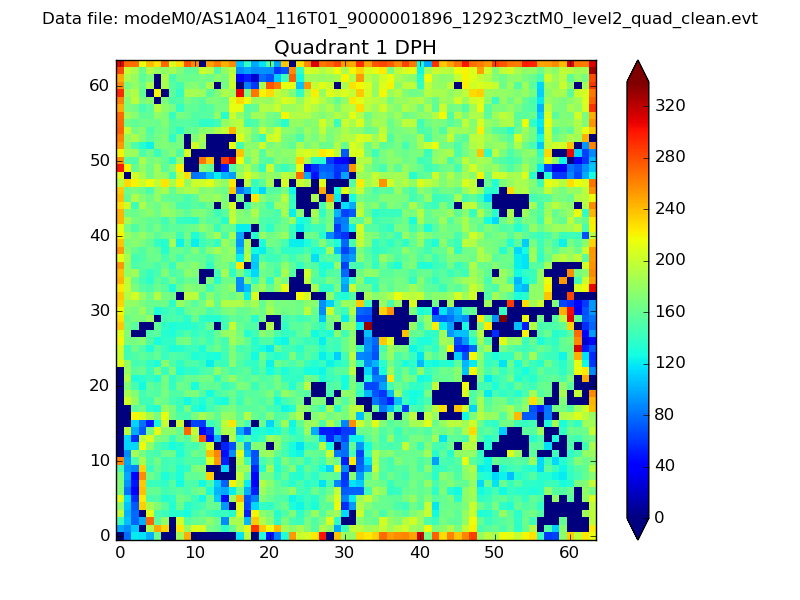 |
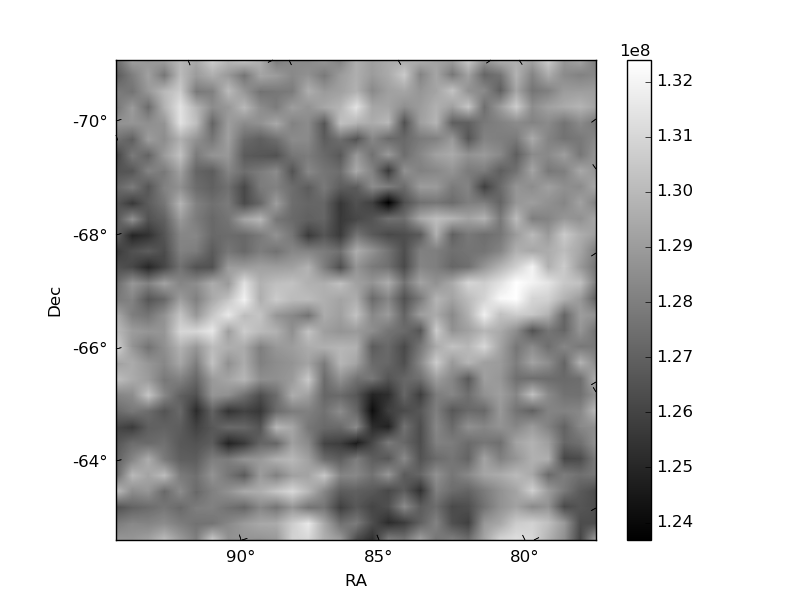
Quadrant B |
|---|---|---|---|
| Quadrant D |  |
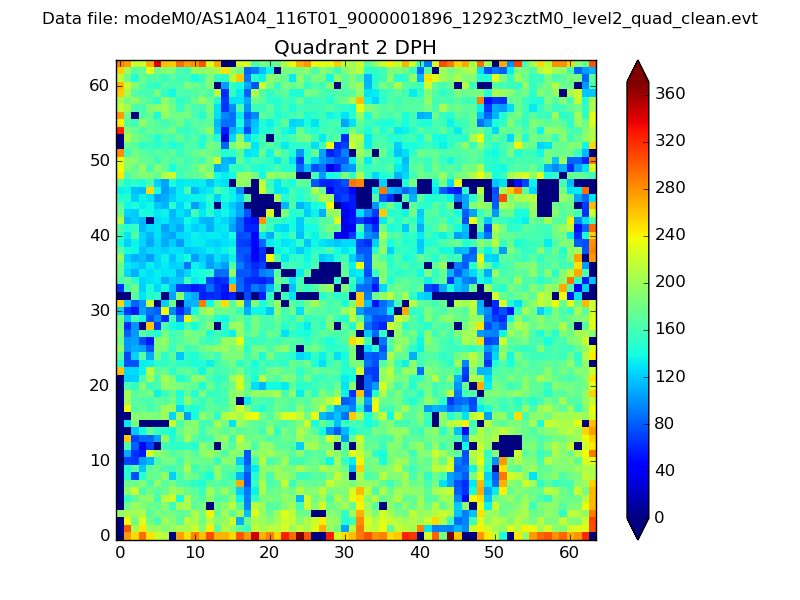 |
Quadrant C |
| Plot type | Count rate plots | Images |
|---|---|---|
| Comparison with Poisson distribution Blue bars denote a histogram of data divided into 1 sec bins. Red curve is a Poisson curve with rate = median count rate of data. |
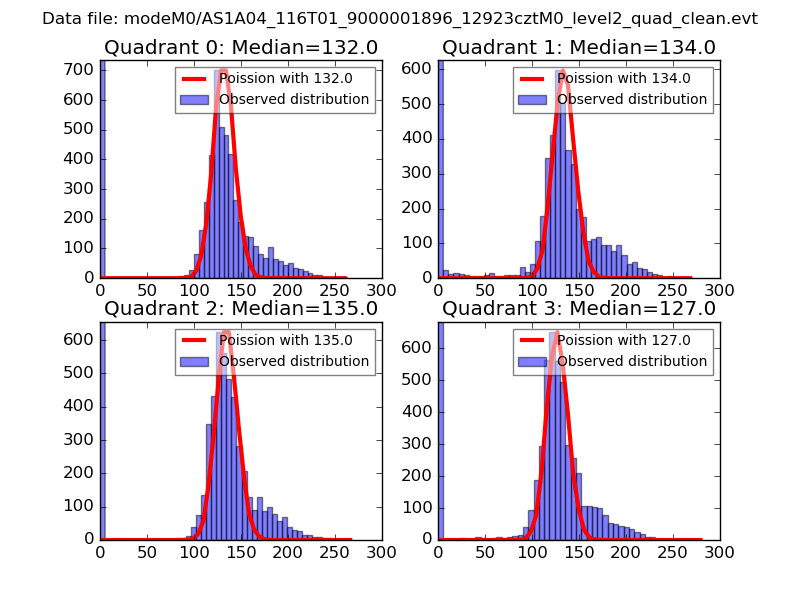 |
 |
| Quadrant-wise count rates Data is divided into 100 sec bins |
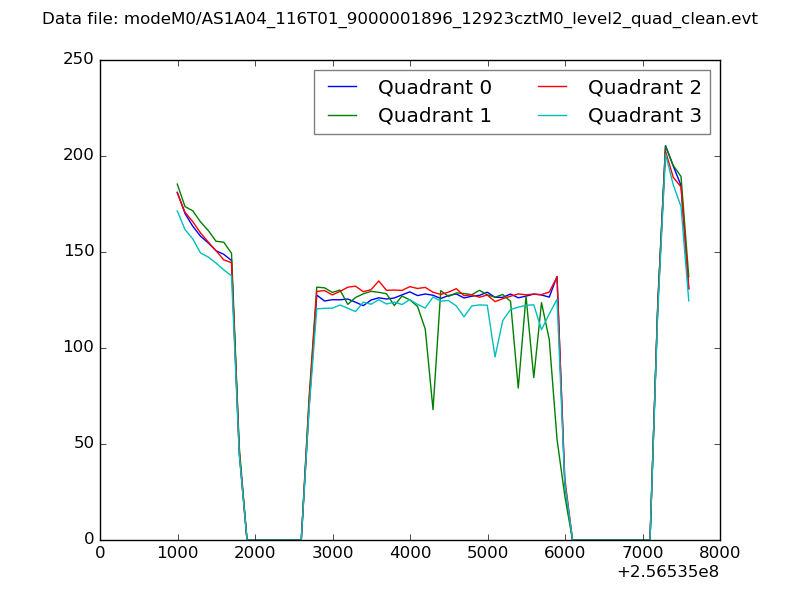 |
|
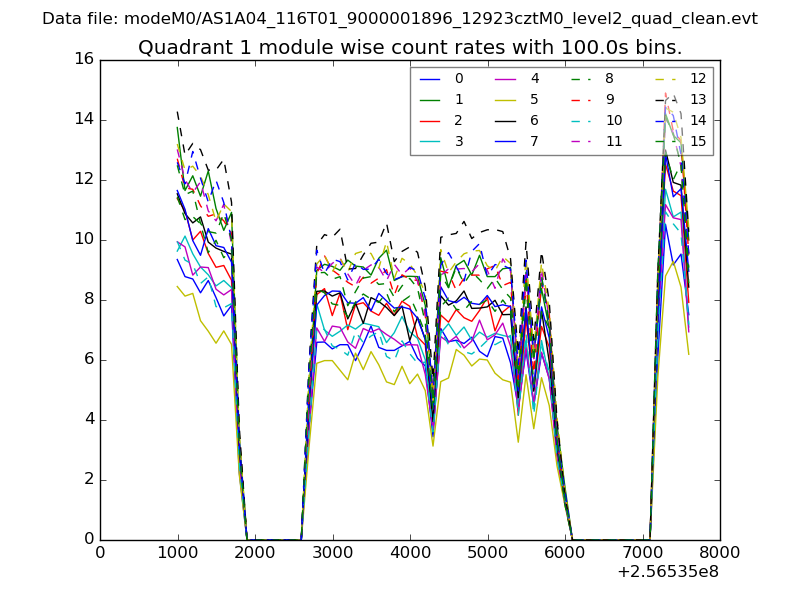
| Module-wise count rates for Quadrant A Data is divided into 100 sec bins |
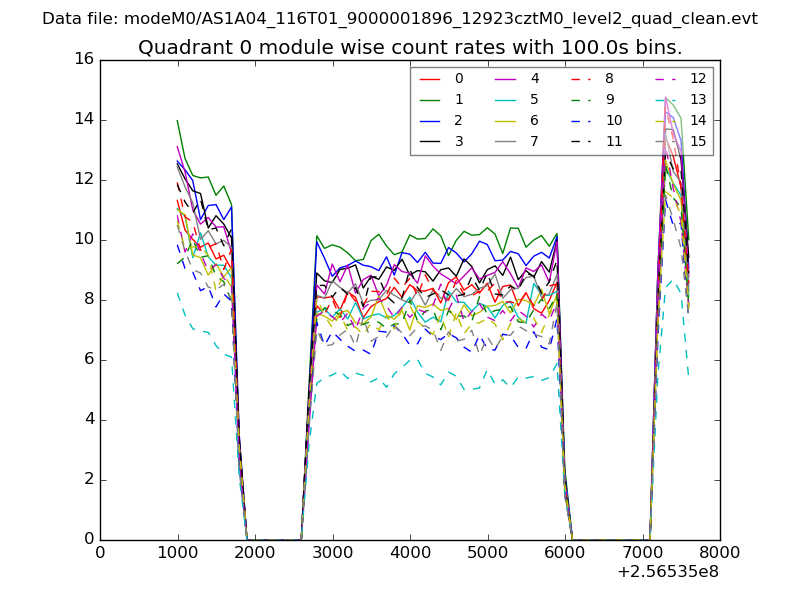 |
 |
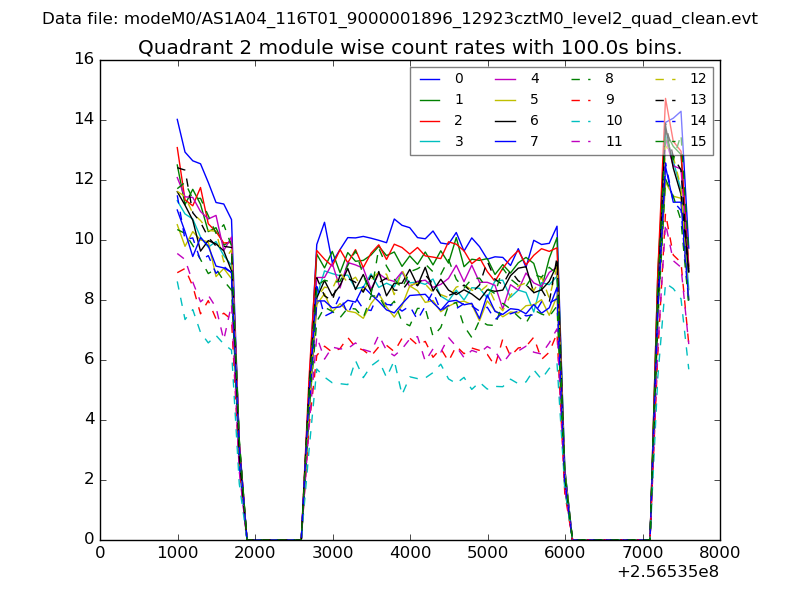
| Module-wise count rates for Quadrant B Data is divided into 100 sec bins |
 |
 |
| Module-wise count rates for Quadrant C Data is divided into 100 sec bins |
 |
 |
| Module-wise count rates for Quadrant D Data is divided into 100 sec bins |
 |
 |
| Parameter | Plot |
|---|---|
| CZT HV Monitor | 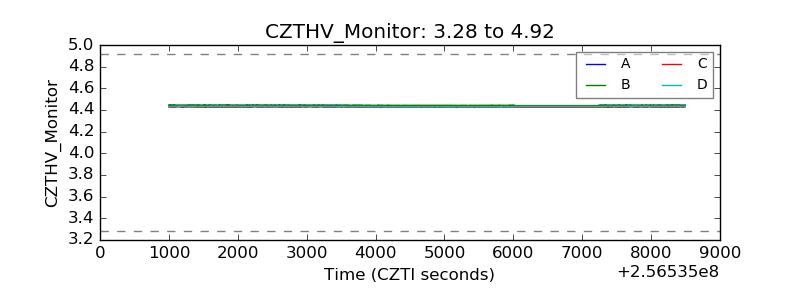 |
| D_VDD | 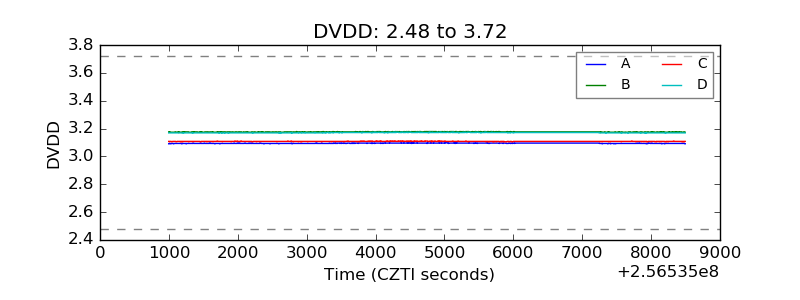 |
| Temperature 1 | 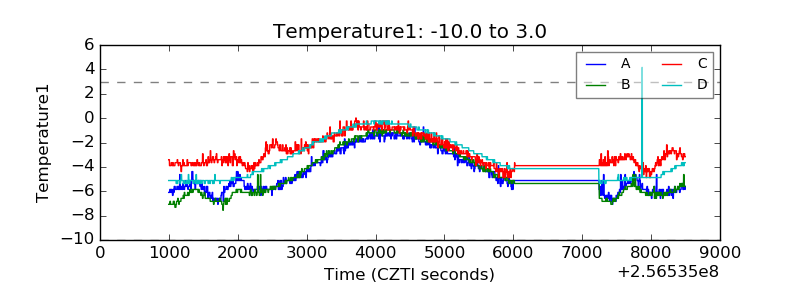 |
| Veto HV Monitor | 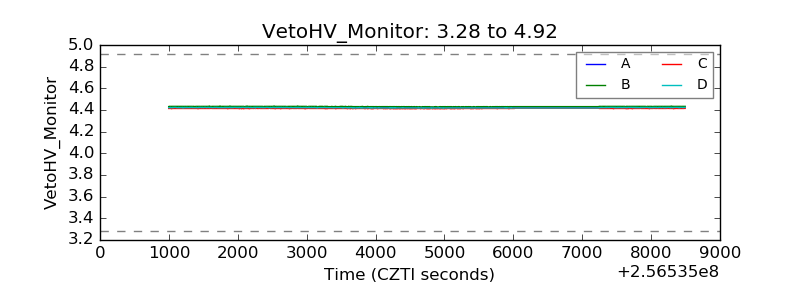 |
| Veto LLD | 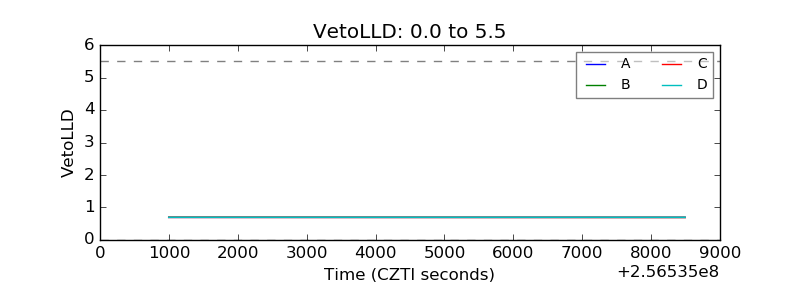 |
| Alpha Counter | 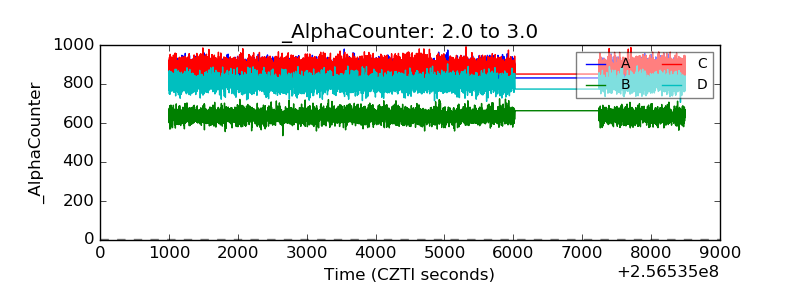 |
| _CPM_Rate | 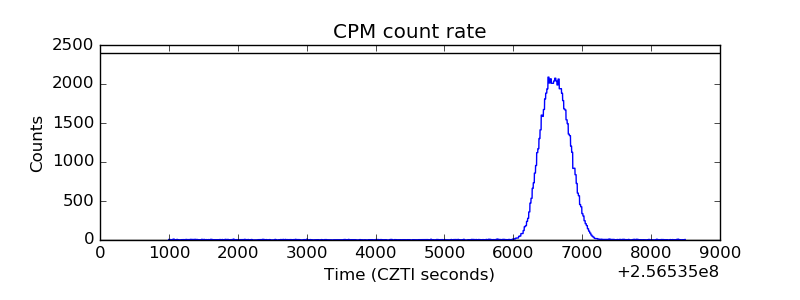 |
| CZT Counter | 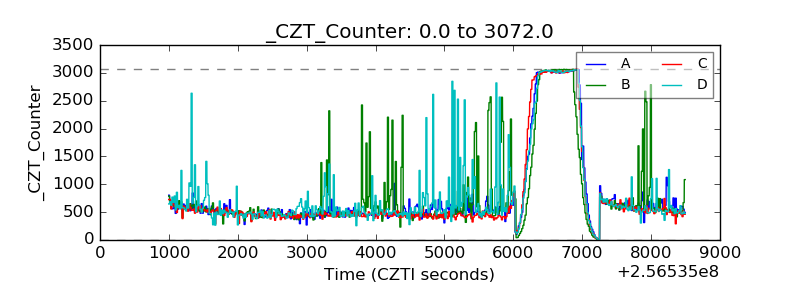 |
| +2.5 Volts monitor |  |
| +5 Volts monitor | 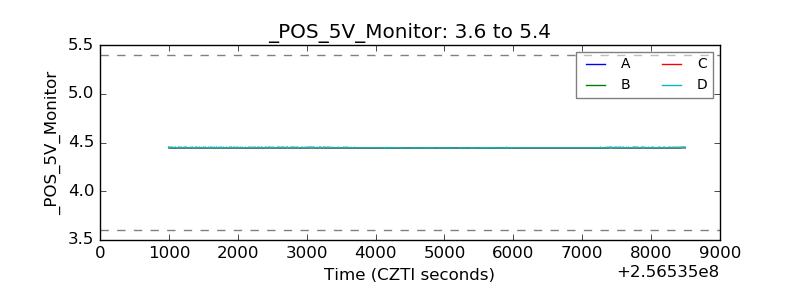 |
| _ROLL_ROT | 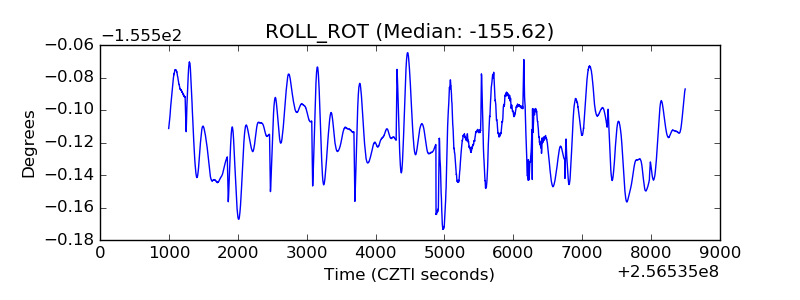 |
| _Roll_DEC | 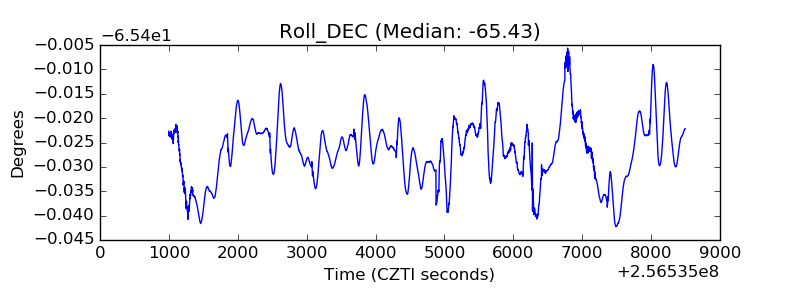 |
| _Roll_RA | 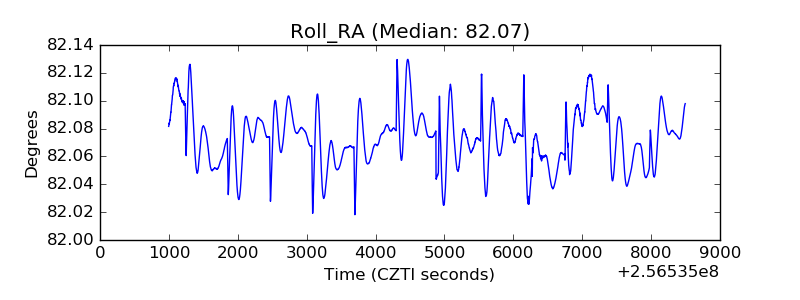 |
| Veto Counter | 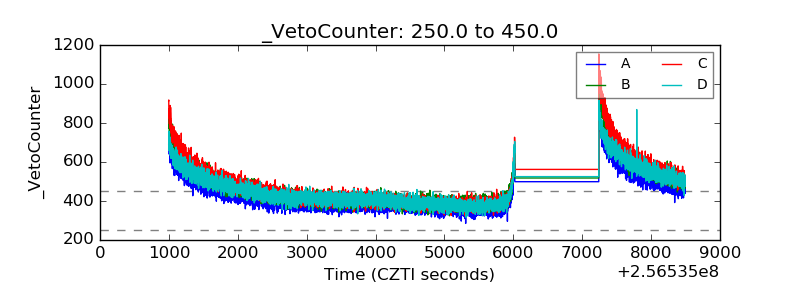 |