| Param | Original file | Final file |
|---|---|---|
| Filename | modeM0/AS1A04_116T01_9000001896_12924cztM0_level2.evt | modeM0/AS1A04_116T01_9000001896_12924cztM0_level2_quad_clean.evt |
| Size (bytes) | 479,931,840 | 82,347,840 |
| Size | 457.7 MB | 78.5 MB |
| Events in quadrant A | 3,371,760 | 537,632 |
| Events in quadrant B | 4,363,436 | 485,691 |
| Events in quadrant C | 2,865,012 | 548,872 |
| Events in quadrant D | 3,545,177 | 520,161 |
| Mode M9 | |||
|---|---|---|---|
| Quadrant | BADHDUFLAG | Total packets | Discarded packets |
| A | 0 | 12 | 0 |
| B | 0 | 12 | 0 |
| C | 0 | 12 | 0 |
| D | 0 | 12 | 0 |
| Mode SS | |||
|---|---|---|---|
| Quadrant | BADHDUFLAG | Total packets | Discarded packets |
| A | 0 | 118 | 0 |
| B | 0 | 118 | 0 |
| C | 0 | 118 | 0 |
| D | 0 | 118 | 0 |
| Mode M0 | |||
|---|---|---|---|
| Quadrant | BADHDUFLAG | Total packets | Discarded packets |
| A | 0 | 13812 | 2 |
| B | 0 | 16667 | 1 |
| C | 0 | 12209 | 1 |
| D | 0 | 14107 | 1 |
| Quadrant | Total seconds | Saturated seconds | Saturation percentage |
|---|---|---|---|
| A | 5729 | 125 | 2.181882% |
| B | 5729 | 804 | 14.033863% |
| C | 5729 | 89 | 1.553500% |
| D | 5729 | 106 | 1.850236% |
Noise dominated data is calculated using 1-second bins in cleaned event files. If a bin has >2000 counts, and if more than 50% of those come from <1% of pixels, then it is considered to be noise-dominated and hence unusable.
| Quadrant | # 1 sec bins | Bins with >0 counts | Bins with >2000 counts | High rate bins dominated by noise | Noise dominated (total time) | Noise dominated (detector-on time) | Marked lightcurve |
|---|---|---|---|---|---|---|---|
| A | 6995 | 5731 | 15 | 15 | 0.21% | 0.26% | 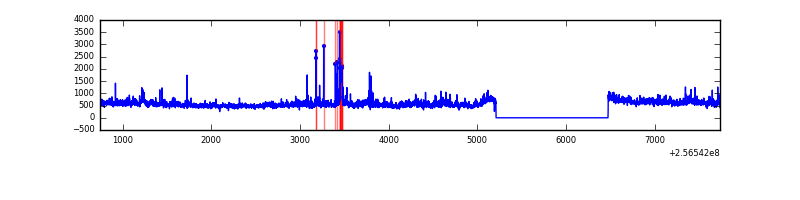 |
| B | 6995 | 5731 | 369 | 369 | 5.28% | 6.44% | 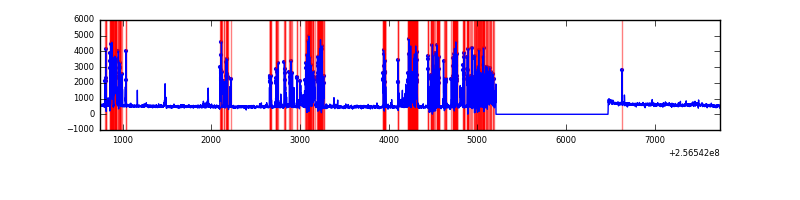 |
| C | 6995 | 5731 | 0 | 0 | 0.00% | 0.00% | 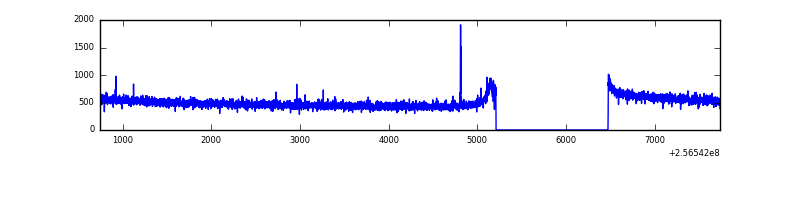 |
| D | 6995 | 5731 | 49 | 49 | 0.70% | 0.85% | 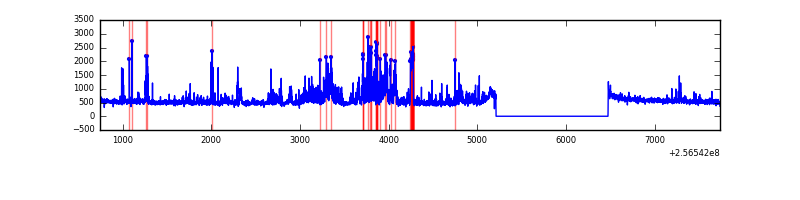 |
Top three noisy pixels from each quadrant. If the there are fewer than three noisy pixels in the level2.evt file, extra rows are filled as -1
| Pixel properties | Quadrant properties | ||||||
|---|---|---|---|---|---|---|---|
| Quadrant | DetID | PixID | Counts | Sigma | Mean | Median | Sigma |
| A | 1 | 162 | 125090 | 844.97 | 745 | 732 | 147.2 |
| A | 15 | 174 | 85507 | 576.02 | 745 | 732 | 147.2 |
| A | 12 | 189 | 71236 | 479.05 | 745 | 732 | 147.2 |
| B | 4 | 239 | 1457827 | 11664.32 | 681 | 666 | 124.9 |
| B | 3 | 64 | 163167 | 1300.79 | 681 | 666 | 124.9 |
| B | 0 | 187 | 36767 | 288.98 | 681 | 666 | 124.9 |
| C | 4 | 112 | 11118 | 63.21 | 729 | 733 | 164.3 |
| C | 14 | 234 | 8581 | 47.77 | 729 | 733 | 164.3 |
| C | 13 | 61 | 5605 | 29.65 | 729 | 733 | 164.3 |
| D | 8 | 195 | 464771 | 2712.87 | 726 | 706 | 171.1 |
| D | 1 | 52 | 287833 | 1678.51 | 726 | 706 | 171.1 |
| D | 2 | 234 | 23864 | 135.38 | 726 | 706 | 171.1 |
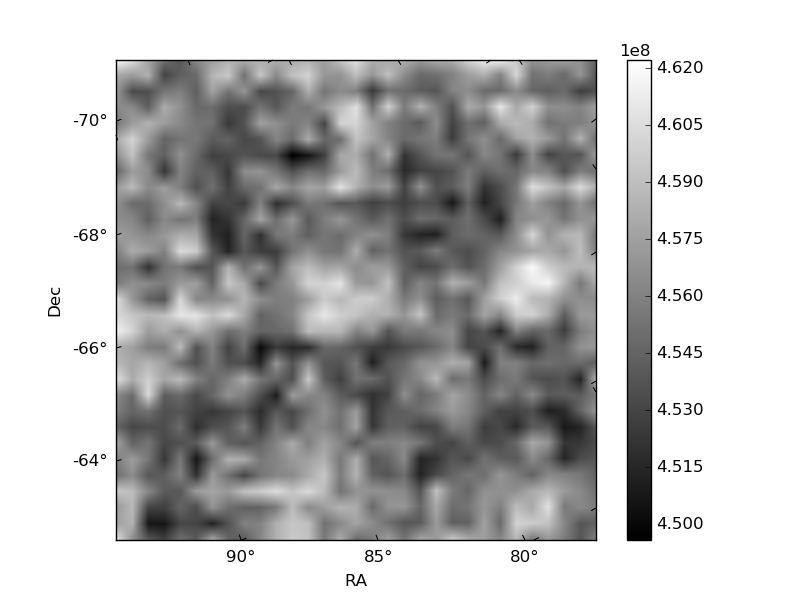
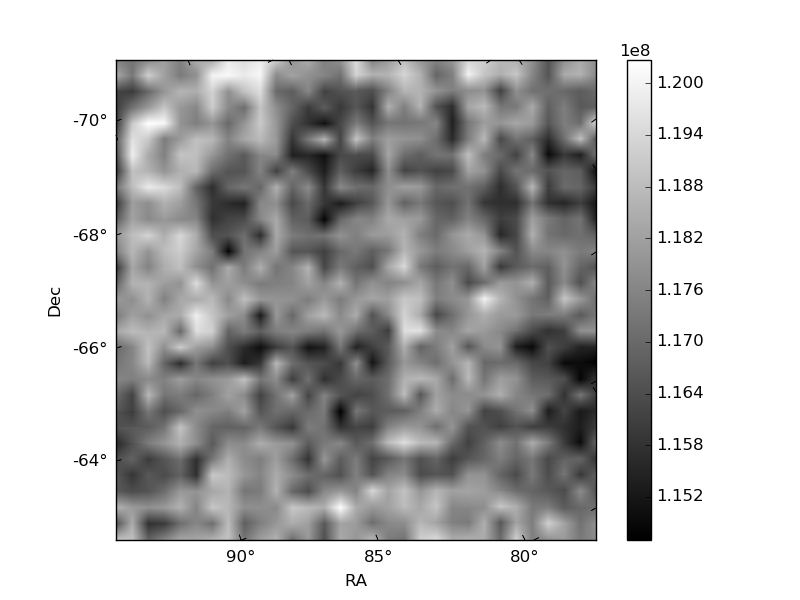
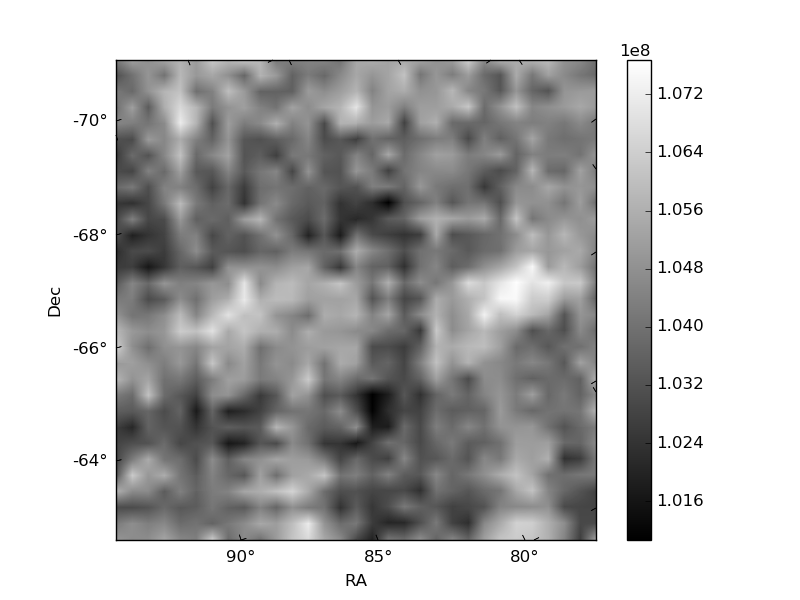
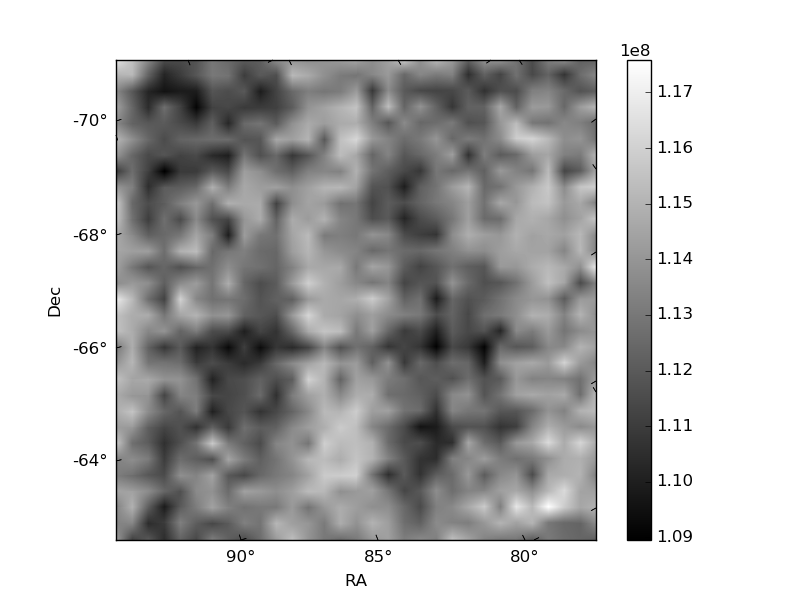
Histogram calculated using DETX and DETY for each event in the final _common_clean file
| Quadrant A | 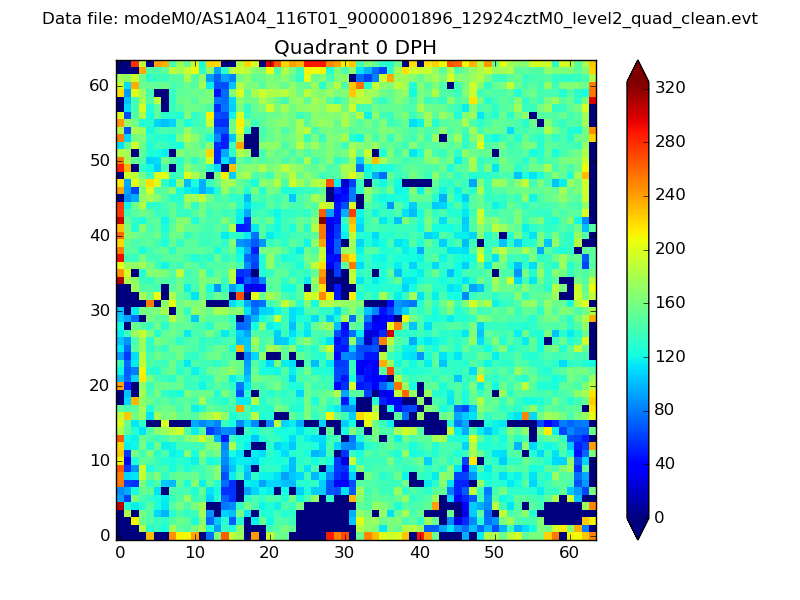 |
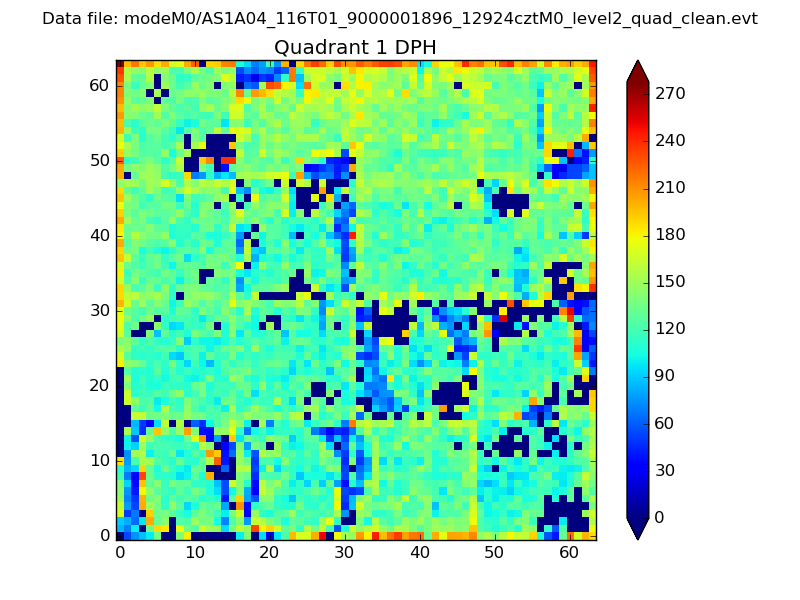 |
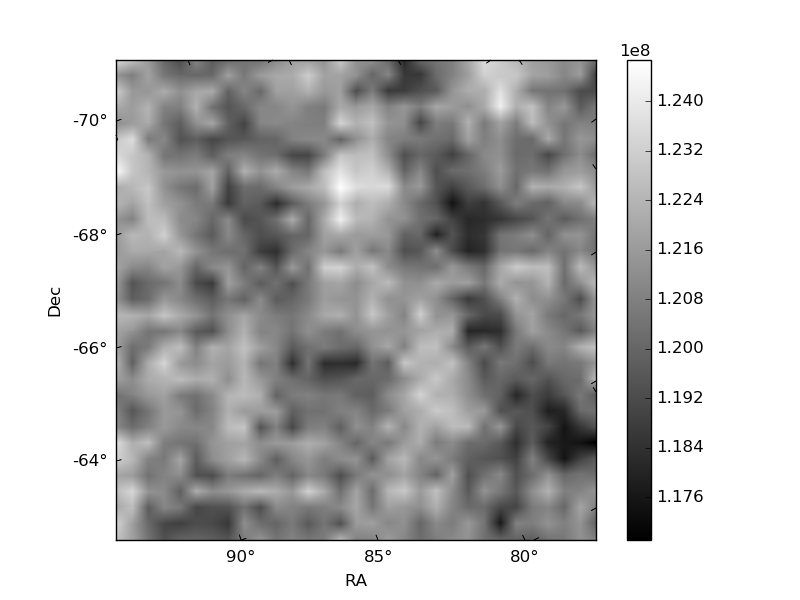
Quadrant B |
|---|---|---|---|
| Quadrant D | 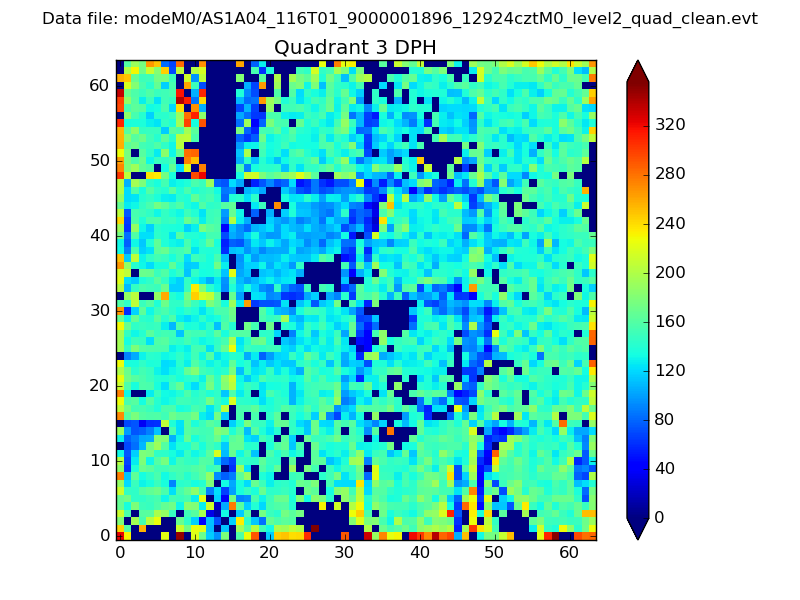 |
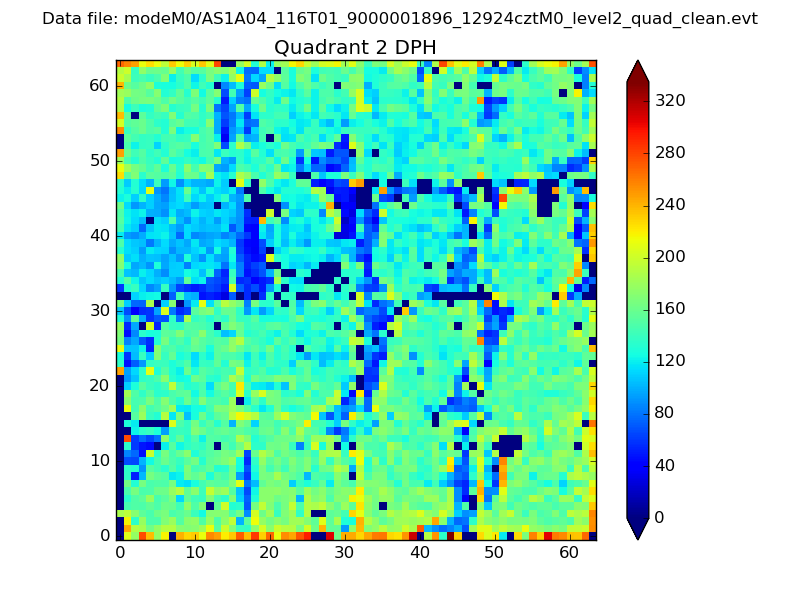 |
Quadrant C |
| Plot type | Count rate plots | Images |
|---|---|---|
| Comparison with Poisson distribution Blue bars denote a histogram of data divided into 1 sec bins. Red curve is a Poisson curve with rate = median count rate of data. |
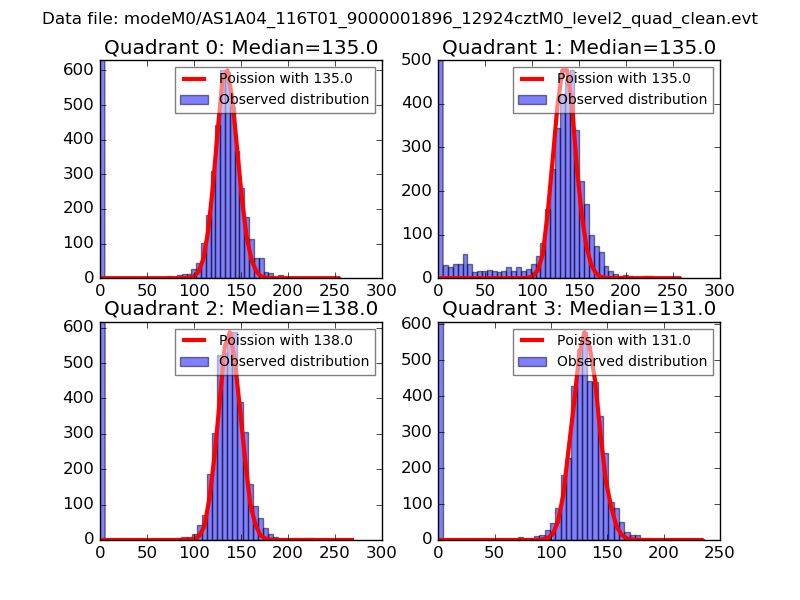 |
 |
| Quadrant-wise count rates Data is divided into 100 sec bins |
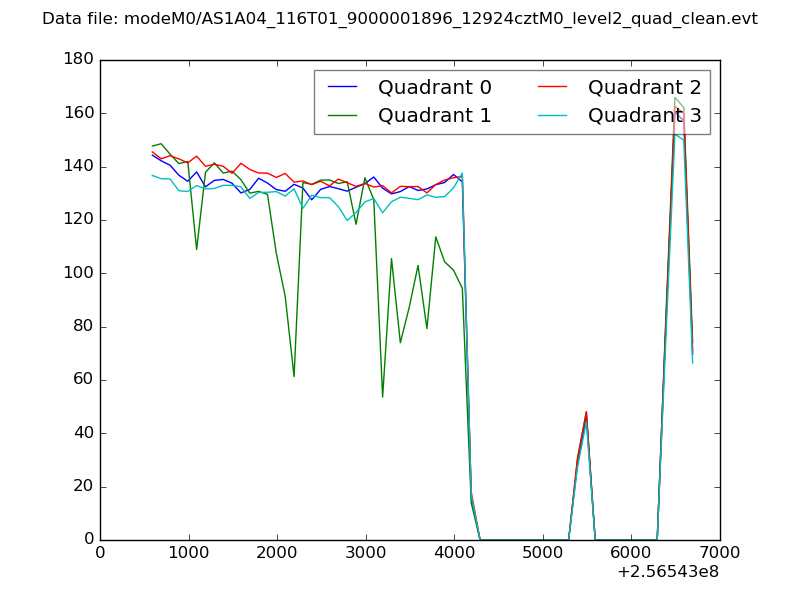 |
|
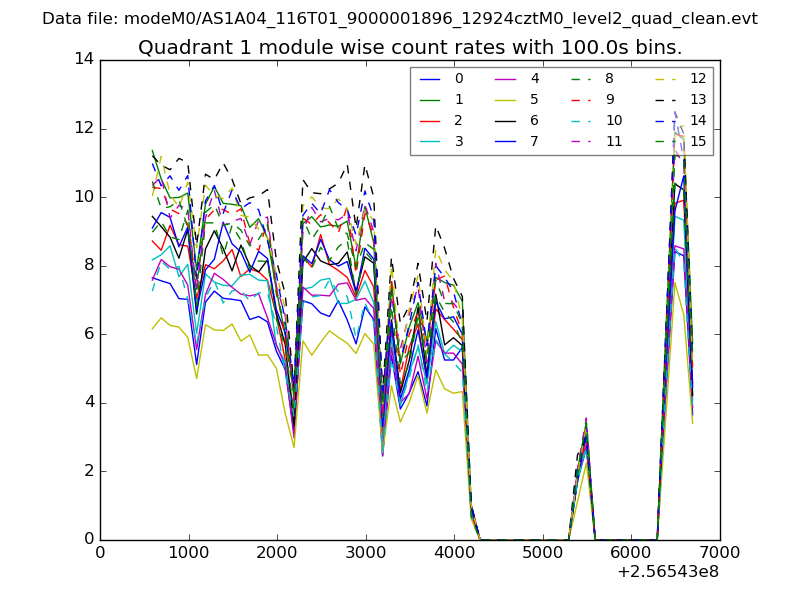
| Module-wise count rates for Quadrant A Data is divided into 100 sec bins |
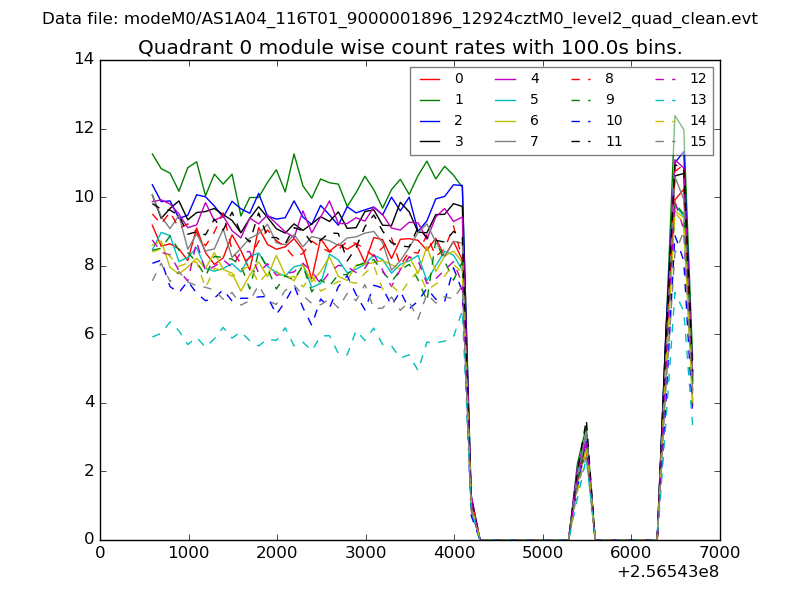 |
 |
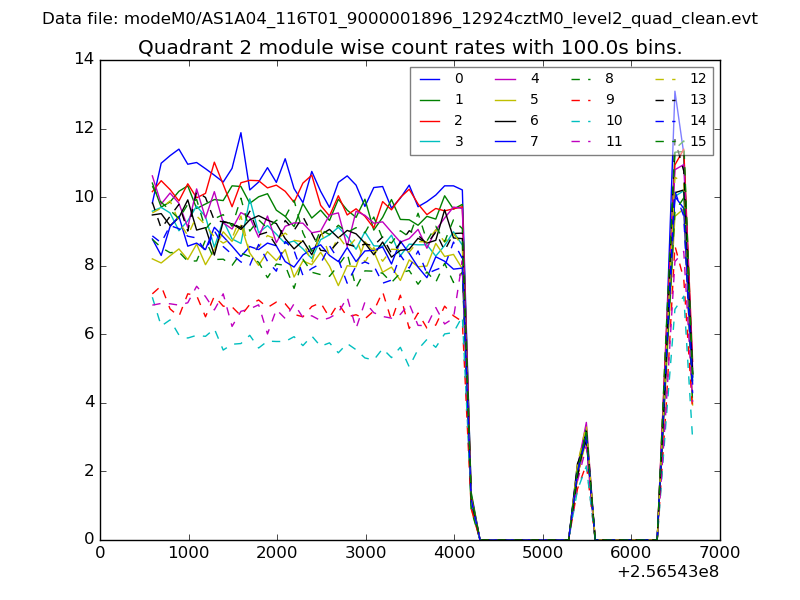
| Module-wise count rates for Quadrant B Data is divided into 100 sec bins |
 |
 |
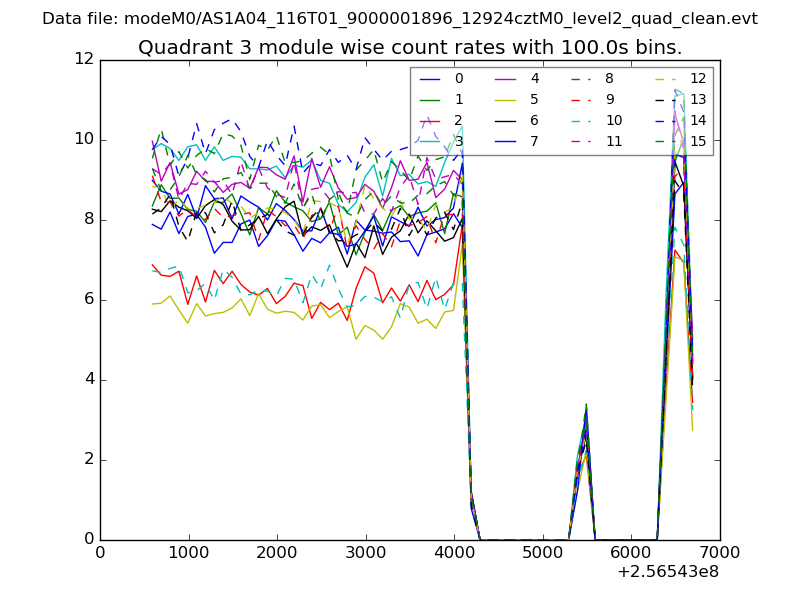
| Module-wise count rates for Quadrant C Data is divided into 100 sec bins |
 |
 |
| Module-wise count rates for Quadrant D Data is divided into 100 sec bins |
 |
 |
| Parameter | Plot |
|---|---|
| CZT HV Monitor | 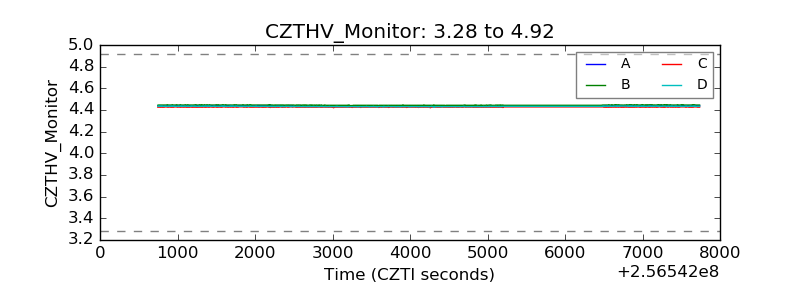 |
| D_VDD | 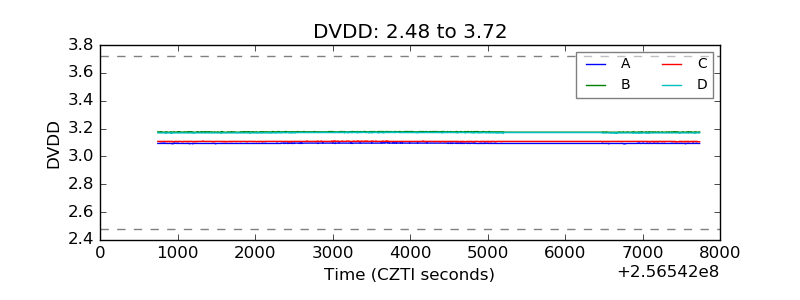 |
| Temperature 1 | 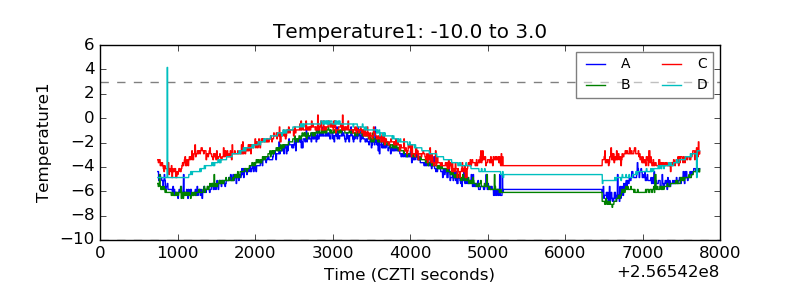 |
| Veto HV Monitor | 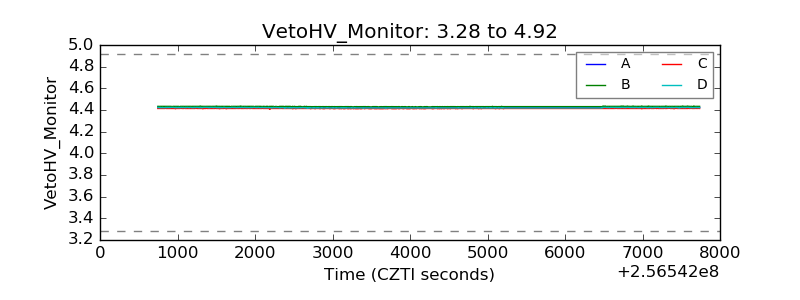 |
| Veto LLD | 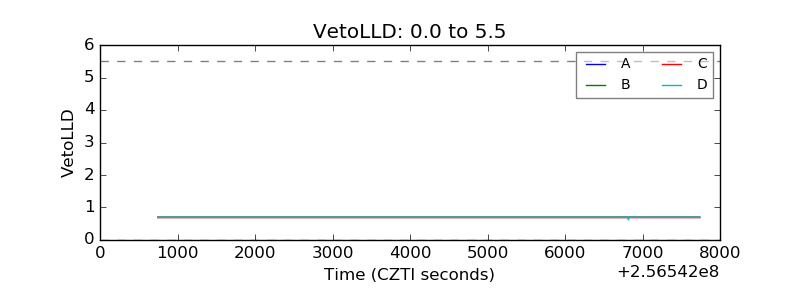 |
| Alpha Counter | 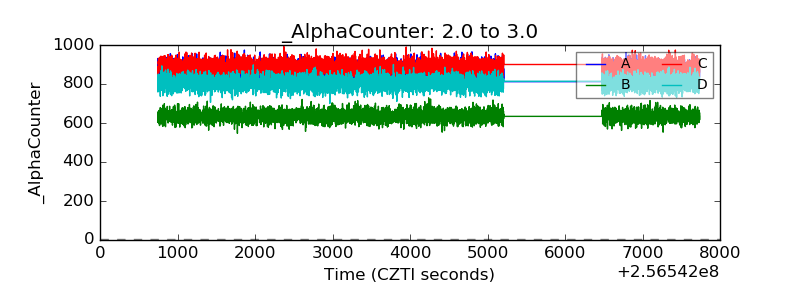 |
| _CPM_Rate | 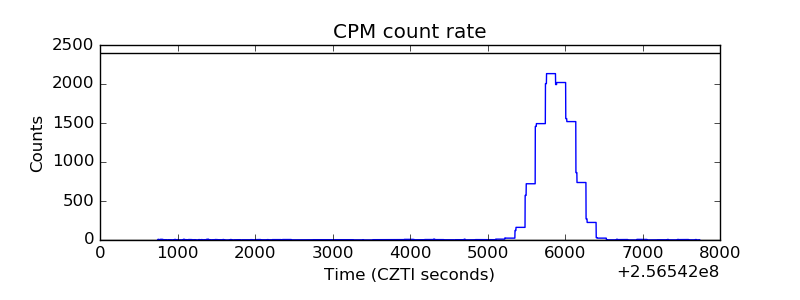 |
| CZT Counter | 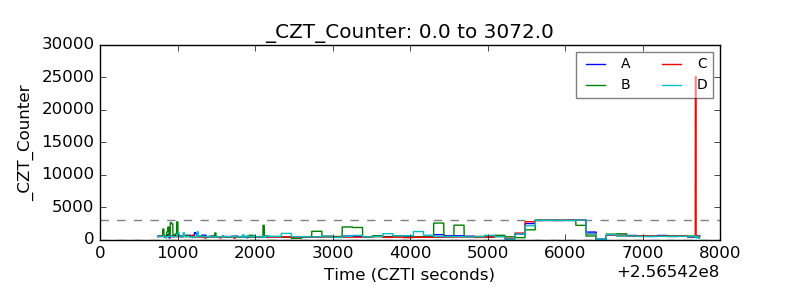 |
| +2.5 Volts monitor |  |
| +5 Volts monitor | 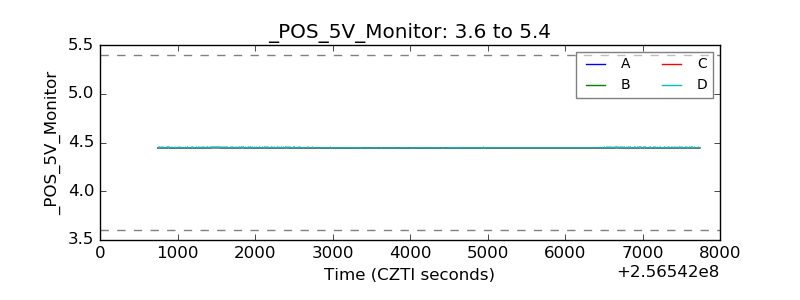 |
| _ROLL_ROT | 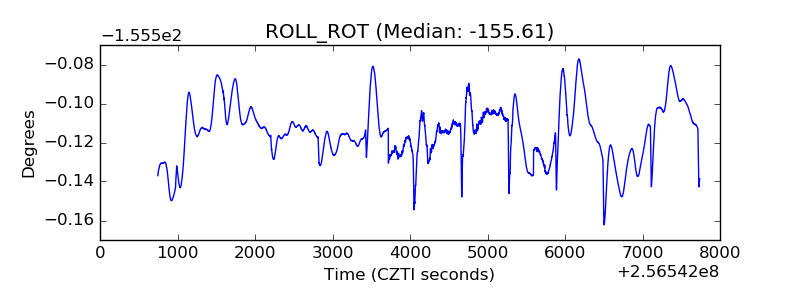 |
| _Roll_DEC | 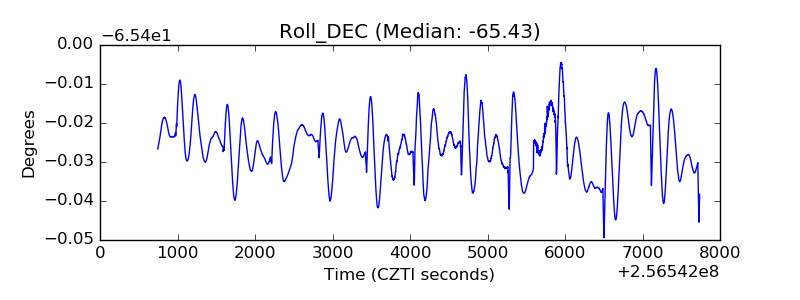 |
| _Roll_RA | 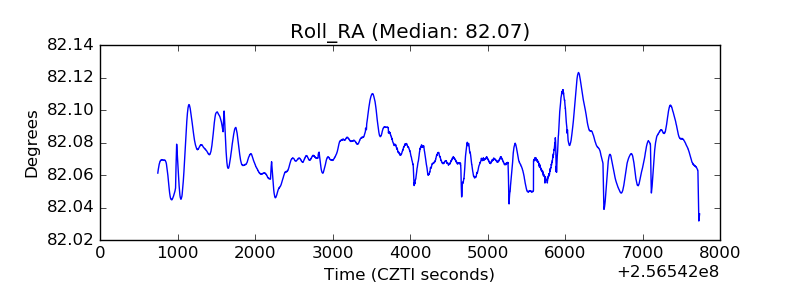 |
| Veto Counter | 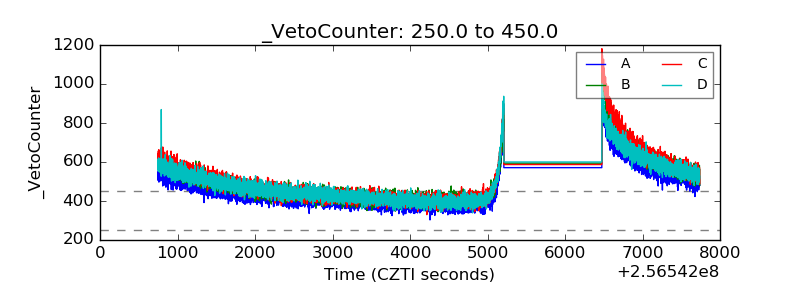 |