| Param | Original file | Final file |
|---|---|---|
| Filename | modeM0/AS1A04_116T01_9000001896_12925cztM0_level2.evt | modeM0/AS1A04_116T01_9000001896_12925cztM0_level2_quad_clean.evt |
| Size (bytes) | 532,848,960 | 99,040,320 |
| Size | 508.2 MB | 94.5 MB |
| Events in quadrant A | 3,883,731 | 664,826 |
| Events in quadrant B | 4,885,911 | 599,182 |
| Events in quadrant C | 3,163,097 | 676,023 |
| Events in quadrant D | 3,787,458 | 629,764 |
| Mode M9 | |||
|---|---|---|---|
| Quadrant | BADHDUFLAG | Total packets | Discarded packets |
| A | 0 | 13 | 0 |
| B | 0 | 13 | 0 |
| C | 0 | 13 | 0 |
| D | 0 | 13 | 0 |
| Mode SS | |||
|---|---|---|---|
| Quadrant | BADHDUFLAG | Total packets | Discarded packets |
| A | 0 | 124 | 0 |
| B | 0 | 124 | 0 |
| C | 0 | 124 | 0 |
| D | 0 | 124 | 0 |
| Mode M0 | |||
|---|---|---|---|
| Quadrant | BADHDUFLAG | Total packets | Discarded packets |
| A | 0 | 15923 | 2 |
| B | 0 | 18570 | 1 |
| C | 0 | 13409 | 1 |
| D | 0 | 15148 | 1 |
| Quadrant | Total seconds | Saturated seconds | Saturation percentage |
|---|---|---|---|
| A | 6150 | 163 | 2.650407% |
| B | 6150 | 991 | 16.113821% |
| C | 6150 | 105 | 1.707317% |
| D | 6150 | 305 | 4.959350% |
Noise dominated data is calculated using 1-second bins in cleaned event files. If a bin has >2000 counts, and if more than 50% of those come from <1% of pixels, then it is considered to be noise-dominated and hence unusable.
| Quadrant | # 1 sec bins | Bins with >0 counts | Bins with >2000 counts | High rate bins dominated by noise | Noise dominated (total time) | Noise dominated (detector-on time) | Marked lightcurve |
|---|---|---|---|---|---|---|---|
| A | 7451 | 6152 | 24 | 24 | 0.32% | 0.39% |  |
| B | 7451 | 6152 | 453 | 453 | 6.08% | 7.36% | 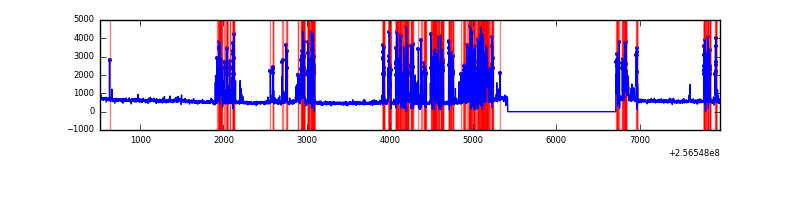 |
| C | 7451 | 6152 | 1 | 1 | 0.01% | 0.02% | 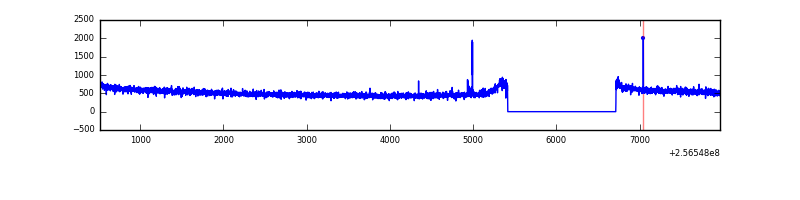 |
| D | 7451 | 6152 | 185 | 185 | 2.48% | 3.01% | 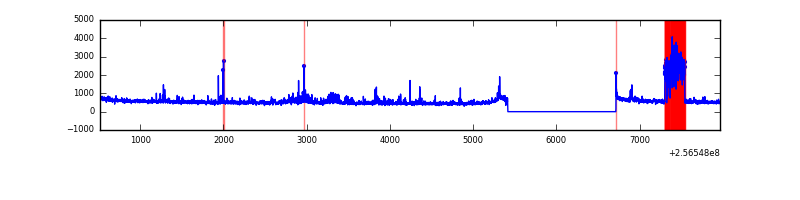 |
Top three noisy pixels from each quadrant. If the there are fewer than three noisy pixels in the level2.evt file, extra rows are filled as -1
| Pixel properties | Quadrant properties | ||||||
|---|---|---|---|---|---|---|---|
| Quadrant | DetID | PixID | Counts | Sigma | Mean | Median | Sigma |
| A | 1 | 162 | 181594 | 1117.65 | 826 | 810 | 161.8 |
| A | 12 | 189 | 117296 | 720.14 | 826 | 810 | 161.8 |
| A | 1 | 178 | 94097 | 576.72 | 826 | 810 | 161.8 |
| B | 4 | 239 | 1814009 | 13158.71 | 749 | 731 | 137.8 |
| B | 3 | 64 | 84498 | 607.89 | 749 | 731 | 137.8 |
| B | 0 | 187 | 33516 | 237.92 | 749 | 731 | 137.8 |
| C | 14 | 234 | 12470 | 64.76 | 804 | 810 | 180.1 |
| C | 4 | 112 | 11952 | 61.88 | 804 | 810 | 180.1 |
| C | 13 | 61 | 5992 | 28.78 | 804 | 810 | 180.1 |
| D | 13 | 122 | 486283 | 2612.16 | 792 | 772 | 185.9 |
| D | 8 | 195 | 170062 | 910.82 | 792 | 772 | 185.9 |
| D | 1 | 52 | 63823 | 339.23 | 792 | 772 | 185.9 |
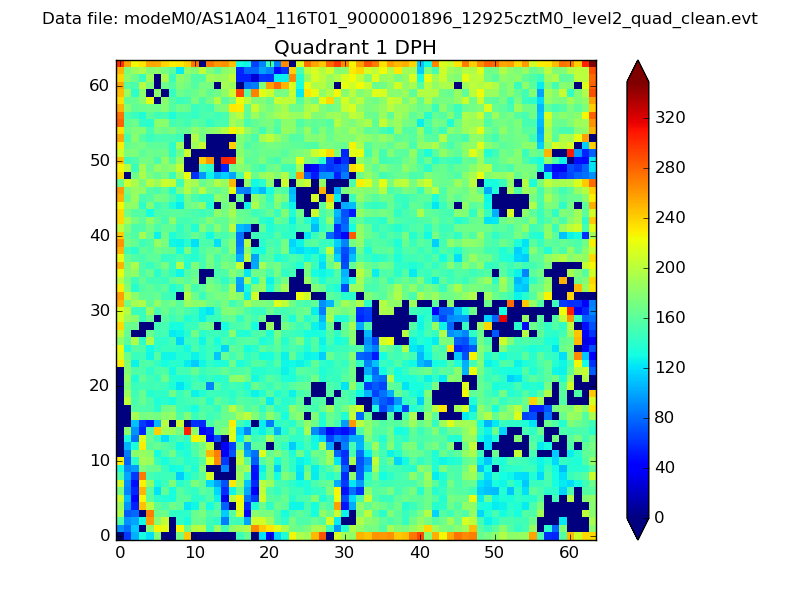
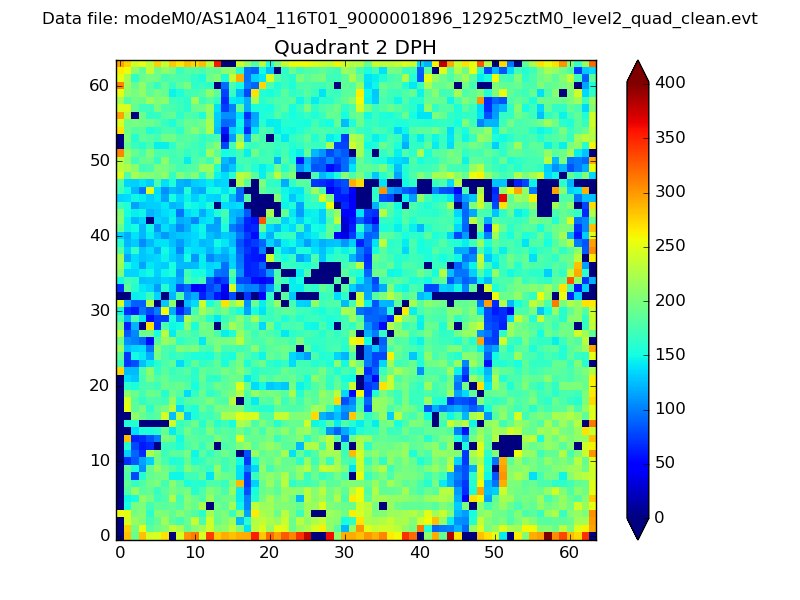
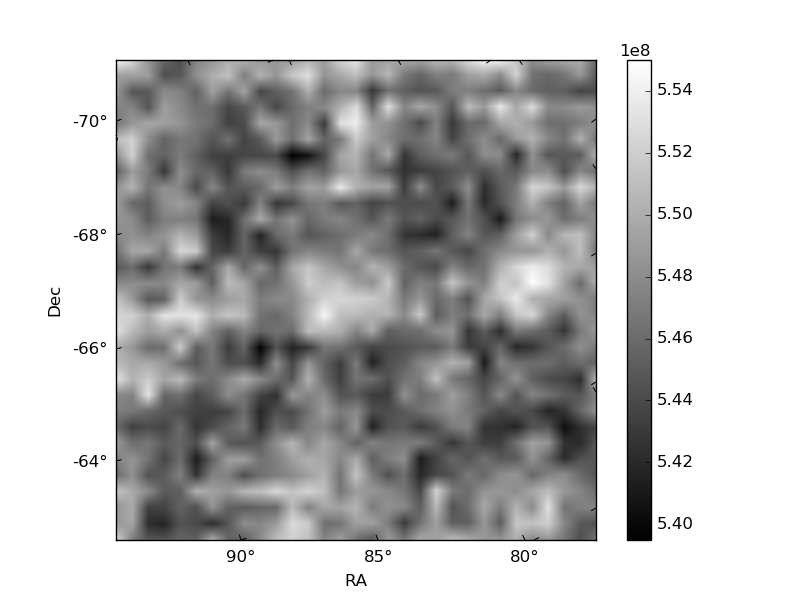
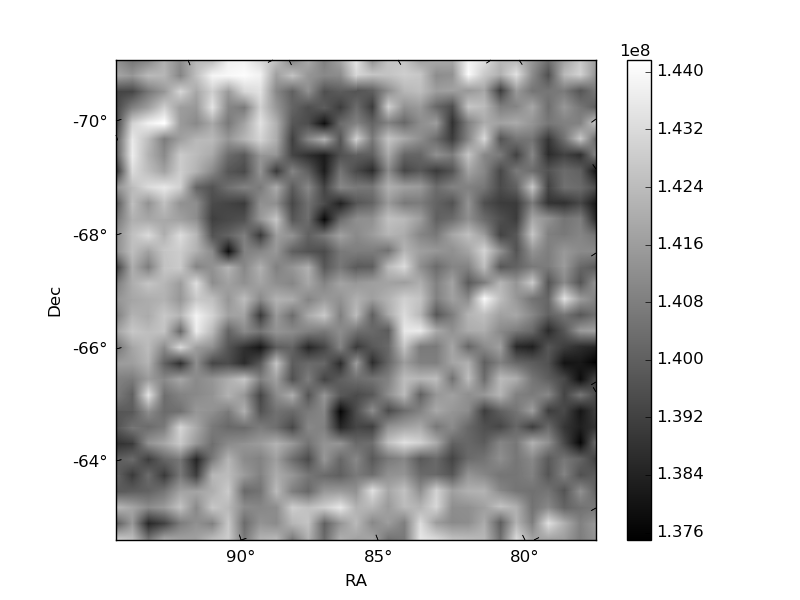
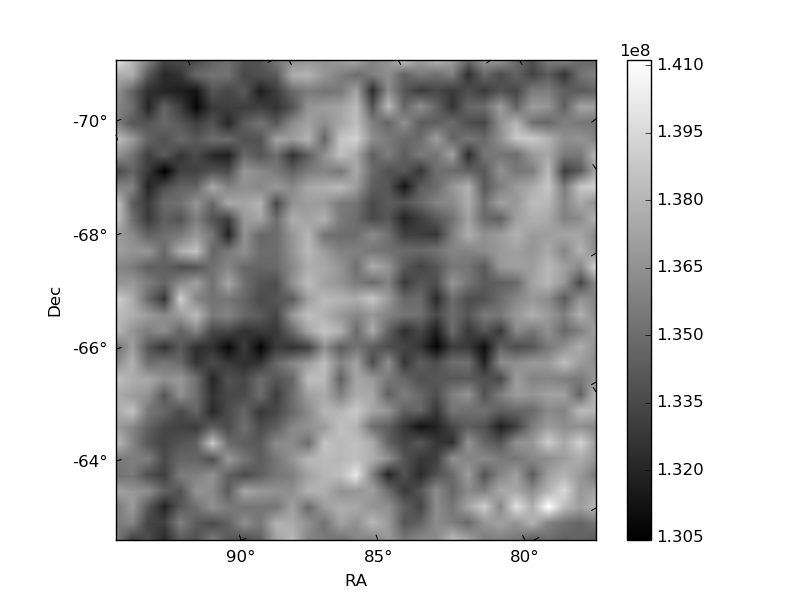
Histogram calculated using DETX and DETY for each event in the final _common_clean file
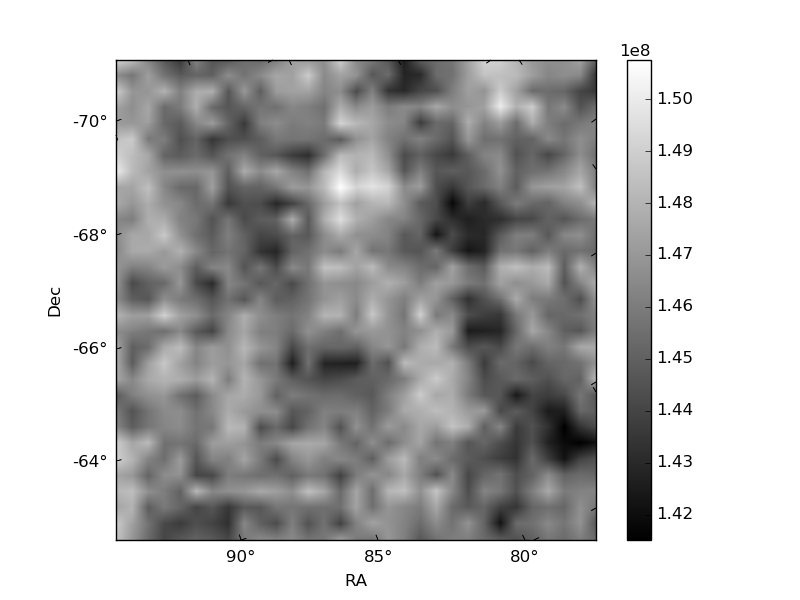
| Quadrant A | 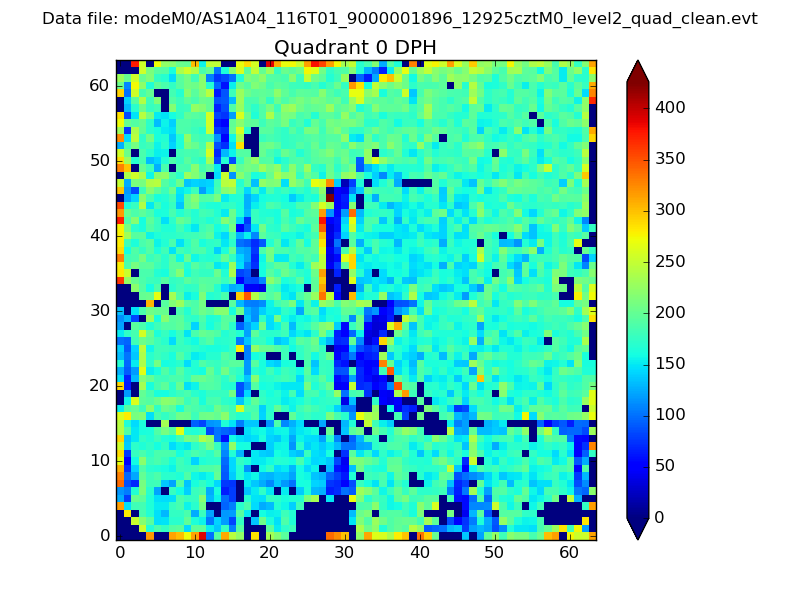 |
 |
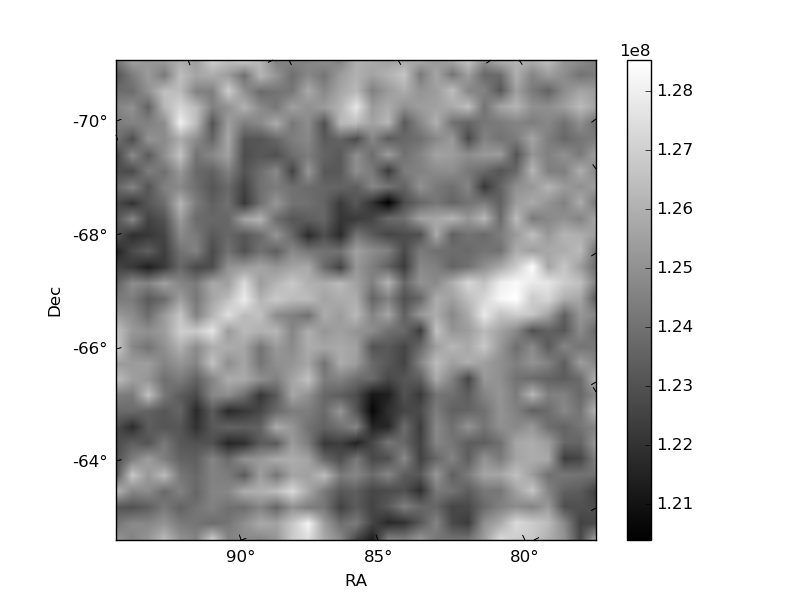
Quadrant B |
|---|---|---|---|
| Quadrant D | 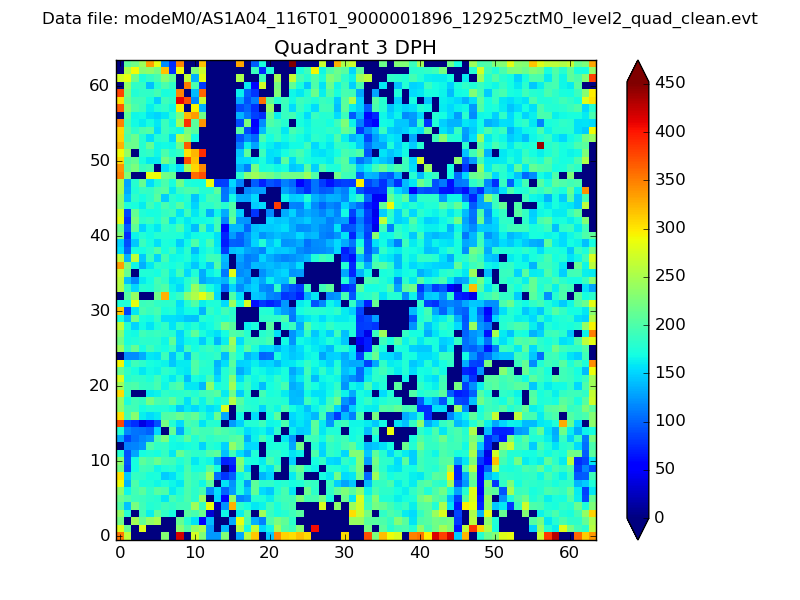 |
 |
Quadrant C |
| Plot type | Count rate plots | Images |
|---|---|---|
| Comparison with Poisson distribution Blue bars denote a histogram of data divided into 1 sec bins. Red curve is a Poisson curve with rate = median count rate of data. |
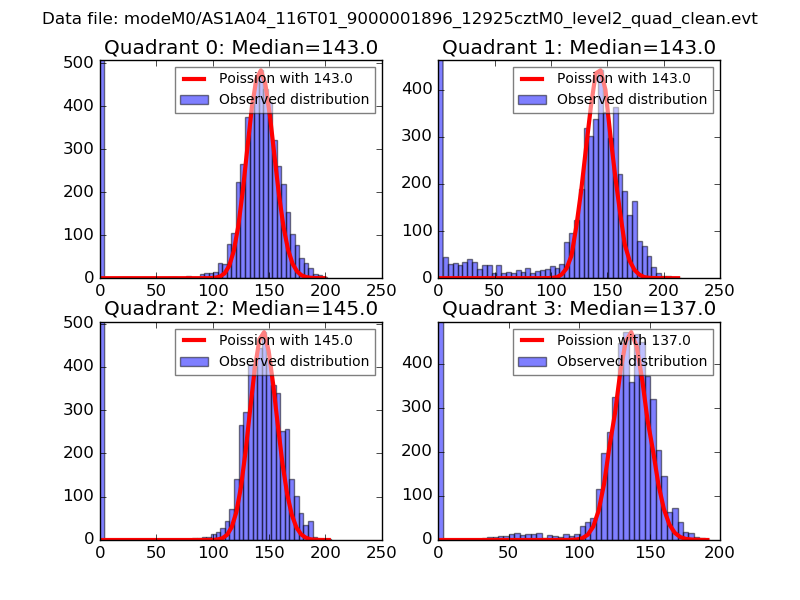 |
 |
| Quadrant-wise count rates Data is divided into 100 sec bins |
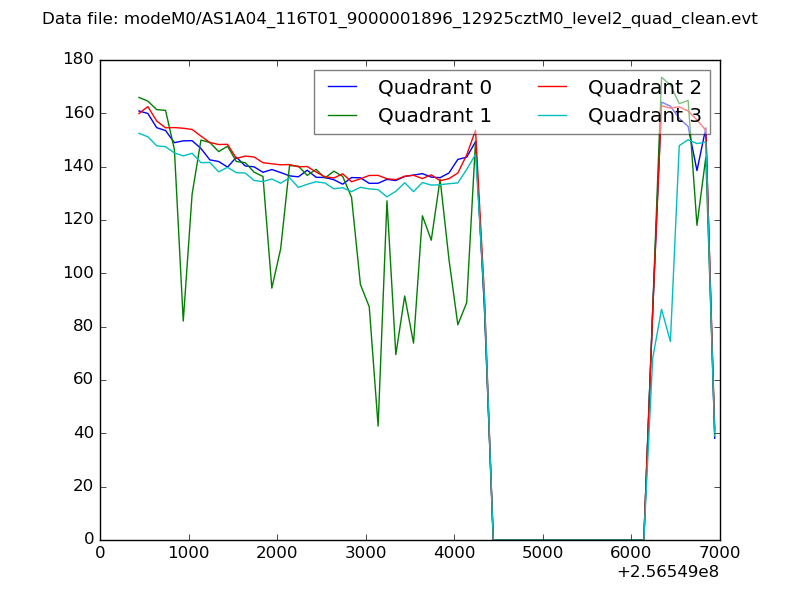 |
|
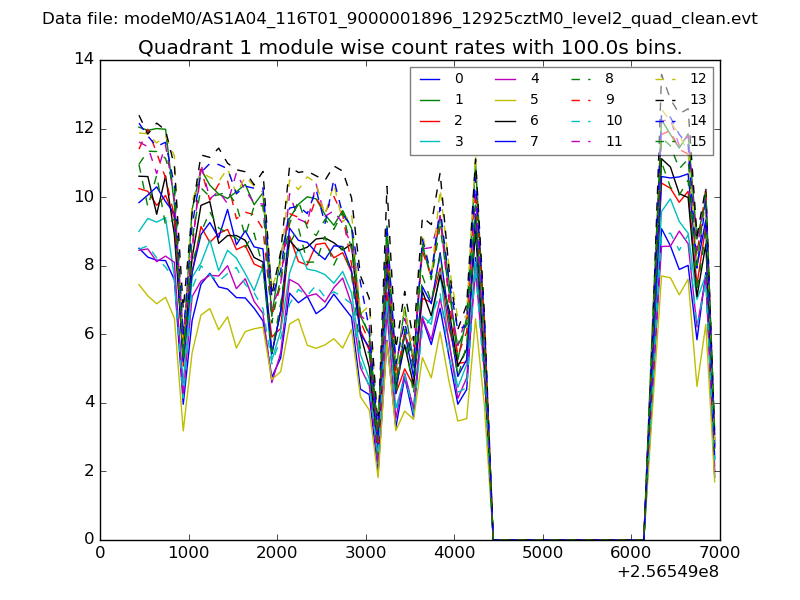
| Module-wise count rates for Quadrant A Data is divided into 100 sec bins |
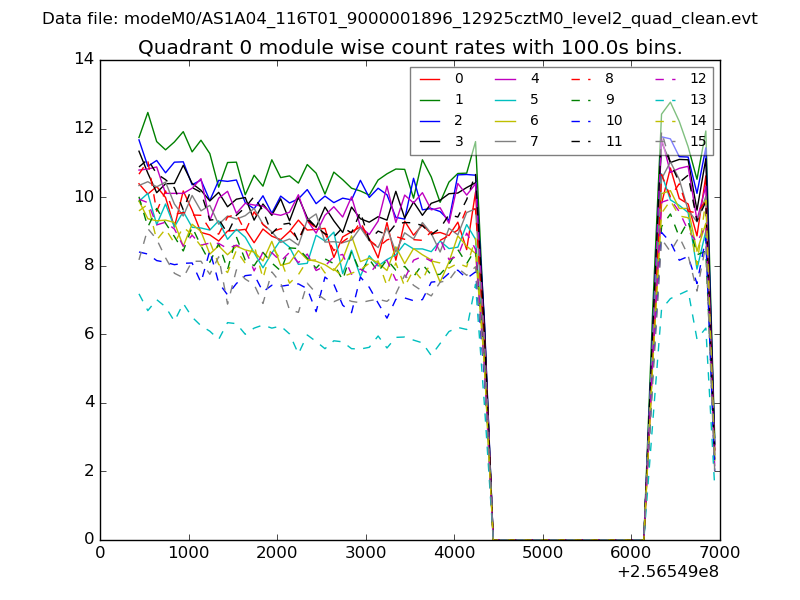 |
 |
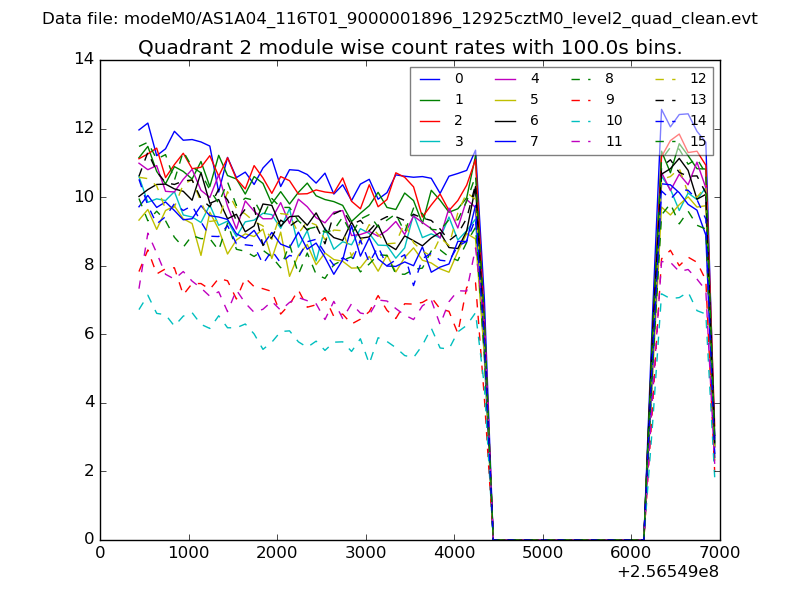
| Module-wise count rates for Quadrant B Data is divided into 100 sec bins |
 |
 |
| Module-wise count rates for Quadrant C Data is divided into 100 sec bins |
 |
 |
| Module-wise count rates for Quadrant D Data is divided into 100 sec bins |
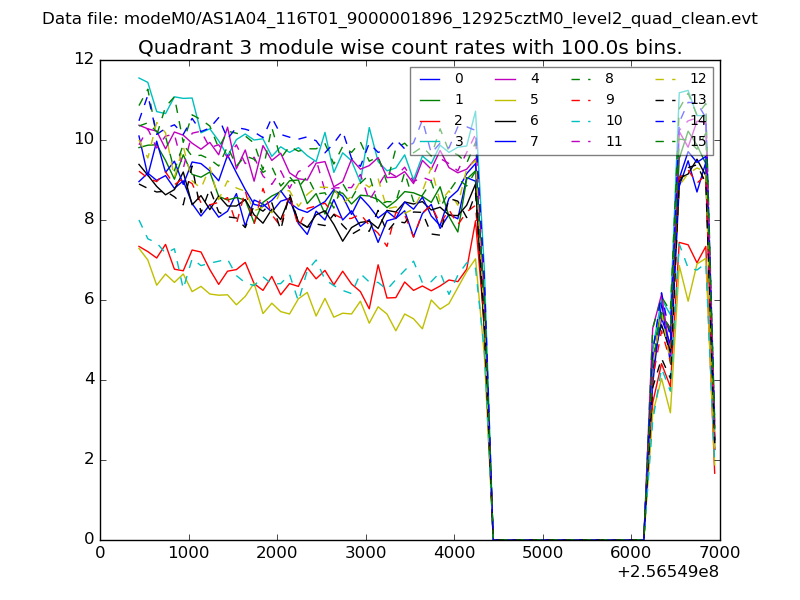 |
 |
| Parameter | Plot |
|---|---|
| CZT HV Monitor | 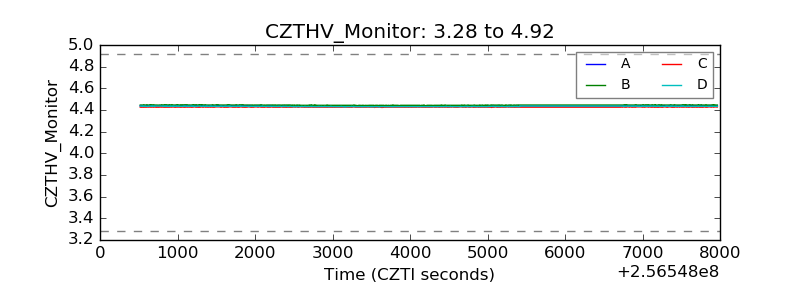 |
| D_VDD | 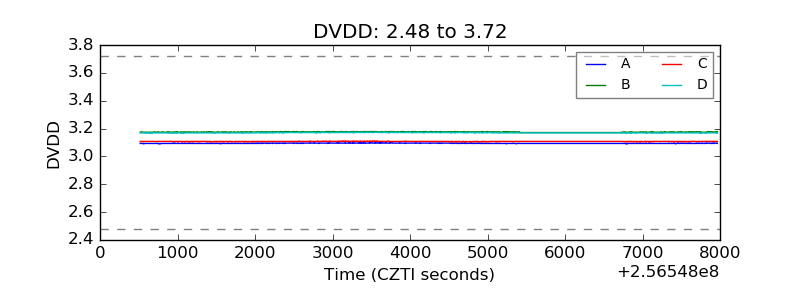 |
| Temperature 1 | 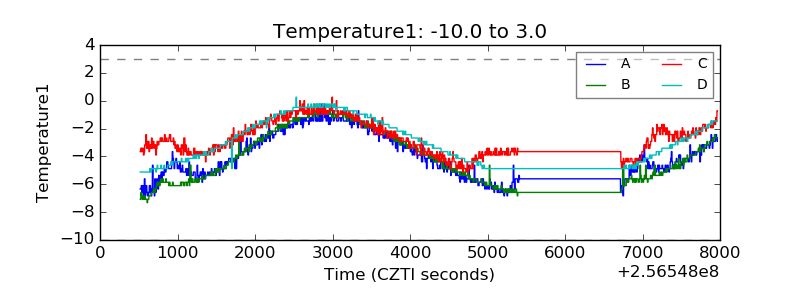 |
| Veto HV Monitor | 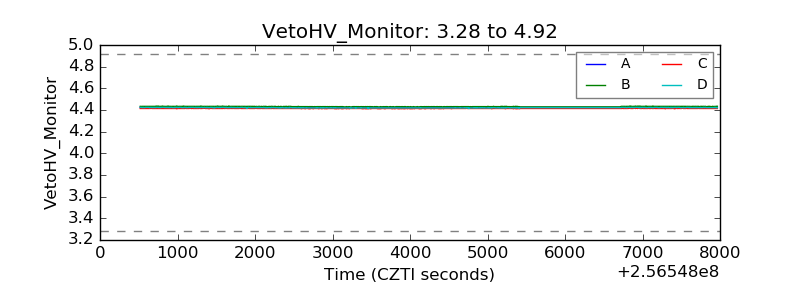 |
| Veto LLD |  |
| Alpha Counter | 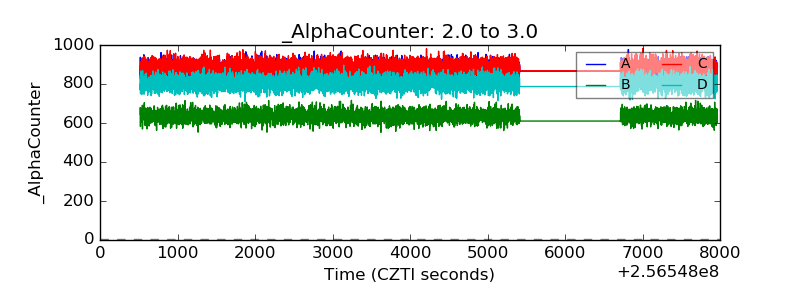 |
| _CPM_Rate | 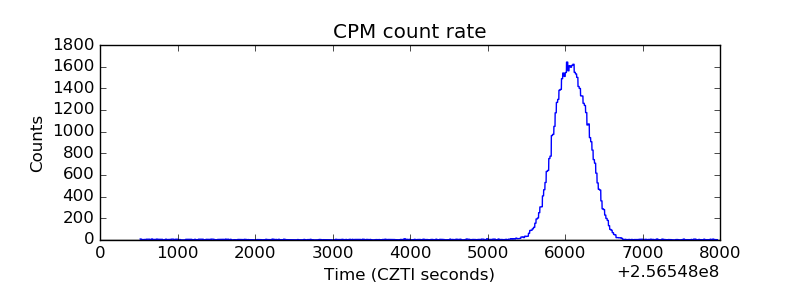 |
| CZT Counter | 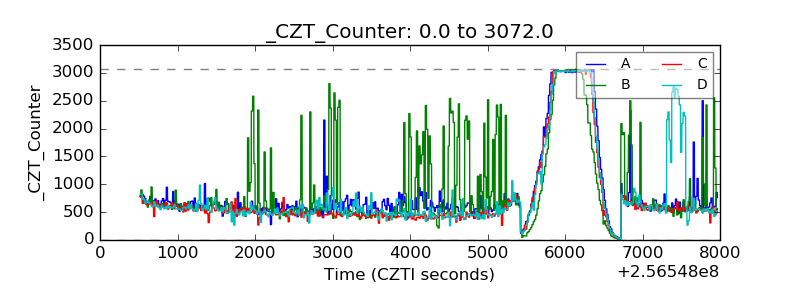 |
| +2.5 Volts monitor |  |
| +5 Volts monitor |  |
| _ROLL_ROT | 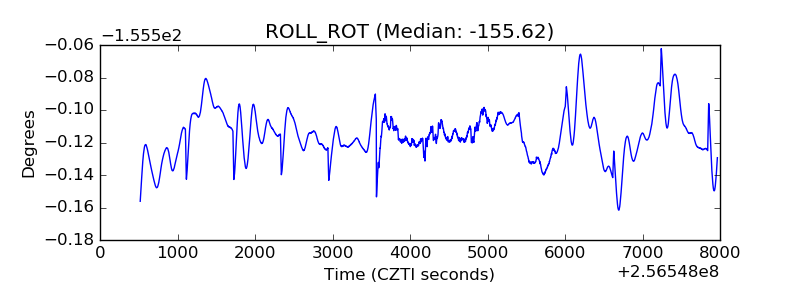 |
| _Roll_DEC | 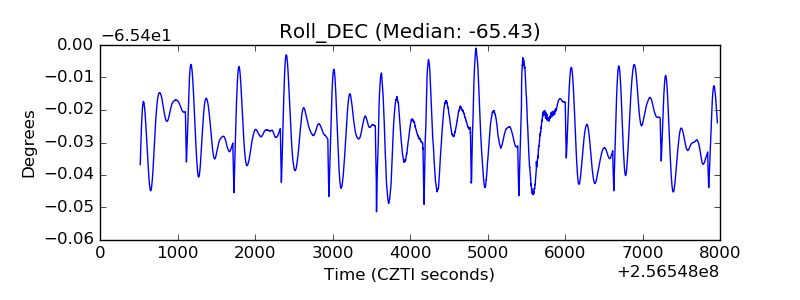 |
| _Roll_RA | 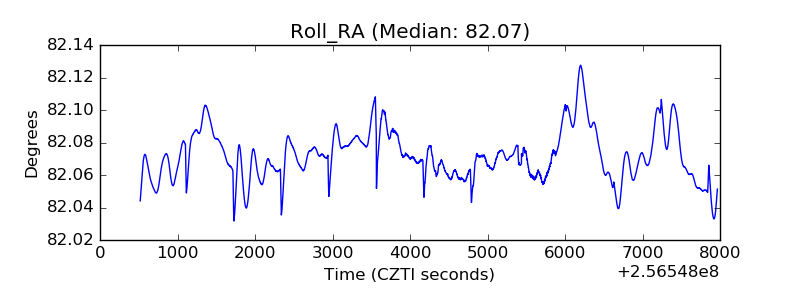 |
| Veto Counter | 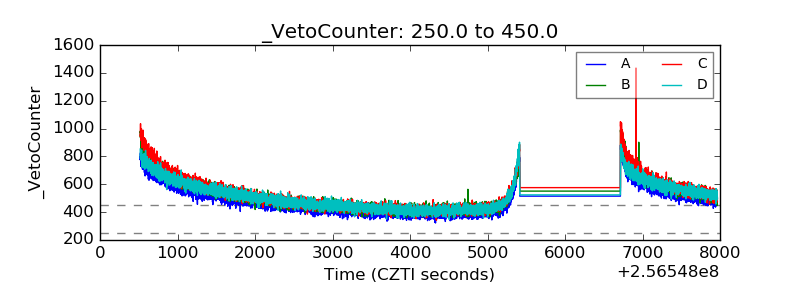 |