| Param | Original file | Final file |
|---|---|---|
| Filename | modeM0/AS1A04_116T01_9000001896_12927cztM0_level2.evt | modeM0/AS1A04_116T01_9000001896_12927cztM0_level2_quad_clean.evt |
| Size (bytes) | 176,878,080 | 45,685,440 |
| Size | 168.7 MB | 43.6 MB |
| Events in quadrant A | 1,400,507 | 307,620 |
| Events in quadrant B | 1,632,730 | 294,920 |
| Events in quadrant C | 1,032,208 | 314,269 |
| Events in quadrant D | 1,134,843 | 302,725 |
| Mode SS | |||
|---|---|---|---|
| Quadrant | BADHDUFLAG | Total packets | Discarded packets |
| A | 0 | 46 | 0 |
| B | 0 | 46 | 0 |
| C | 0 | 46 | 0 |
| D | 0 | 46 | 0 |
| Mode M0 | |||
|---|---|---|---|
| Quadrant | BADHDUFLAG | Total packets | Discarded packets |
| A | 0 | 5596 | 0 |
| B | 0 | 6297 | 0 |
| C | 0 | 4550 | 0 |
| D | 0 | 4799 | 0 |
| Quadrant | Total seconds | Saturated seconds | Saturation percentage |
|---|---|---|---|
| A | 2265 | 55 | 2.428256% |
| B | 2265 | 232 | 10.242826% |
| C | 2265 | 0 | 0.000000% |
| D | 2265 | 7 | 0.309051% |
Noise dominated data is calculated using 1-second bins in cleaned event files. If a bin has >2000 counts, and if more than 50% of those come from <1% of pixels, then it is considered to be noise-dominated and hence unusable.
| Quadrant | # 1 sec bins | Bins with >0 counts | Bins with >2000 counts | High rate bins dominated by noise | Noise dominated (total time) | Noise dominated (detector-on time) | Marked lightcurve |
|---|---|---|---|---|---|---|---|
| A | 2266 | 2266 | 41 | 41 | 1.81% | 1.81% | 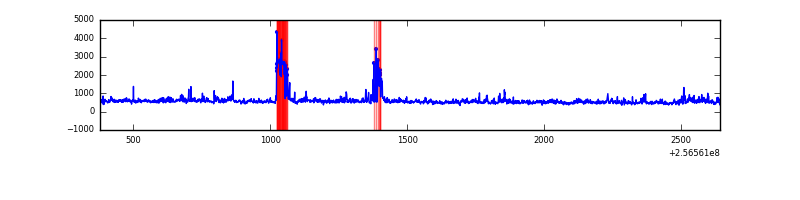 |
| B | 2266 | 2266 | 148 | 148 | 6.53% | 6.53% | 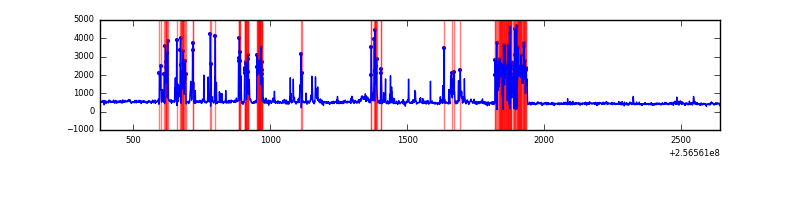 |
| C | 2266 | 2266 | 0 | 0 | 0.00% | 0.00% | 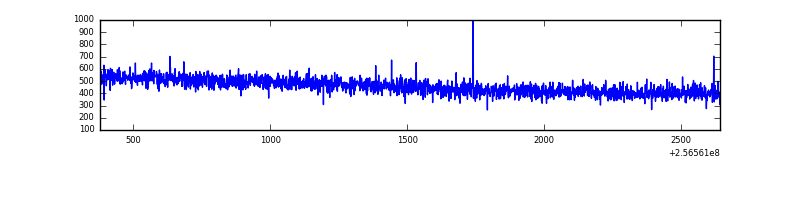 |
| D | 2266 | 2266 | 6 | 6 | 0.26% | 0.26% | 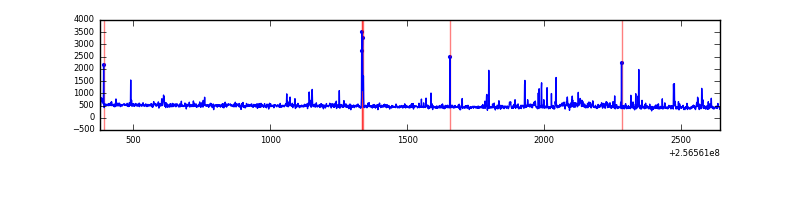 |
Top three noisy pixels from each quadrant. If the there are fewer than three noisy pixels in the level2.evt file, extra rows are filled as -1
| Pixel properties | Quadrant properties | ||||||
|---|---|---|---|---|---|---|---|
| Quadrant | DetID | PixID | Counts | Sigma | Mean | Median | Sigma |
| A | 15 | 239 | 125185 | 2217.98 | 274 | 270 | 56.3 |
| A | 15 | 223 | 111153 | 1968.82 | 274 | 270 | 56.3 |
| A | 1 | 162 | 44950 | 793.33 | 274 | 270 | 56.3 |
| B | 4 | 239 | 502524 | 10191.47 | 256 | 250 | 49.3 |
| B | 3 | 64 | 112045 | 2268.39 | 256 | 250 | 49.3 |
| B | 0 | 230 | 6916 | 135.26 | 256 | 250 | 49.3 |
| C | 13 | 61 | 1966 | 27.88 | 264 | 265 | 61.0 |
| C | 4 | 112 | 1774 | 24.73 | 264 | 265 | 61.0 |
| C | 8 | 222 | 854 | 9.65 | 264 | 265 | 61.0 |
| D | 8 | 195 | 61900 | 967.45 | 268 | 263 | 63.7 |
| D | 1 | 52 | 28746 | 447.07 | 268 | 263 | 63.7 |
| D | 2 | 14 | 9246 | 141.0 | 268 | 263 | 63.7 |
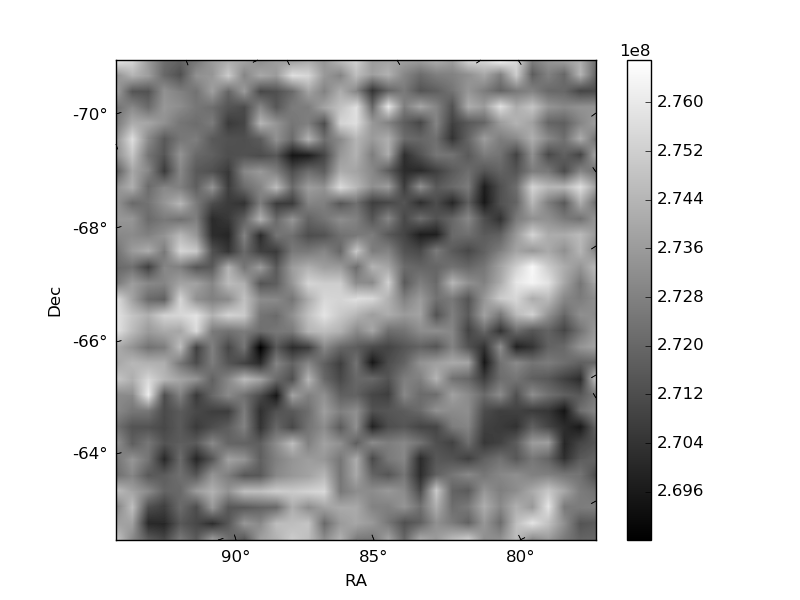
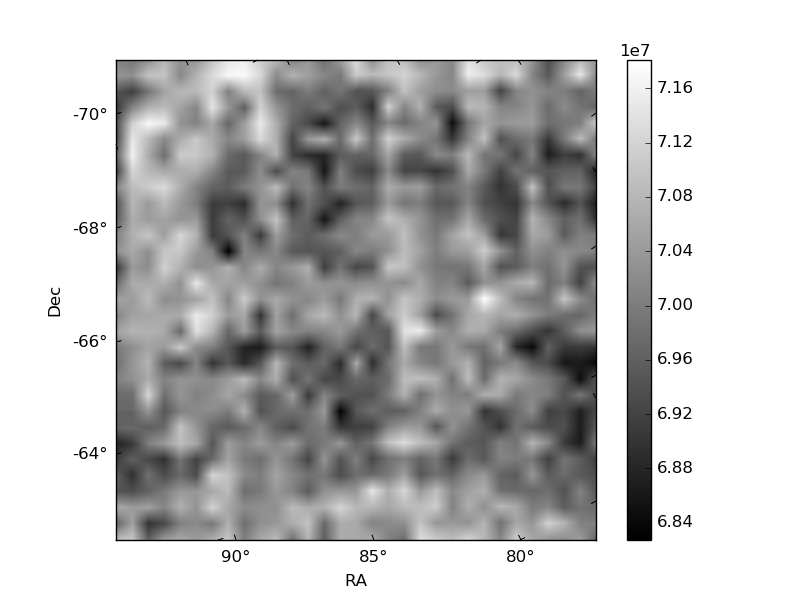
Histogram calculated using DETX and DETY for each event in the final _common_clean file
| Quadrant A | 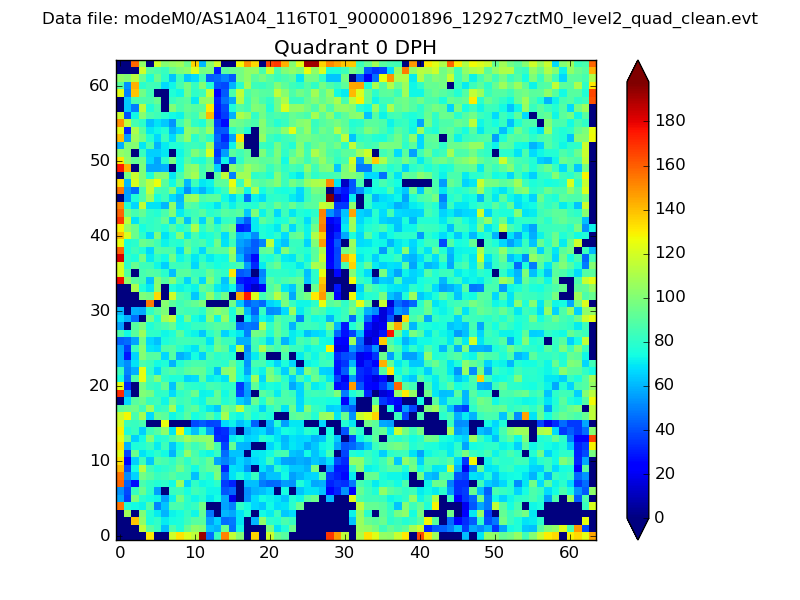 |
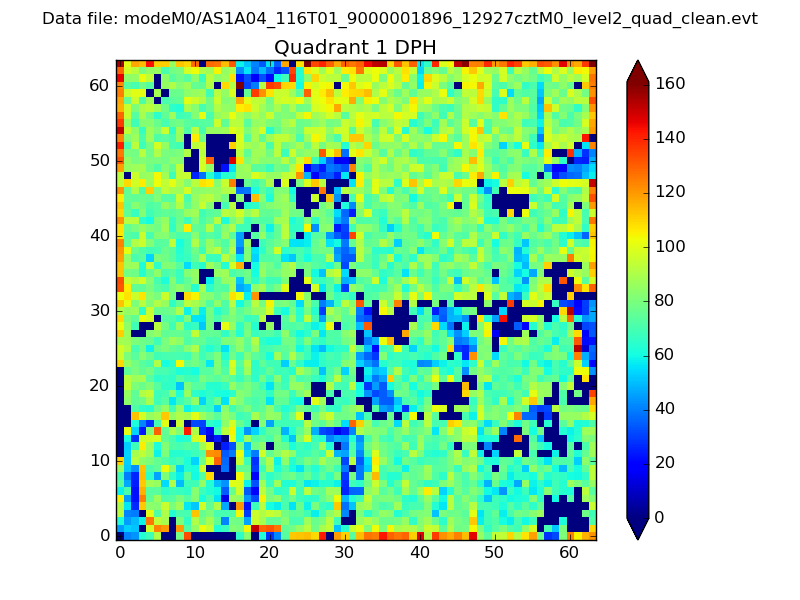 |
Quadrant B |
|---|---|---|---|
| Quadrant D |  |
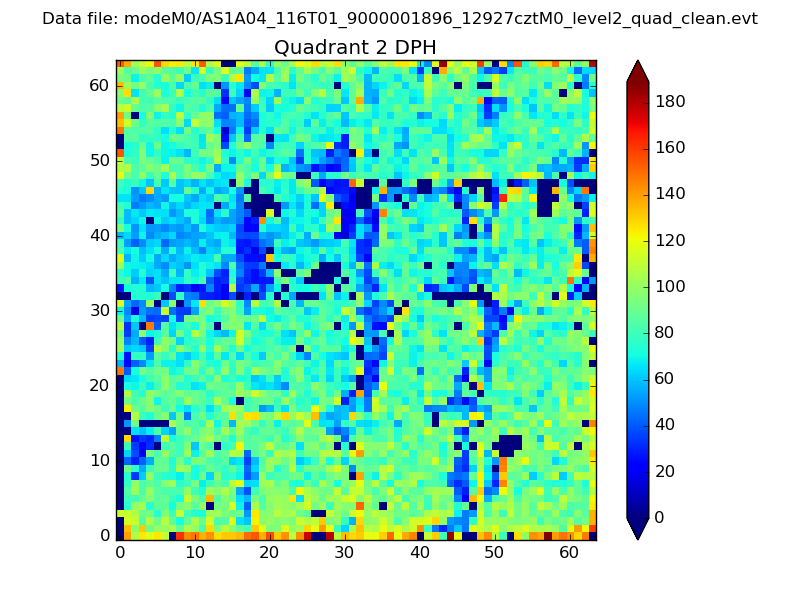 |
Quadrant C |
| Plot type | Count rate plots | Images |
|---|---|---|
| Comparison with Poisson distribution Blue bars denote a histogram of data divided into 1 sec bins. Red curve is a Poisson curve with rate = median count rate of data. |
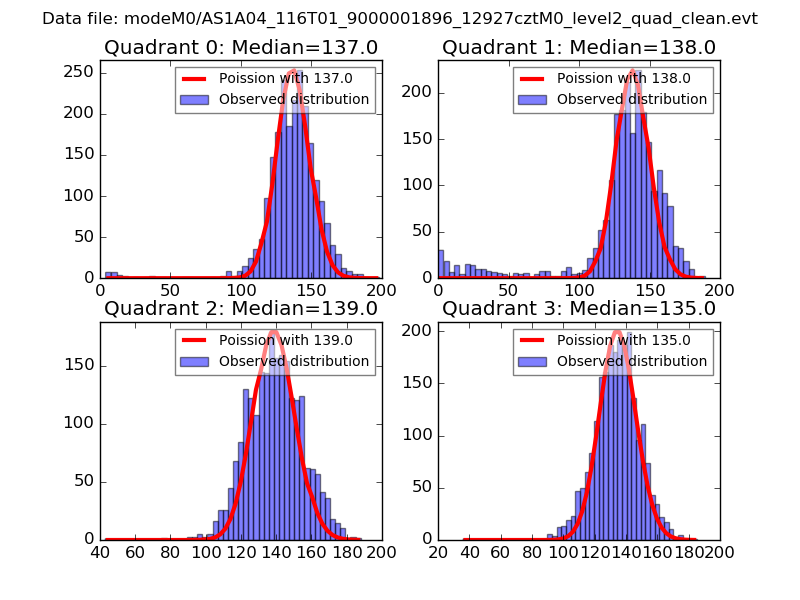 |
 |
| Quadrant-wise count rates Data is divided into 100 sec bins |
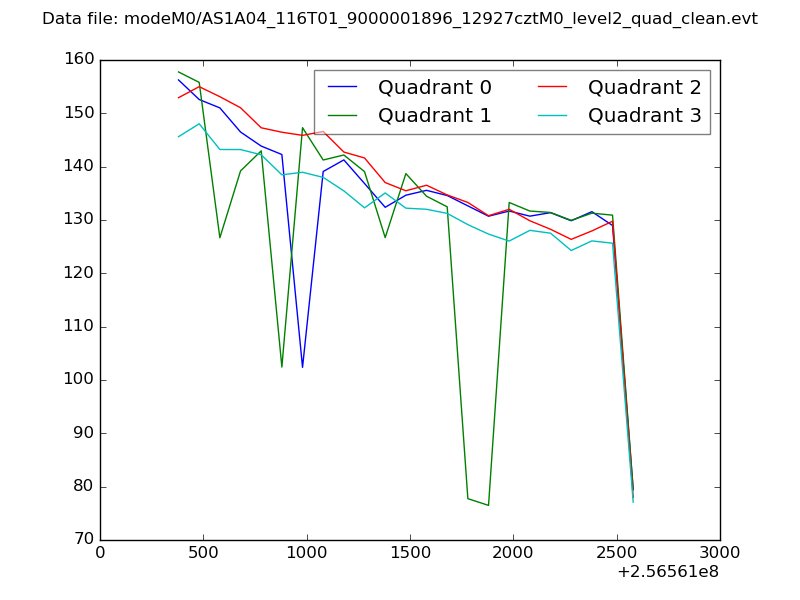 |
|
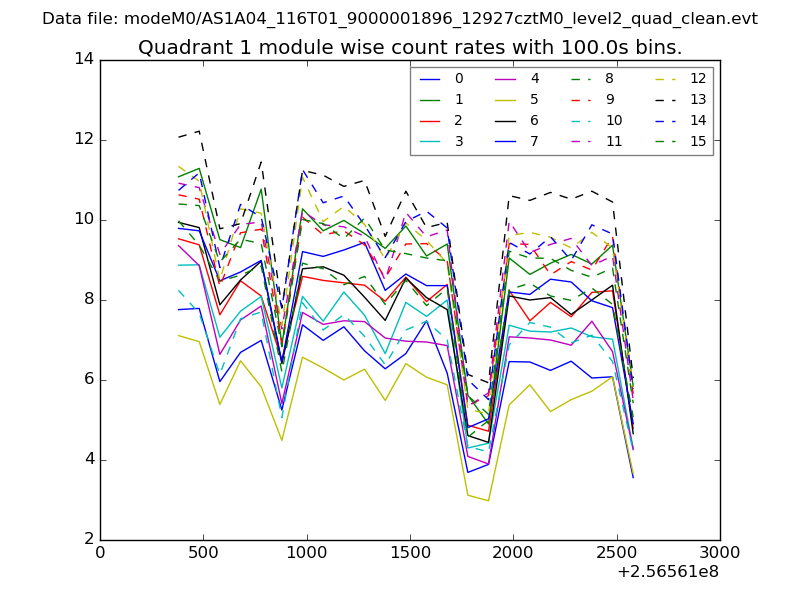
| Module-wise count rates for Quadrant A Data is divided into 100 sec bins |
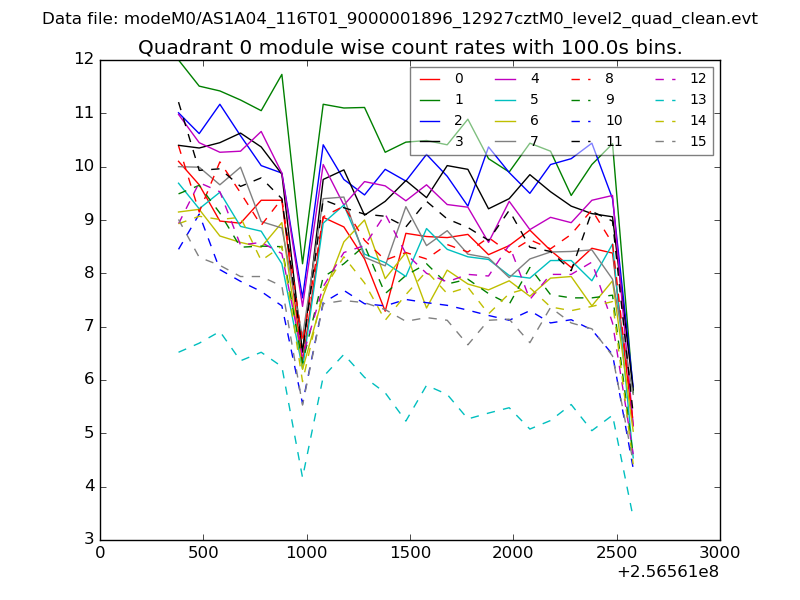 |
 |
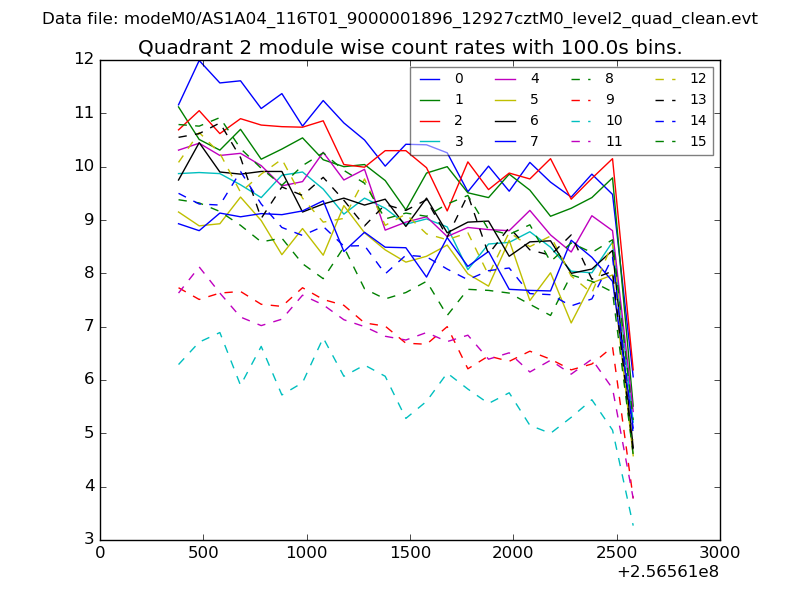
| Module-wise count rates for Quadrant B Data is divided into 100 sec bins |
 |
 |
| Module-wise count rates for Quadrant C Data is divided into 100 sec bins |
 |
 |
| Module-wise count rates for Quadrant D Data is divided into 100 sec bins |
 |
 |
| Parameter | Plot |
|---|---|
| CZT HV Monitor | 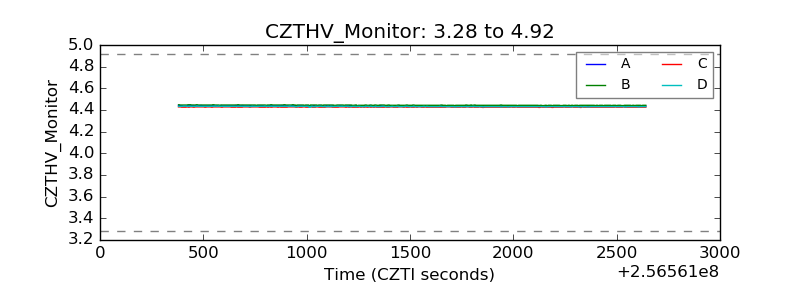 |
| D_VDD | 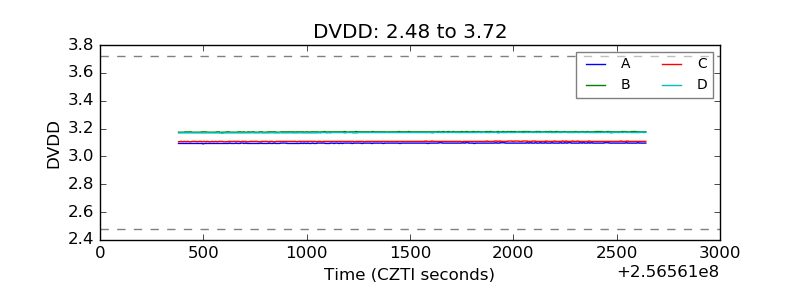 |
| Temperature 1 | 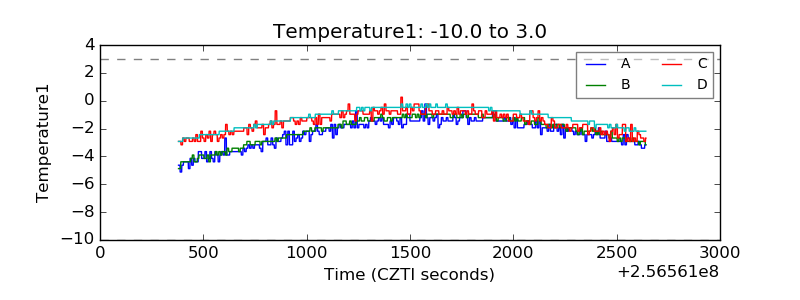 |
| Veto HV Monitor | 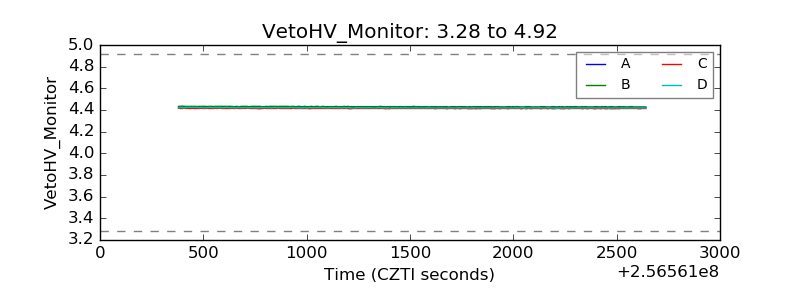 |
| Veto LLD | 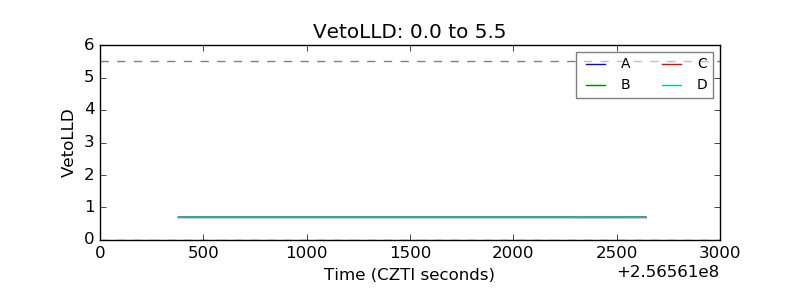 |
| Alpha Counter | 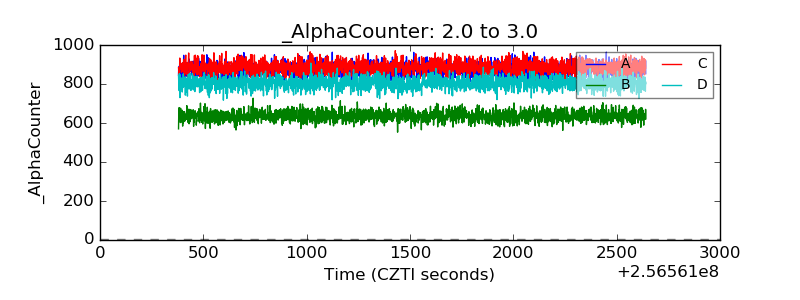 |
| _CPM_Rate | 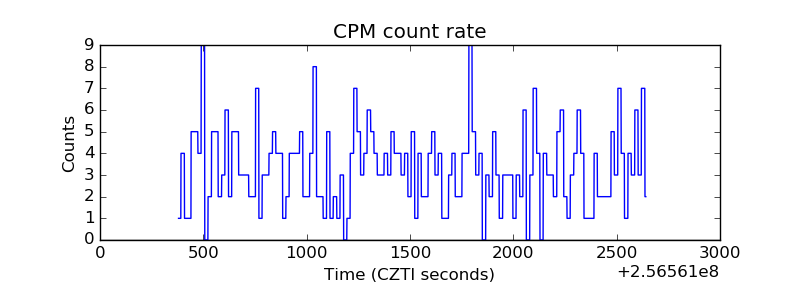 |
| CZT Counter | 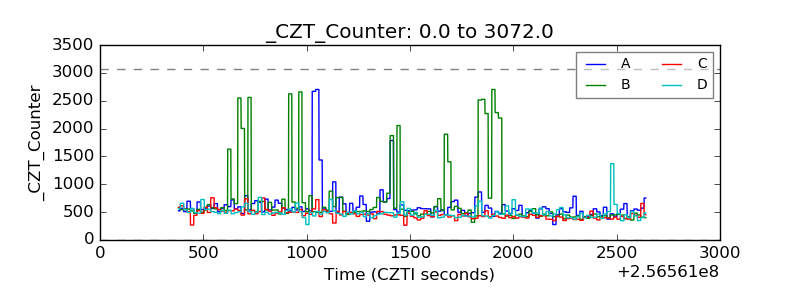 |
| +2.5 Volts monitor | 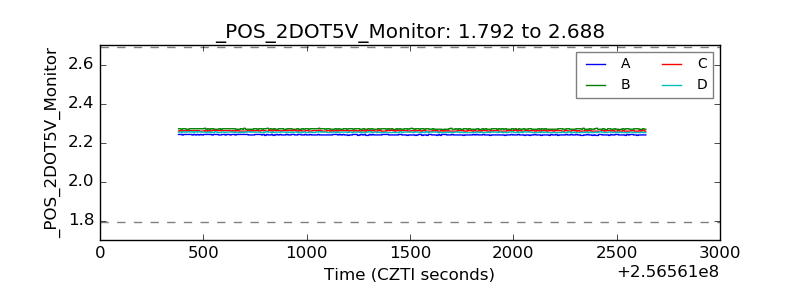 |
| +5 Volts monitor | 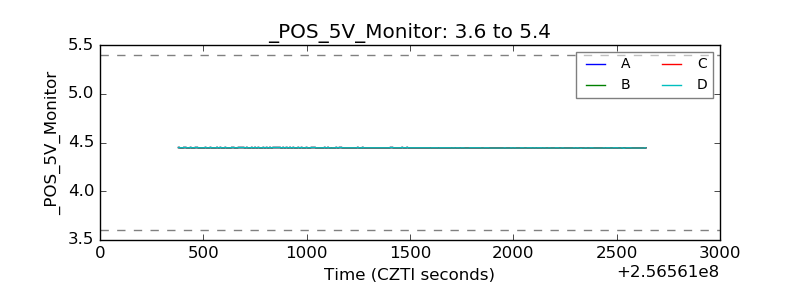 |
| _ROLL_ROT | 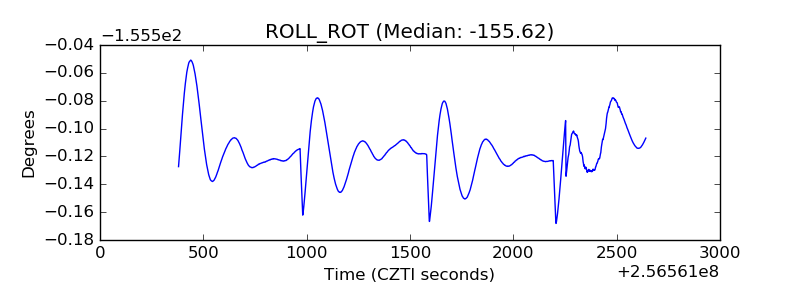 |
| _Roll_DEC | 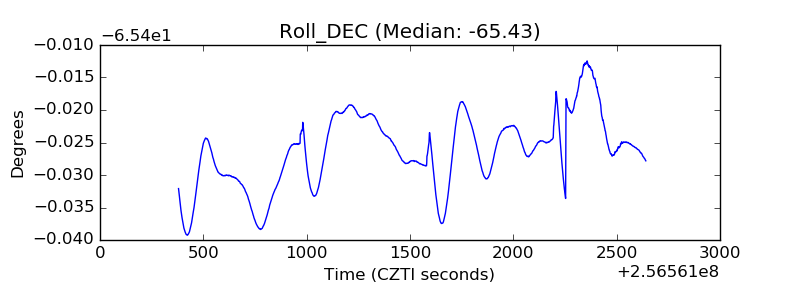 |
| _Roll_RA | 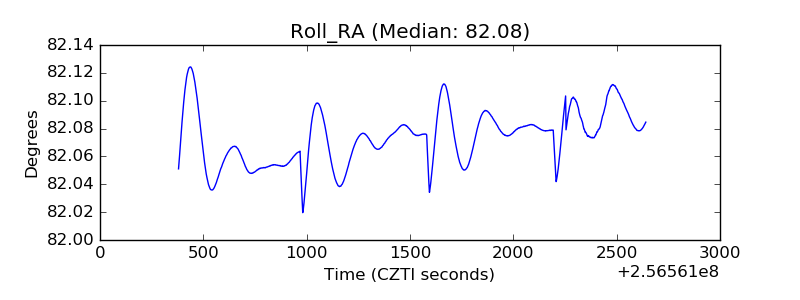 |
| Veto Counter | 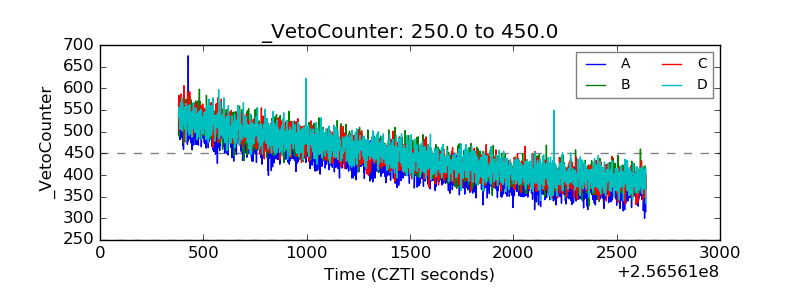 |