| Param | Original file | Final file |
|---|---|---|
| Filename | modeM0/AS1A04_115T02_9000001900cztM0_level2.fits | modeM0/AS1A04_115T02_9000001900cztM0_level2_quad_clean.evt |
| Size (bytes) | 924,984,000 | 826,390,080 |
| Size | 882.1 MB | 788.1 MB |
| Events in quadrant A | 5,706,480 | 4,939,605 |
| Events in quadrant B | 5,145,548 | 4,464,560 |
| Events in quadrant C | 5,689,076 | 4,836,688 |
| Events in quadrant D | 4,744,036 | 4,065,961 |
| Mode SS | |||
|---|---|---|---|
| Quadrant | BADHDUFLAG | Total packets | Discarded packets |
| A | 0 | 1998 | 0 |
| B | 0 | 1998 | 0 |
| C | 0 | 1998 | 0 |
| D | 0 | 1998 | 0 |
| Mode M9 | |||
|---|---|---|---|
| Quadrant | BADHDUFLAG | Total packets | Discarded packets |
| A | 0 | 136 | 0 |
| B | 0 | 136 | 0 |
| C | 0 | 136 | 0 |
| D | 0 | 136 | 0 |
| Mode M0 | |||
|---|---|---|---|
| Quadrant | BADHDUFLAG | Total packets | Discarded packets |
| A | 0 | 222391 | 0 |
| B | 0 | 273940 | 0 |
| C | 0 | 201211 | 0 |
| D | 0 | 287424 | 0 |
| Quadrant | Total seconds | Saturated seconds | Saturation percentage |
|---|---|---|---|
| A | 98037 | 1919 | 1.957424% |
| B | 98037 | 10937 | 11.155992% |
| C | 98037 | 671 | 0.684435% |
| D | 98037 | 9201 | 9.385232% |
Noise dominated data is calculated using 1-second bins in cleaned event files. If a bin has >2000 counts, and if more than 50% of those come from <1% of pixels, then it is considered to be noise-dominated and hence unusable.
| Quadrant | # 1 sec bins | Bins with >0 counts | Bins with >2000 counts | High rate bins dominated by noise | Noise dominated (total time) | Noise dominated (detector-on time) | Marked lightcurve |
|---|---|---|---|---|---|---|---|
| A | 111567 | 98030 | 0 | 0 | 0.00% | 0.00% | 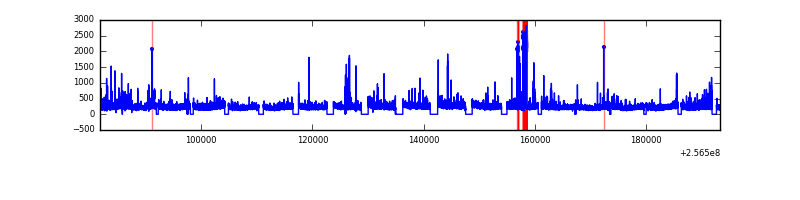 |
| B | 111567 | 96398 | 0 | 0 | 0.00% | 0.00% |  |
| C | 111567 | 98037 | 0 | 0 | 0.00% | 0.00% |  |
| D | 111566 | 97957 | 0 | 0 | 0.00% | 0.00% | 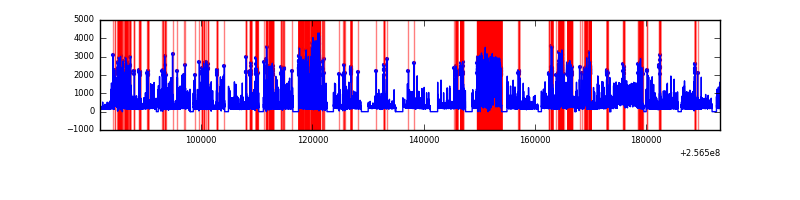 |
Top three noisy pixels from each quadrant. If the there are fewer than three noisy pixels in the level2.evt file, extra rows are filled as -1
| Pixel properties | Quadrant properties | ||||||
|---|---|---|---|---|---|---|---|
| Quadrant | DetID | PixID | Counts | Sigma | Mean | Median | Sigma |
| A | 0 | 29 | 5455 | 11.02 | 1487 | 1389 | 369.0 |
| A | 7 | 110 | 4569 | 8.62 | 1487 | 1389 | 369.0 |
| A | 9 | 19 | 4224 | 7.68 | 1487 | 1389 | 369.0 |
| B | 2 | 9 | 4547 | 12.14 | 1354 | 1289 | 268.4 |
| B | 3 | 17 | 3430 | 7.98 | 1354 | 1289 | 268.4 |
| B | 14 | 254 | 3396 | 7.85 | 1354 | 1289 | 268.4 |
| C | 1 | 80 | 4075 | 6.89 | 1502 | 1395 | 389.2 |
| C | 1 | 81 | 3956 | 6.58 | 1502 | 1395 | 389.2 |
| C | 12 | 241 | 3933 | 6.52 | 1502 | 1395 | 389.2 |
| D | 3 | 14 | 3533 | 6.4 | 1350 | 1227 | 360.2 |
| D | 6 | 231 | 3330 | 5.84 | 1350 | 1227 | 360.2 |
| D | 7 | 5 | 3289 | 5.72 | 1350 | 1227 | 360.2 |
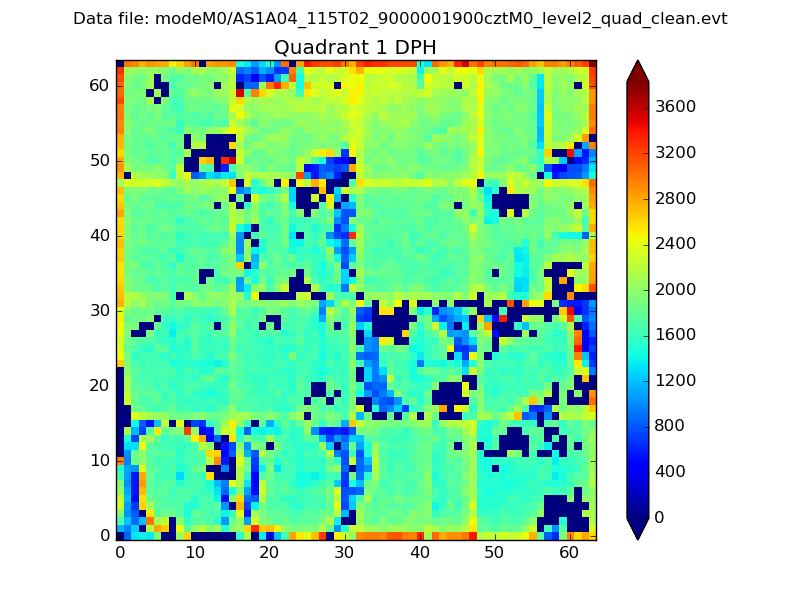
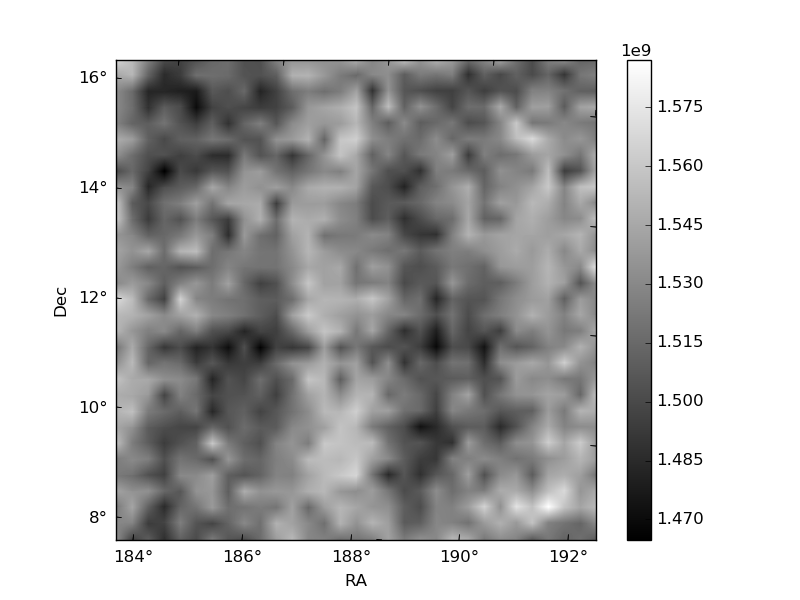
Histogram calculated using DETX and DETY for each event in the final _common_clean file
| Quadrant A |  |
 |
Quadrant B |
|---|---|---|---|
| Quadrant D | 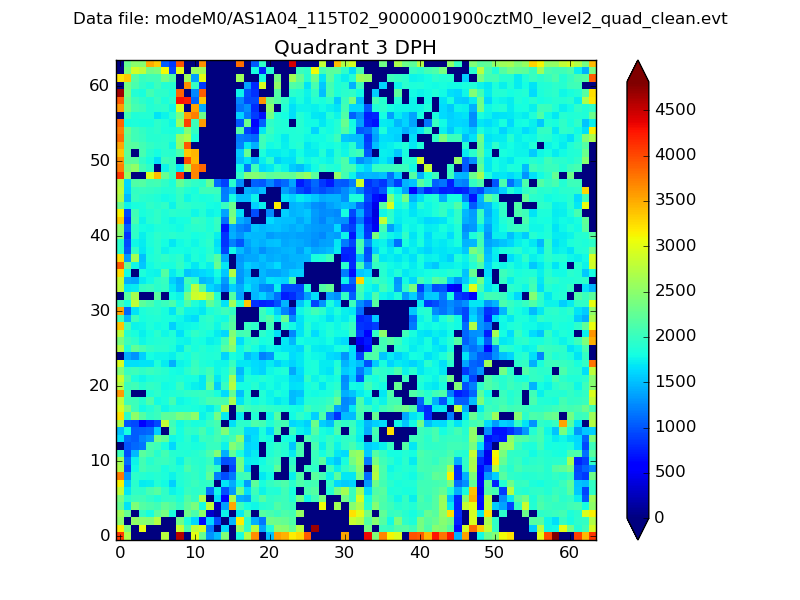 |
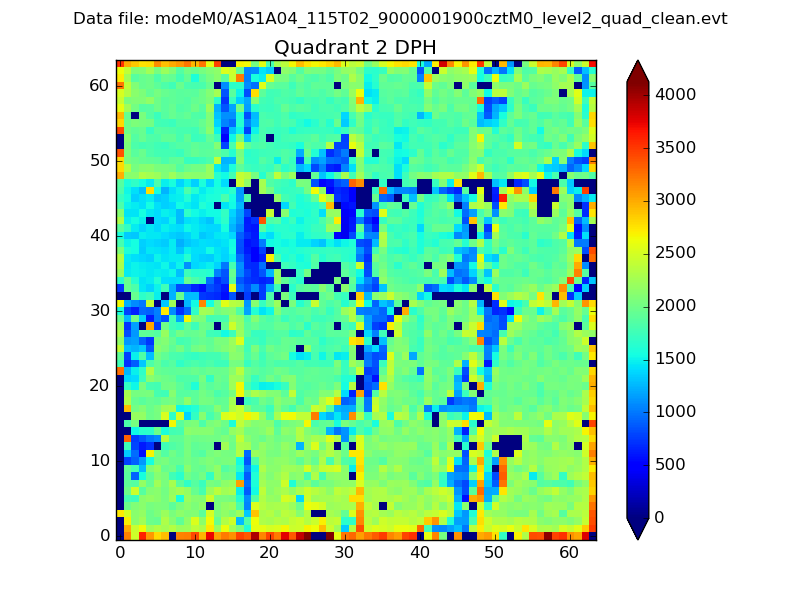 |
Quadrant C |
| Plot type | Count rate plots | Images |
|---|---|---|
| Comparison with Poisson distribution Blue bars denote a histogram of data divided into 1 sec bins. Red curve is a Poisson curve with rate = median count rate of data. |
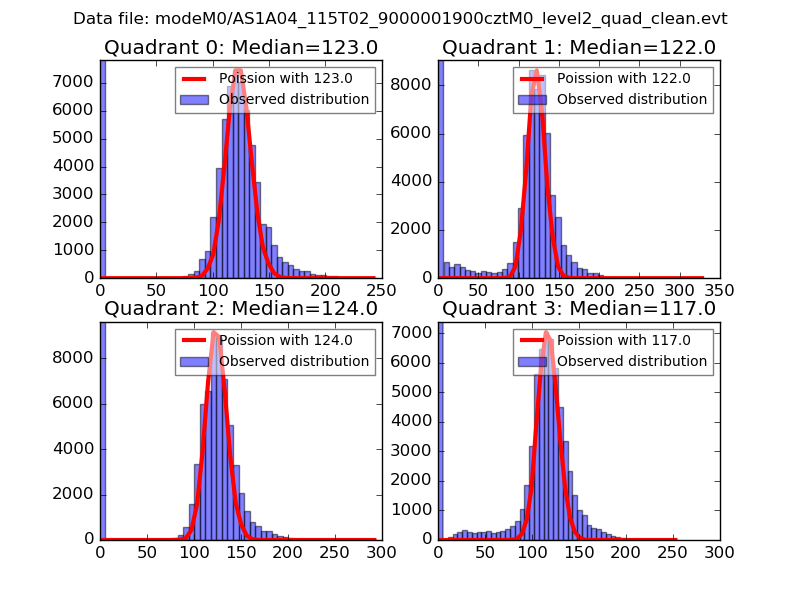 |
 |
| Quadrant-wise count rates Data is divided into 100 sec bins |
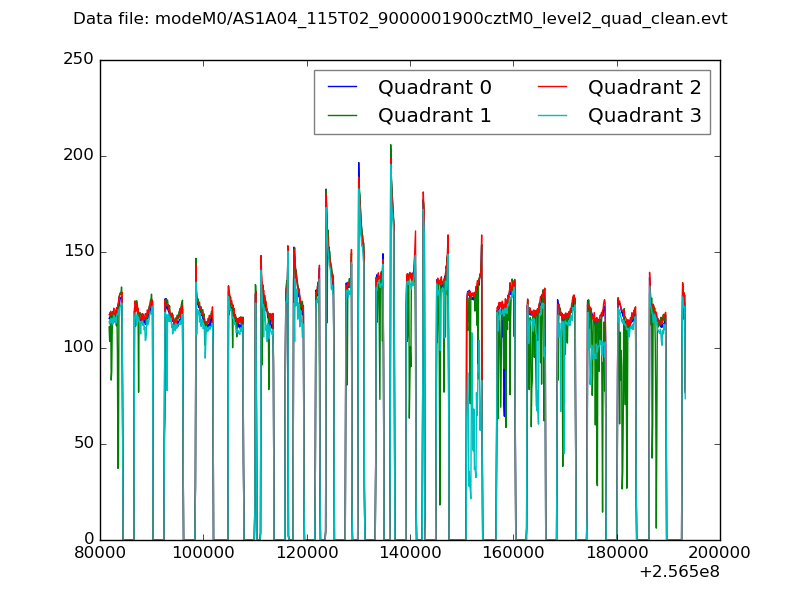 |
|
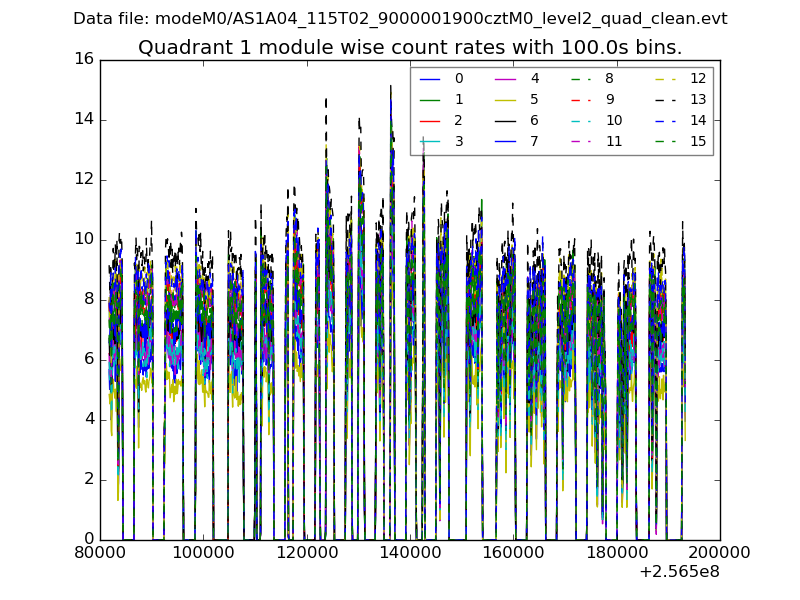
| Module-wise count rates for Quadrant A Data is divided into 100 sec bins |
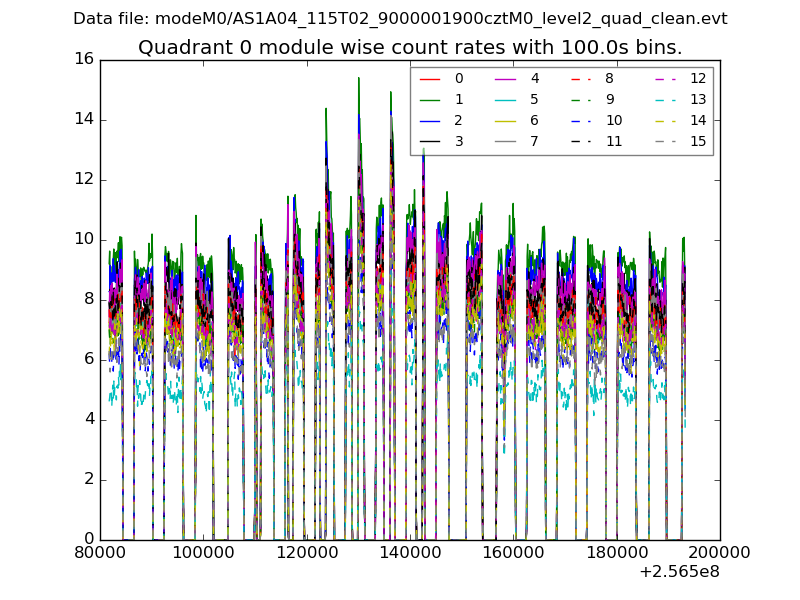 |
 |
| Module-wise count rates for Quadrant B Data is divided into 100 sec bins |
 |
 |
| Module-wise count rates for Quadrant C Data is divided into 100 sec bins |
 |
 |
| Module-wise count rates for Quadrant D Data is divided into 100 sec bins |
 |
 |
| Parameter | Plot |
|---|---|
| CZT HV Monitor | 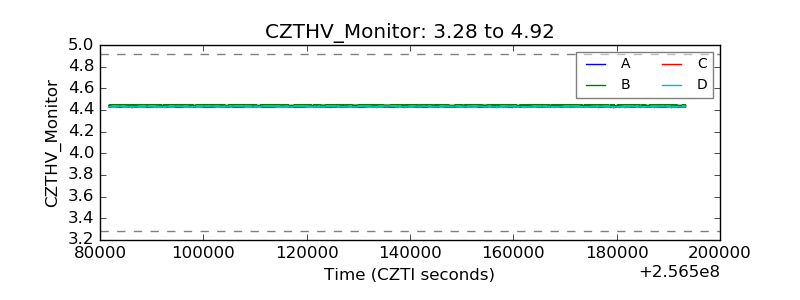 |
| D_VDD | 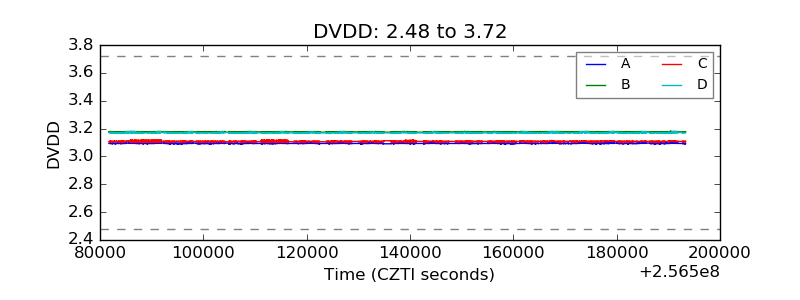 |
| Temperature 1 | 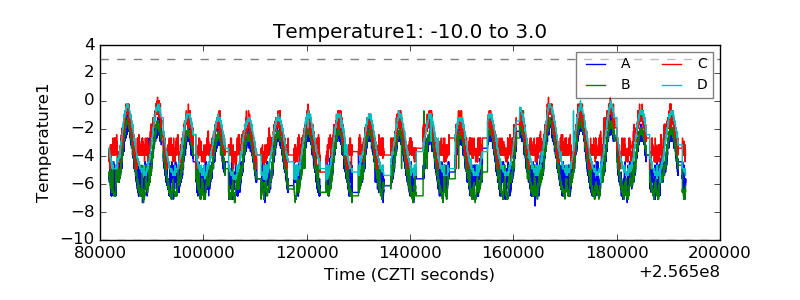 |
| Veto HV Monitor |  |
| Veto LLD |  |
| Alpha Counter | 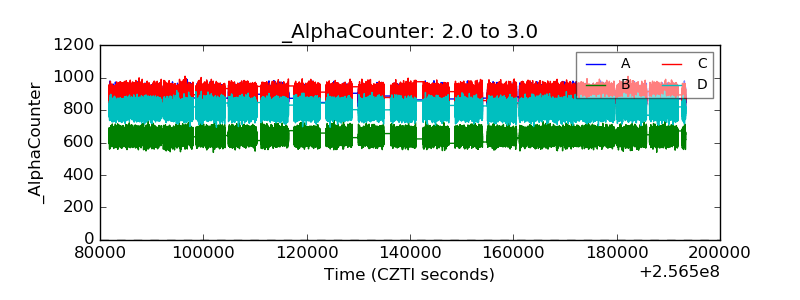 |
| _CPM_Rate | 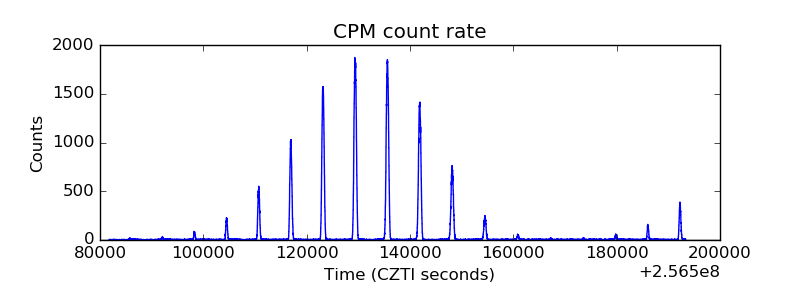 |
| CZT Counter | 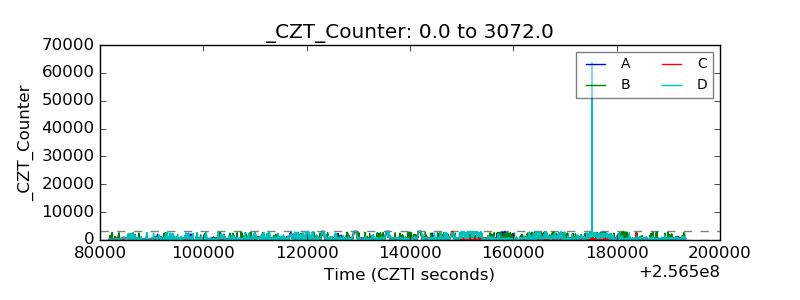 |
| +2.5 Volts monitor |  |
| +5 Volts monitor |  |
| _ROLL_ROT | 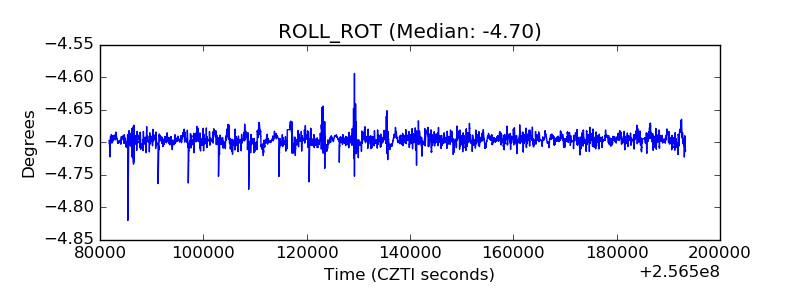 |
| _Roll_DEC |  |
| _Roll_RA |  |
| Veto Counter | 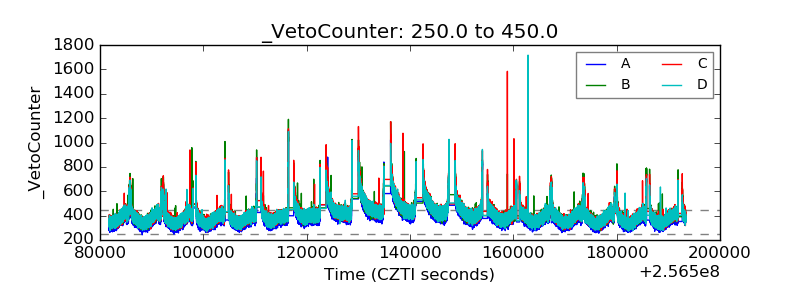 |