| Param | Original file | Final file |
|---|---|---|
| Filename | modeM0/AS1A04_115T02_9000001900_12930cztM0_level2.evt | modeM0/AS1A04_115T02_9000001900_12930cztM0_level2_quad_clean.evt |
| Size (bytes) | 472,239,360 | 65,756,160 |
| Size | 450.4 MB | 62.7 MB |
| Events in quadrant A | 3,332,881 | 408,054 |
| Events in quadrant B | 4,274,299 | 381,161 |
| Events in quadrant C | 2,617,514 | 413,246 |
| Events in quadrant D | 3,697,133 | 397,251 |
| Mode SS | |||
|---|---|---|---|
| Quadrant | BADHDUFLAG | Total packets | Discarded packets |
| A | 0 | 114 | 0 |
| B | 0 | 114 | 0 |
| C | 0 | 114 | 0 |
| D | 0 | 114 | 0 |
| Mode M9 | |||
|---|---|---|---|
| Quadrant | BADHDUFLAG | Total packets | Discarded packets |
| A | 0 | 1 | 0 |
| B | 0 | 1 | 0 |
| C | 0 | 1 | 0 |
| D | 0 | 1 | 0 |
| Mode M0 | |||
|---|---|---|---|
| Quadrant | BADHDUFLAG | Total packets | Discarded packets |
| A | 0 | 13719 | 2 |
| B | 0 | 16316 | 1 |
| C | 0 | 11609 | 1 |
| D | 0 | 15065 | 1 |
| Quadrant | Total seconds | Saturated seconds | Saturation percentage |
|---|---|---|---|
| A | 5589 | 206 | 3.685811% |
| B | 5589 | 790 | 14.134908% |
| C | 5589 | 65 | 1.162999% |
| D | 5589 | 377 | 6.745393% |
Noise dominated data is calculated using 1-second bins in cleaned event files. If a bin has >2000 counts, and if more than 50% of those come from <1% of pixels, then it is considered to be noise-dominated and hence unusable.
| Quadrant | # 1 sec bins | Bins with >0 counts | Bins with >2000 counts | High rate bins dominated by noise | Noise dominated (total time) | Noise dominated (detector-on time) | Marked lightcurve |
|---|---|---|---|---|---|---|---|
| A | 5655 | 5591 | 12 | 12 | 0.21% | 0.21% | 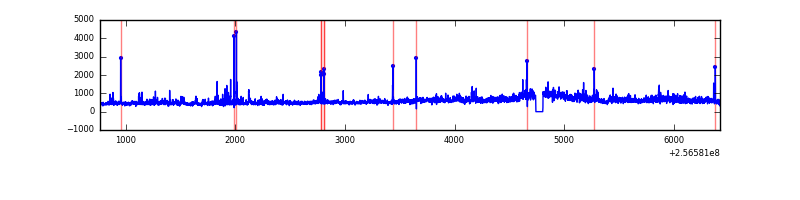 |
| B | 5655 | 5590 | 399 | 399 | 7.06% | 7.14% | 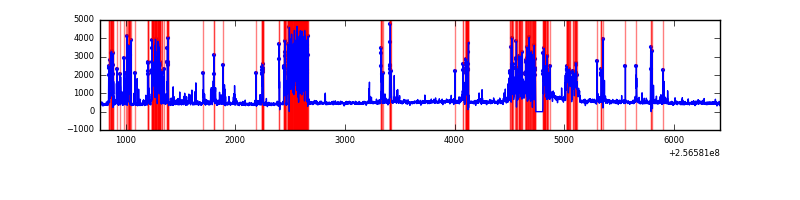 |
| C | 5655 | 5591 | 0 | 0 | 0.00% | 0.00% |  |
| D | 5655 | 5591 | 212 | 212 | 3.75% | 3.79% | 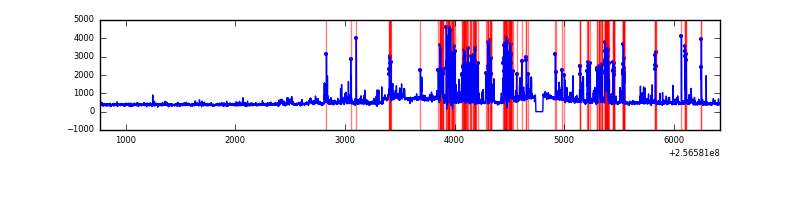 |
Top three noisy pixels from each quadrant. If the there are fewer than three noisy pixels in the level2.evt file, extra rows are filled as -1
| Pixel properties | Quadrant properties | ||||||
|---|---|---|---|---|---|---|---|
| Quadrant | DetID | PixID | Counts | Sigma | Mean | Median | Sigma |
| A | 1 | 162 | 187612 | 1323.25 | 684 | 668 | 141.3 |
| A | 15 | 239 | 111589 | 785.13 | 684 | 668 | 141.3 |
| A | 1 | 178 | 103351 | 726.82 | 684 | 668 | 141.3 |
| B | 4 | 239 | 1553734 | 12794.14 | 636 | 621 | 121.4 |
| B | 3 | 64 | 180579 | 1482.45 | 636 | 621 | 121.4 |
| B | 15 | 52 | 23171 | 185.76 | 636 | 621 | 121.4 |
| C | 13 | 61 | 5002 | 27.63 | 669 | 672 | 156.7 |
| C | 8 | 128 | 3278 | 16.63 | 669 | 672 | 156.7 |
| C | 14 | 234 | 2401 | 11.03 | 669 | 672 | 156.7 |
| D | 1 | 52 | 1152776 | 7362.95 | 650 | 632 | 156.5 |
| D | 2 | 234 | 22658 | 140.76 | 650 | 632 | 156.5 |
| D | 8 | 195 | 21664 | 134.41 | 650 | 632 | 156.5 |
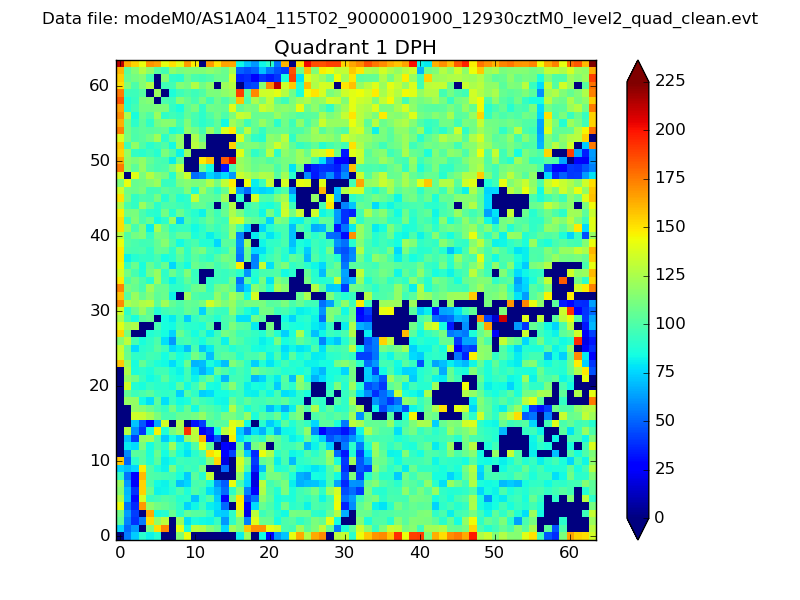
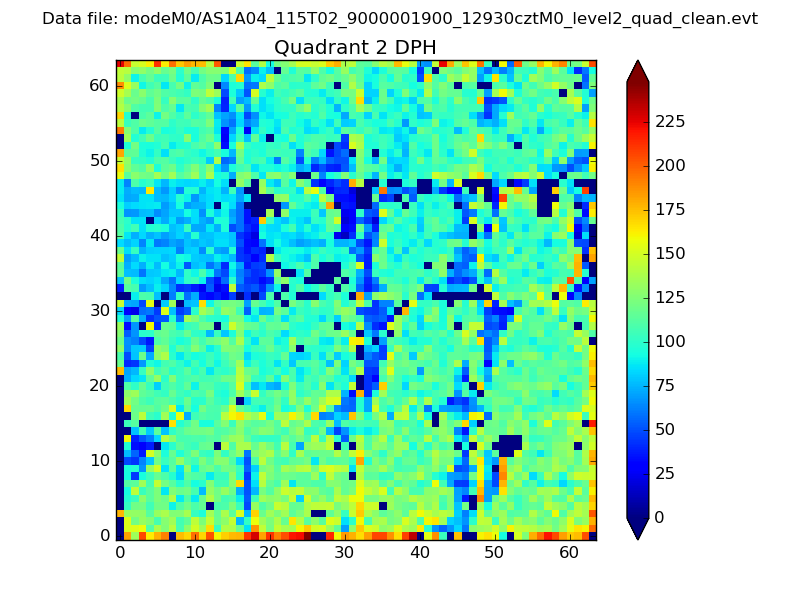
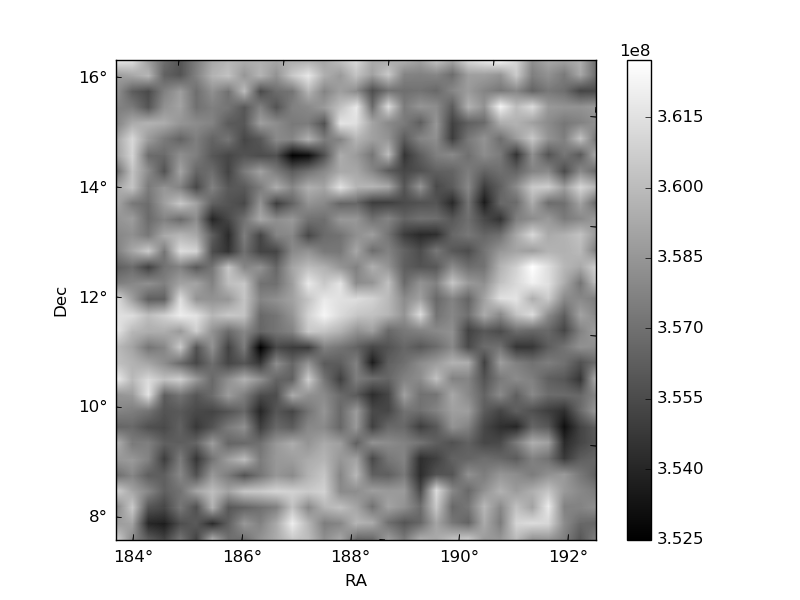
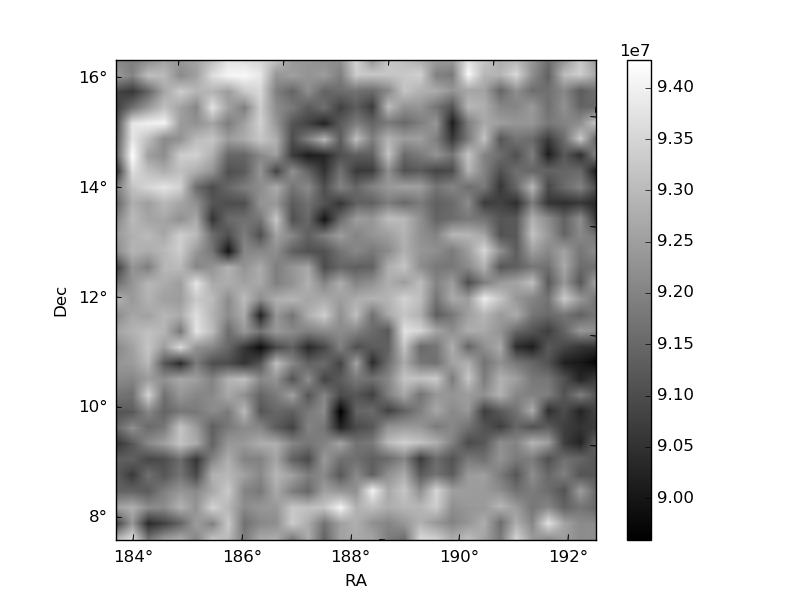
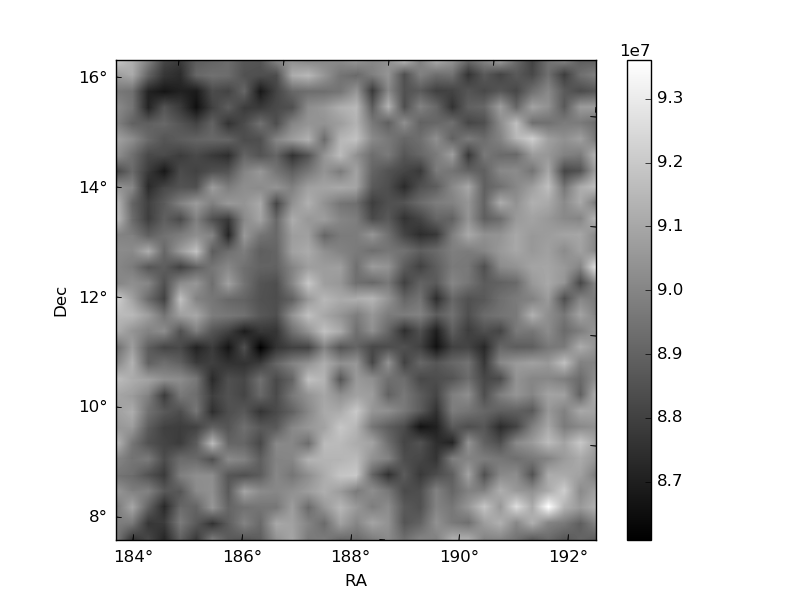
Histogram calculated using DETX and DETY for each event in the final _common_clean file
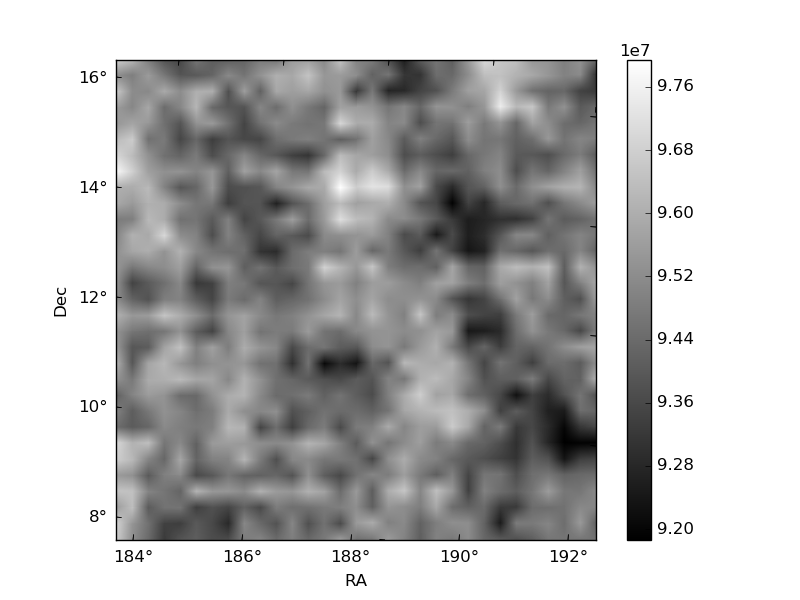
| Quadrant A | 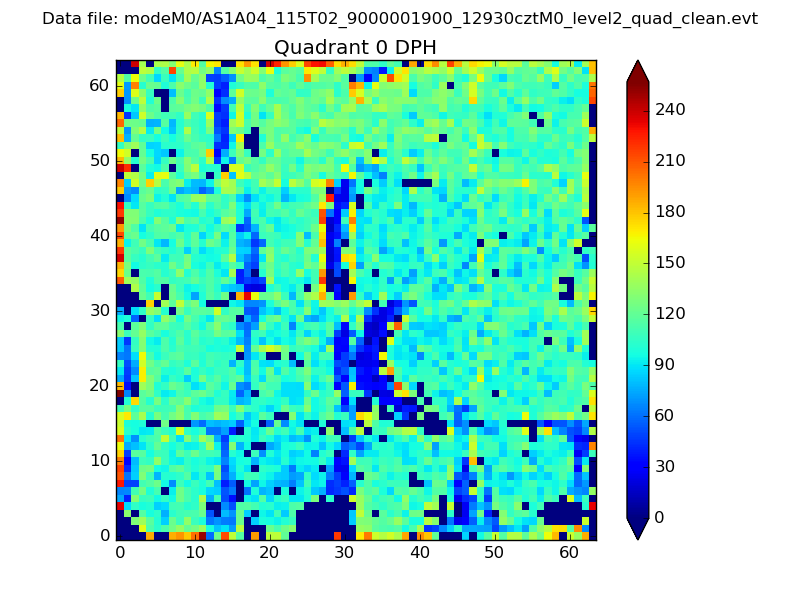 |
 |
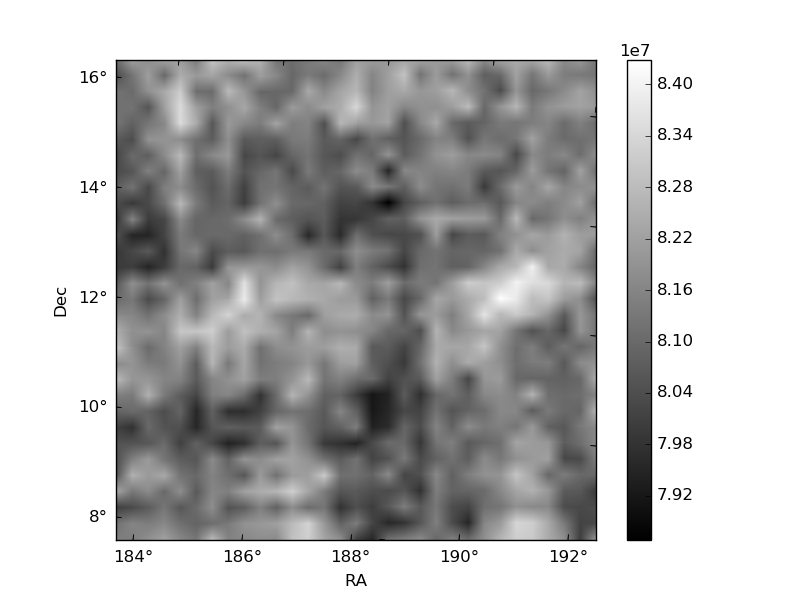
Quadrant B |
|---|---|---|---|
| Quadrant D | 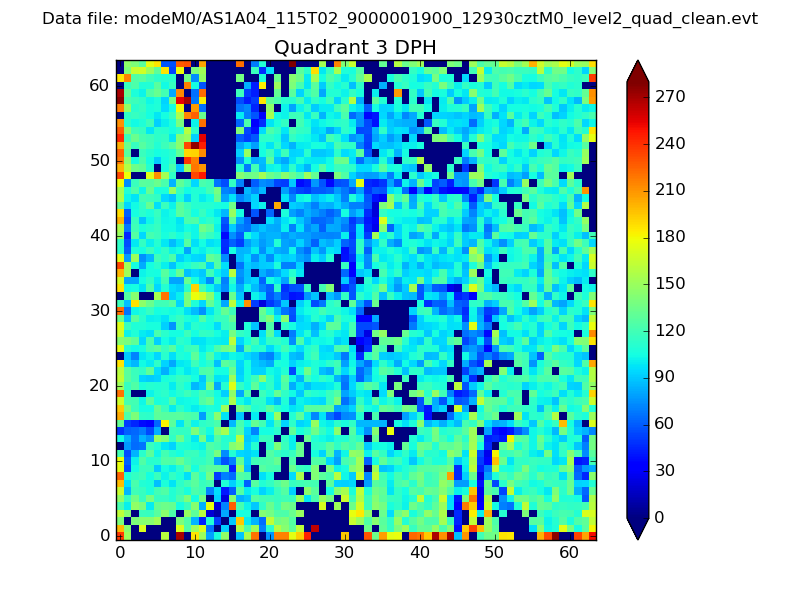 |
 |
Quadrant C |
| Plot type | Count rate plots | Images |
|---|---|---|
| Comparison with Poisson distribution Blue bars denote a histogram of data divided into 1 sec bins. Red curve is a Poisson curve with rate = median count rate of data. |
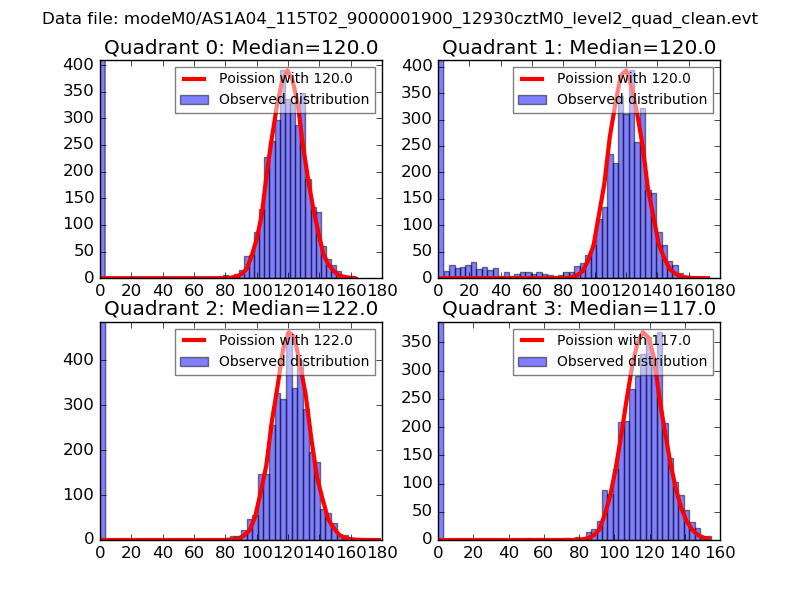 |
 |
| Quadrant-wise count rates Data is divided into 100 sec bins |
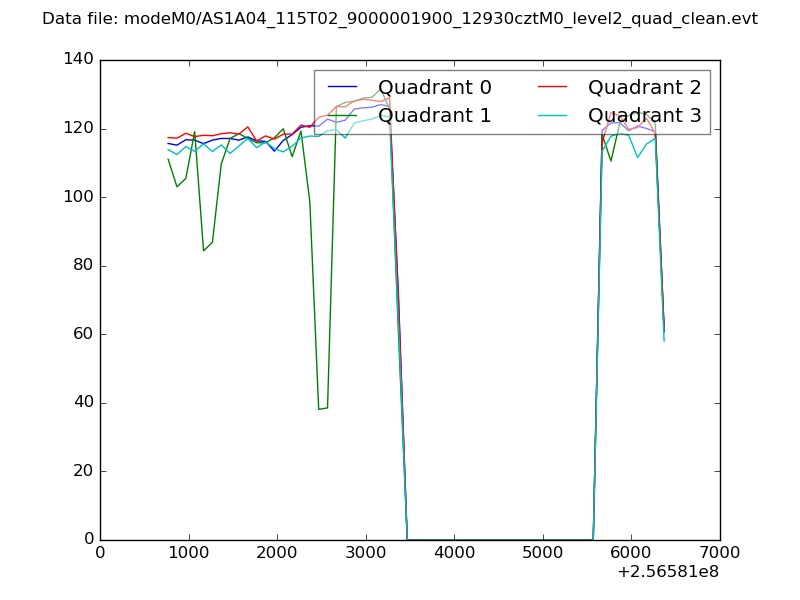 |
|
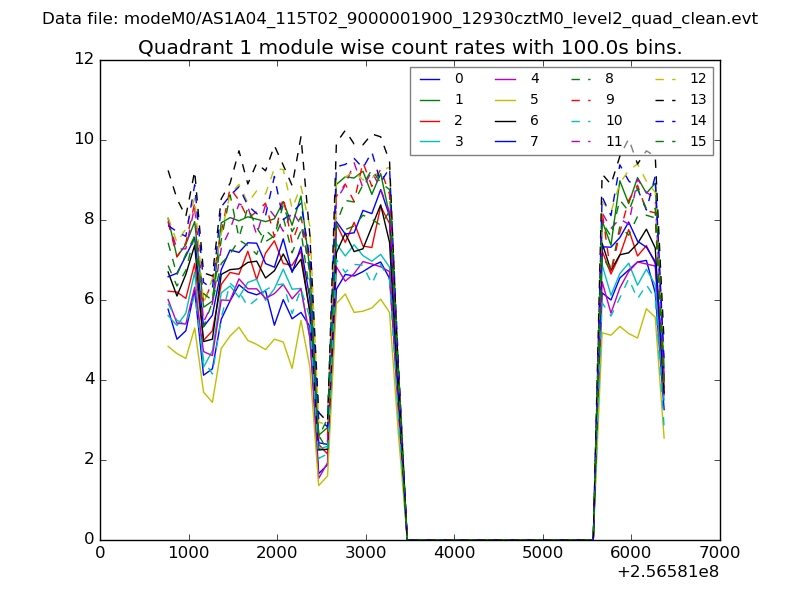
| Module-wise count rates for Quadrant A Data is divided into 100 sec bins |
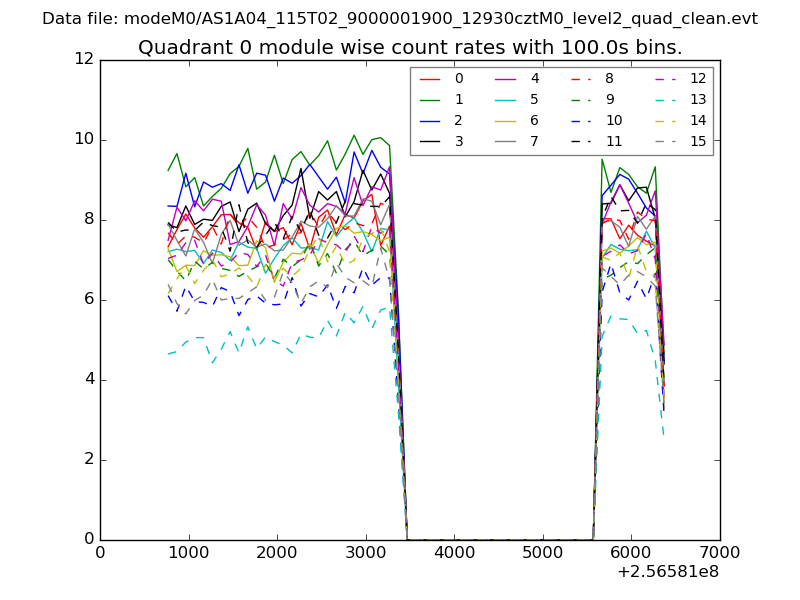 |
 |
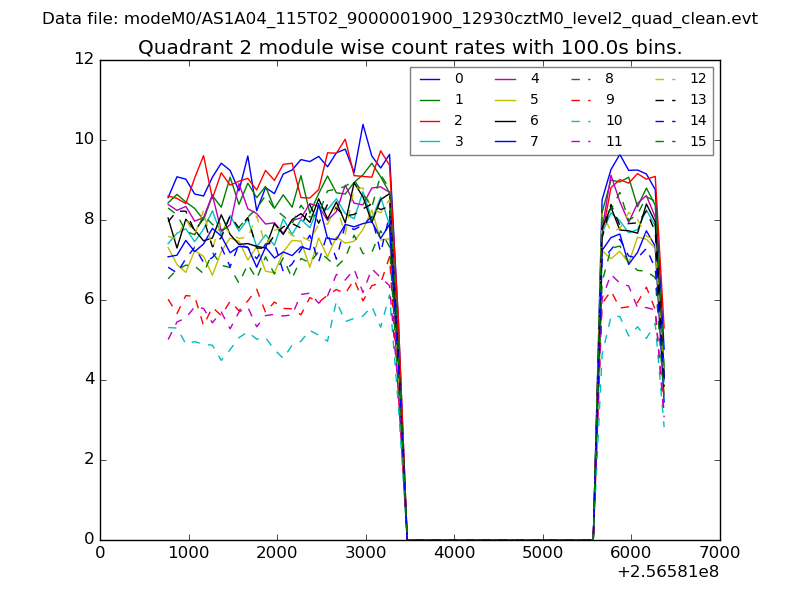
| Module-wise count rates for Quadrant B Data is divided into 100 sec bins |
 |
 |
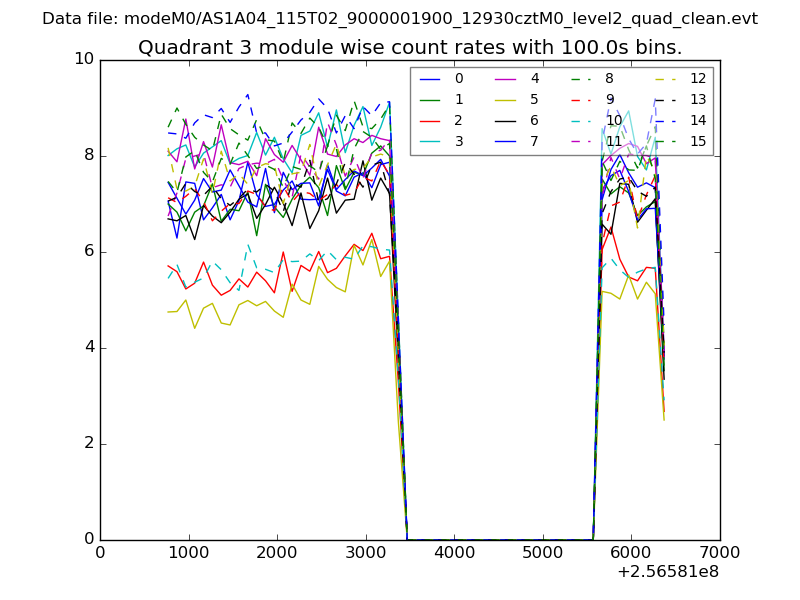
| Module-wise count rates for Quadrant C Data is divided into 100 sec bins |
 |
 |
| Module-wise count rates for Quadrant D Data is divided into 100 sec bins |
 |
 |
| Parameter | Plot |
|---|---|
| CZT HV Monitor | 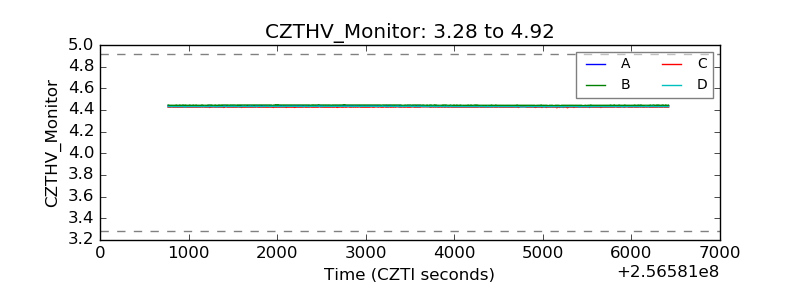 |
| D_VDD | 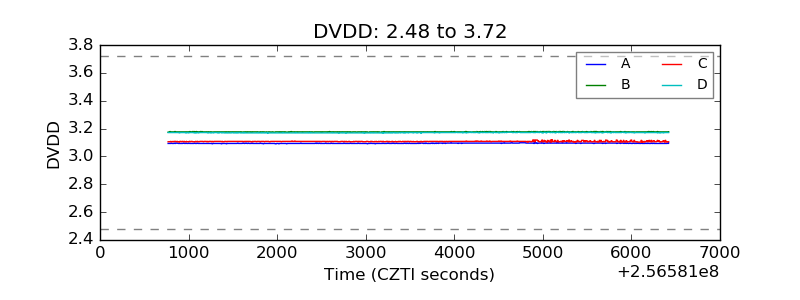 |
| Temperature 1 | 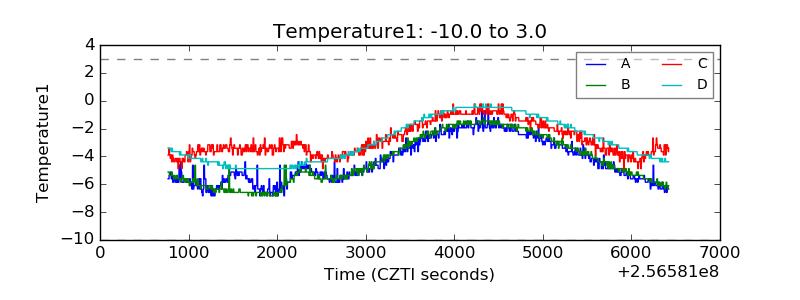 |
| Veto HV Monitor | 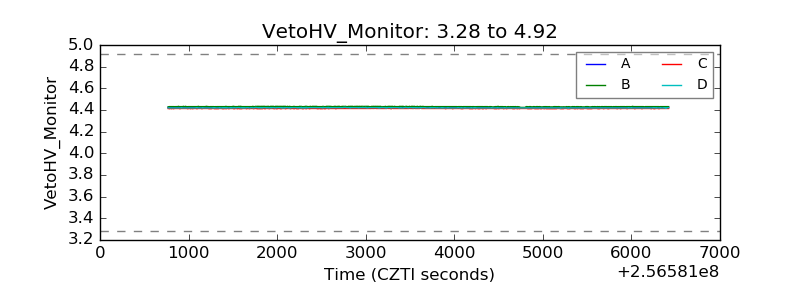 |
| Veto LLD | 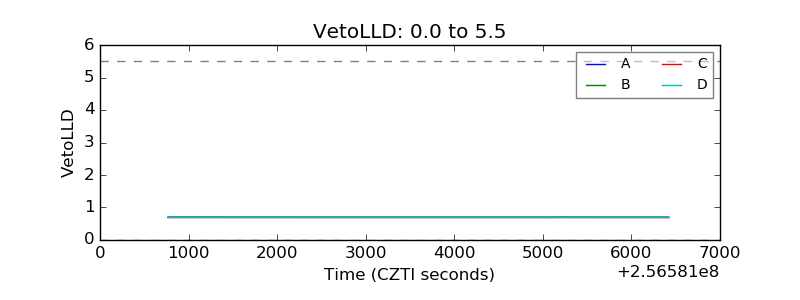 |
| Alpha Counter | 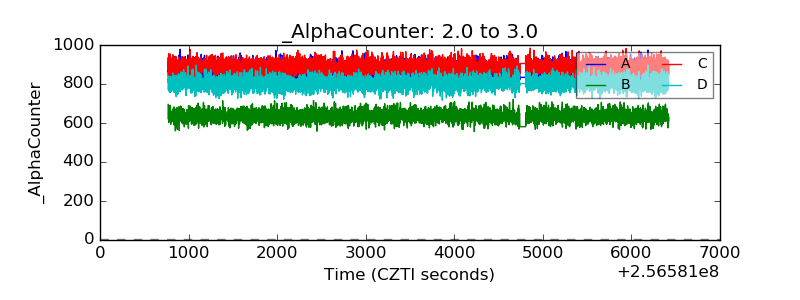 |
| _CPM_Rate | 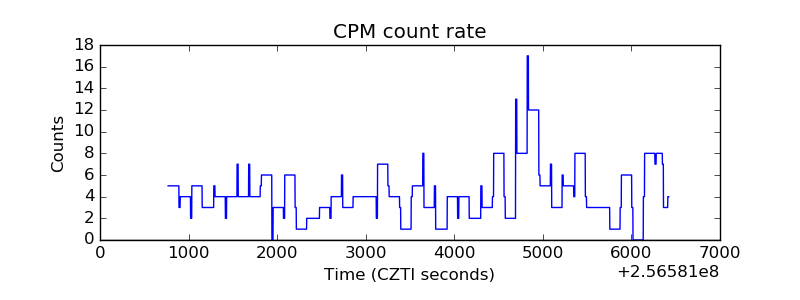 |
| CZT Counter | 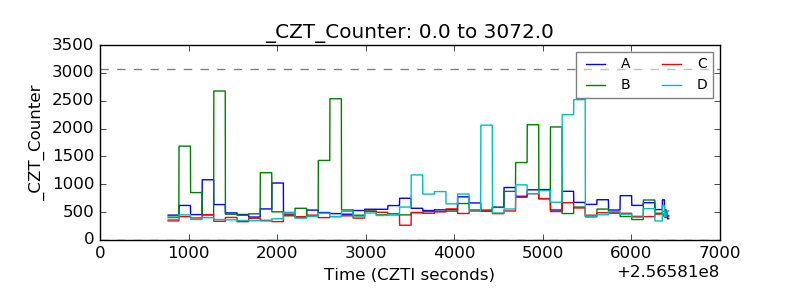 |
| +2.5 Volts monitor | 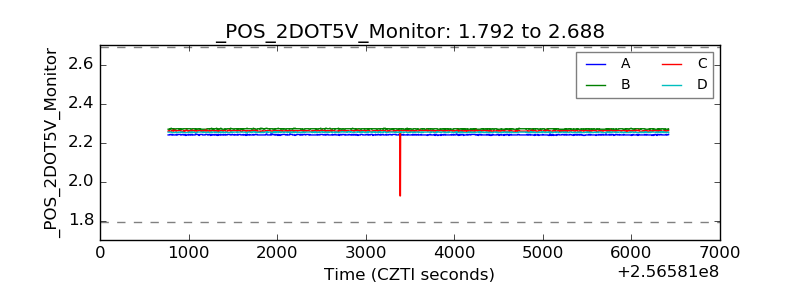 |
| +5 Volts monitor |  |
| _ROLL_ROT | 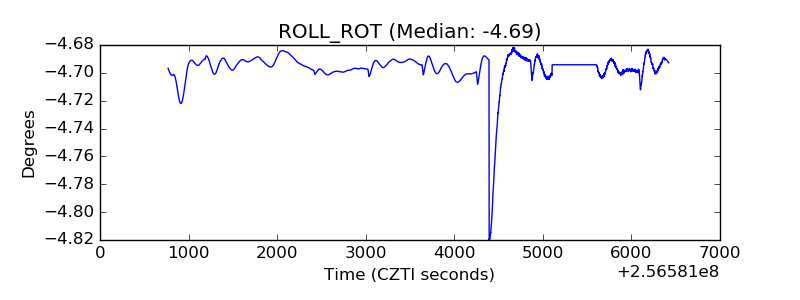 |
| _Roll_DEC | 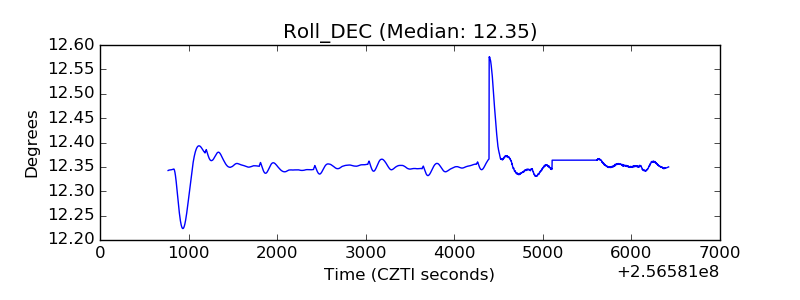 |
| _Roll_RA | 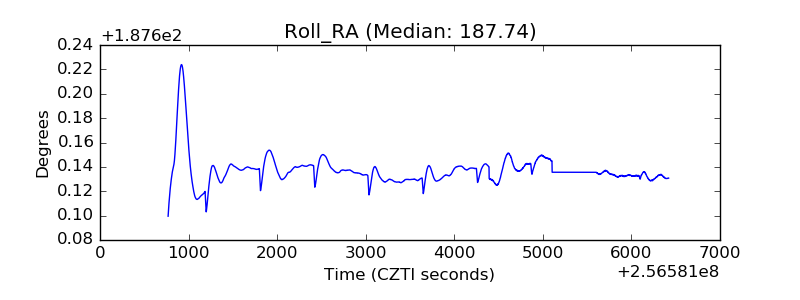 |
| Veto Counter | 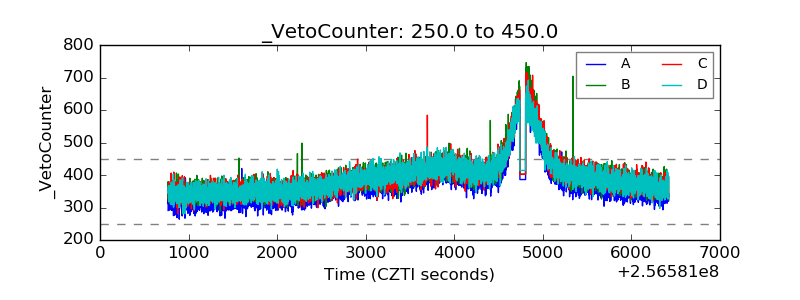 |