| Param | Original file | Final file |
|---|---|---|
| Filename | modeM0/AS1A04_115T02_9000001900_12935cztM0_level2.evt | modeM0/AS1A04_115T02_9000001900_12935cztM0_level2_quad_clean.evt |
| Size (bytes) | 970,476,480 | 154,699,200 |
| Size | 925.5 MB | 147.5 MB |
| Events in quadrant A | 6,383,953 | 964,967 |
| Events in quadrant B | 8,272,549 | 958,625 |
| Events in quadrant C | 5,747,741 | 976,723 |
| Events in quadrant D | 8,135,881 | 914,822 |
| Mode SS | |||
|---|---|---|---|
| Quadrant | BADHDUFLAG | Total packets | Discarded packets |
| A | 0 | 260 | 0 |
| B | 0 | 260 | 0 |
| C | 0 | 260 | 0 |
| D | 0 | 260 | 0 |
| Mode M9 | |||
|---|---|---|---|
| Quadrant | BADHDUFLAG | Total packets | Discarded packets |
| A | 0 | 24 | 0 |
| B | 0 | 24 | 0 |
| C | 0 | 24 | 0 |
| D | 0 | 24 | 0 |
| Mode M0 | |||
|---|---|---|---|
| Quadrant | BADHDUFLAG | Total packets | Discarded packets |
| A | 0 | 26929 | 4 |
| B | 0 | 32862 | 3 |
| C | 0 | 25664 | 3 |
| D | 0 | 32724 | 3 |
| Quadrant | Total seconds | Saturated seconds | Saturation percentage |
|---|---|---|---|
| A | 12574 | 139 | 1.105456% |
| B | 12574 | 724 | 5.757913% |
| C | 12574 | 77 | 0.612375% |
| D | 12574 | 564 | 4.485446% |
Noise dominated data is calculated using 1-second bins in cleaned event files. If a bin has >2000 counts, and if more than 50% of those come from <1% of pixels, then it is considered to be noise-dominated and hence unusable.
| Quadrant | # 1 sec bins | Bins with >0 counts | Bins with >2000 counts | High rate bins dominated by noise | Noise dominated (total time) | Noise dominated (detector-on time) | Marked lightcurve |
|---|---|---|---|---|---|---|---|
| A | 15115 | 12577 | 0 | 0 | 0.00% | 0.00% | 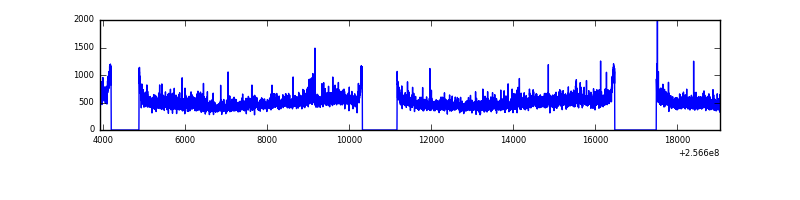 |
| B | 15115 | 12577 | 384 | 384 | 2.54% | 3.05% | 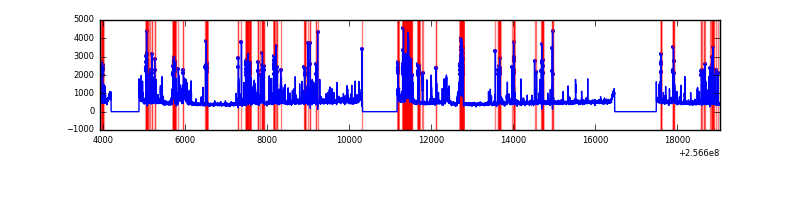 |
| C | 15115 | 12577 | 0 | 0 | 0.00% | 0.00% | 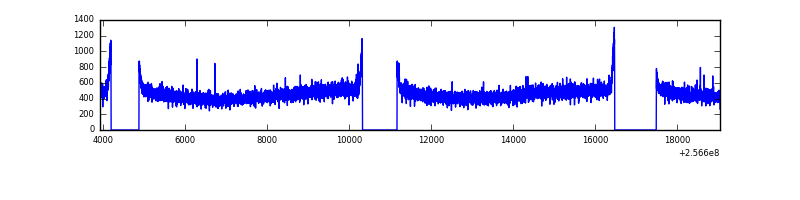 |
| D | 15115 | 12577 | 430 | 430 | 2.84% | 3.42% | 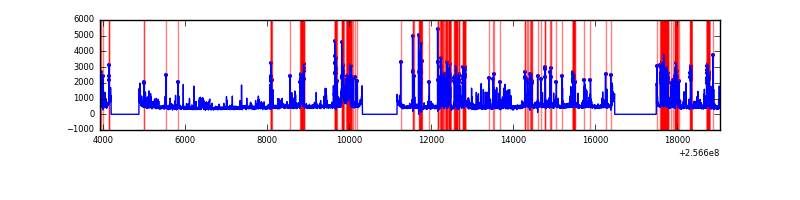 |
Top three noisy pixels from each quadrant. If the there are fewer than three noisy pixels in the level2.evt file, extra rows are filled as -1
| Pixel properties | Quadrant properties | ||||||
|---|---|---|---|---|---|---|---|
| Quadrant | DetID | PixID | Counts | Sigma | Mean | Median | Sigma |
| A | 1 | 162 | 195835 | 638.46 | 1509 | 1479 | 304.4 |
| A | 1 | 178 | 98638 | 319.17 | 1509 | 1479 | 304.4 |
| A | 1 | 161 | 84216 | 271.79 | 1509 | 1479 | 304.4 |
| B | 3 | 64 | 2006718 | 7055.81 | 1485 | 1446 | 284.2 |
| B | 4 | 239 | 366857 | 1285.75 | 1485 | 1446 | 284.2 |
| B | 12 | 111 | 33328 | 112.18 | 1485 | 1446 | 284.2 |
| C | 4 | 112 | 14445 | 38.08 | 1465 | 1475 | 340.6 |
| C | 8 | 128 | 12131 | 31.28 | 1465 | 1475 | 340.6 |
| C | 13 | 61 | 10787 | 27.34 | 1465 | 1475 | 340.6 |
| D | 1 | 52 | 2563992 | 7428.59 | 1438 | 1399 | 345.0 |
| D | 2 | 234 | 40745 | 114.06 | 1438 | 1399 | 345.0 |
| D | 8 | 195 | 31065 | 86.0 | 1438 | 1399 | 345.0 |
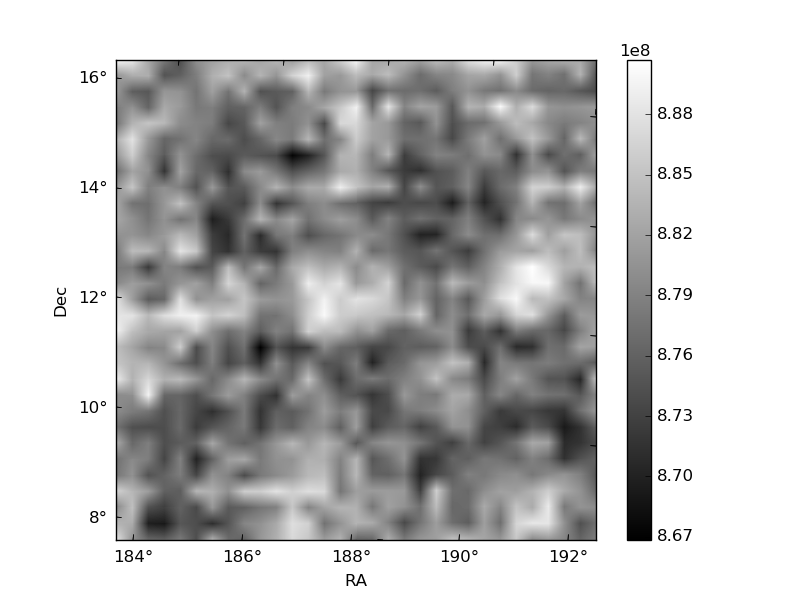
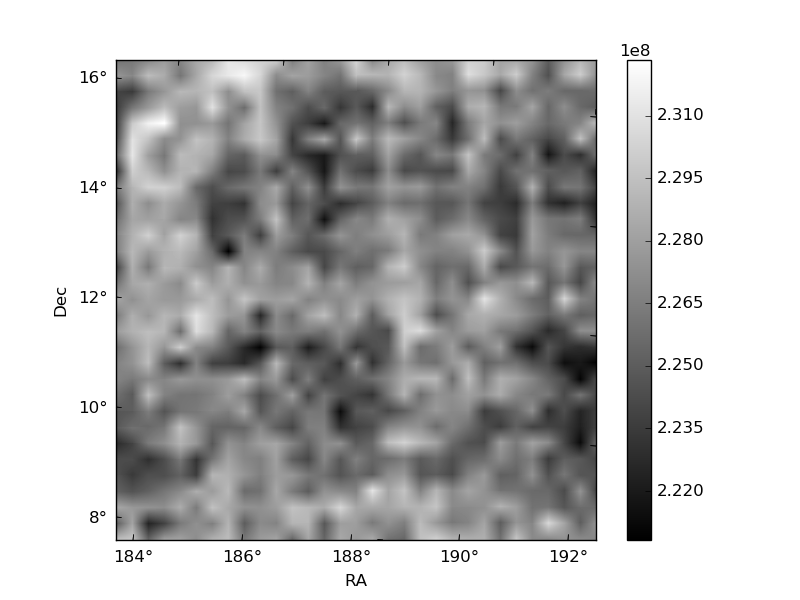
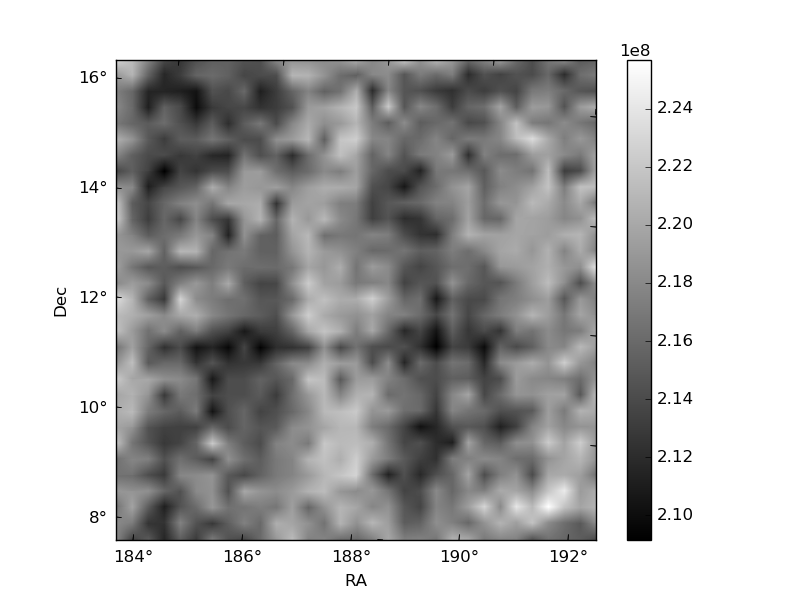
Histogram calculated using DETX and DETY for each event in the final _common_clean file
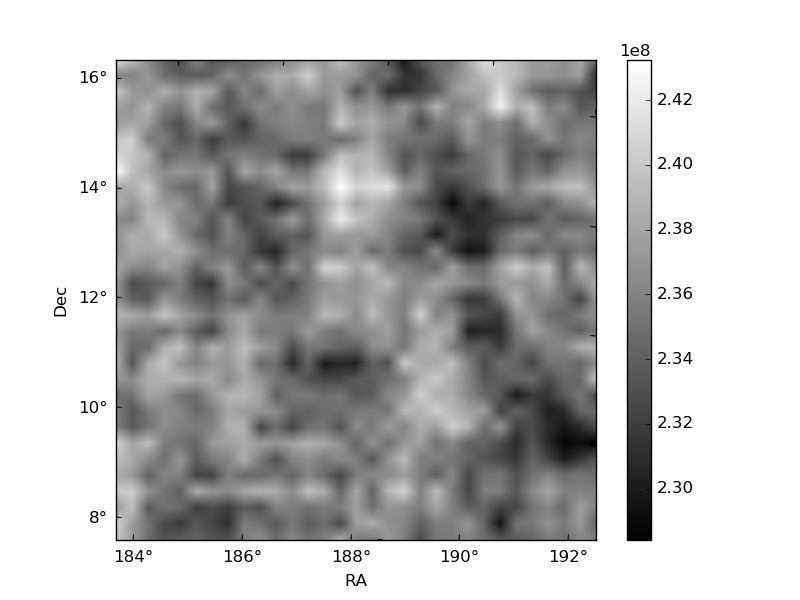
| Quadrant A | 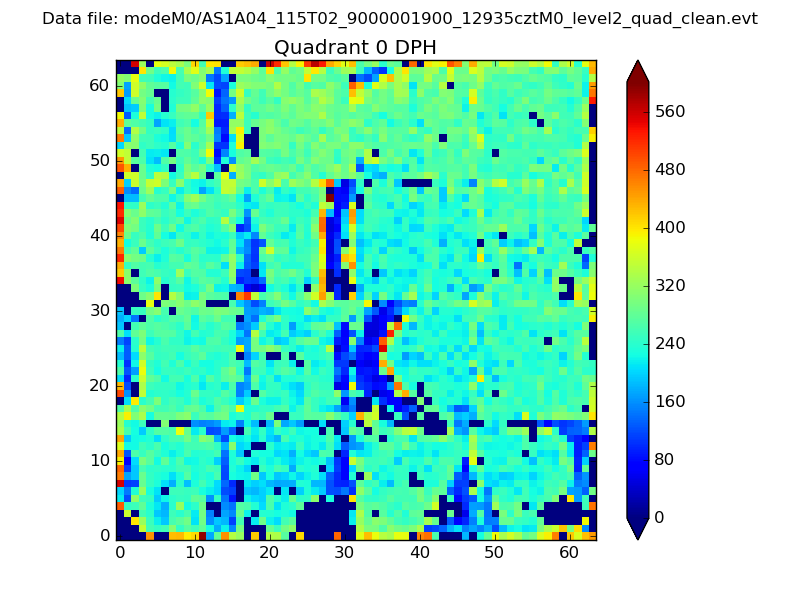 |
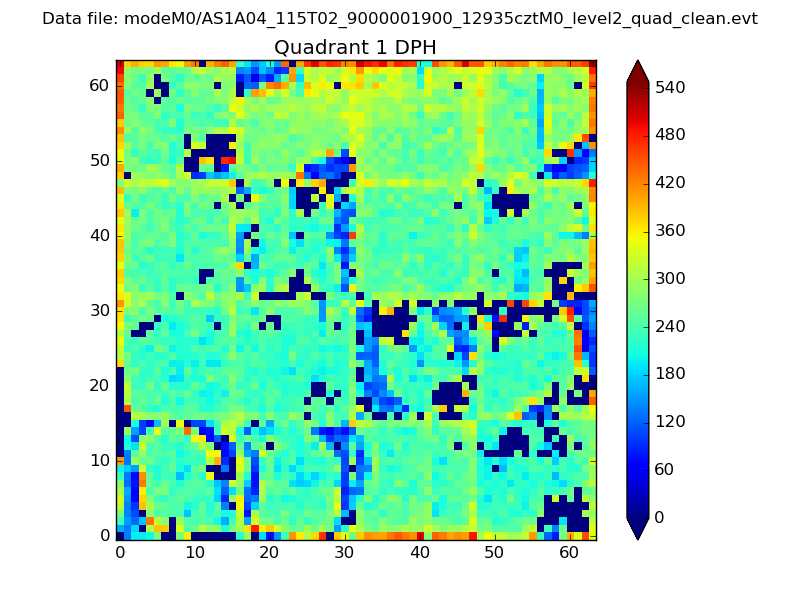 |
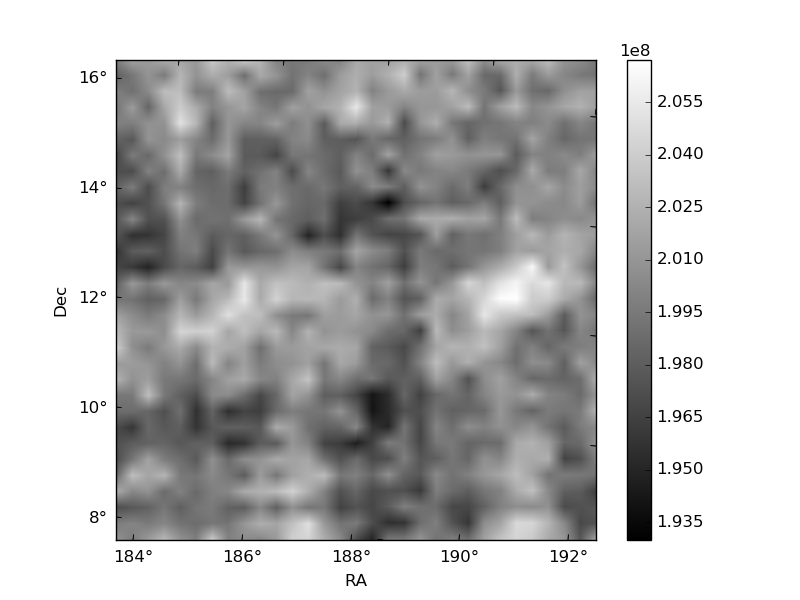
Quadrant B |
|---|---|---|---|
| Quadrant D | 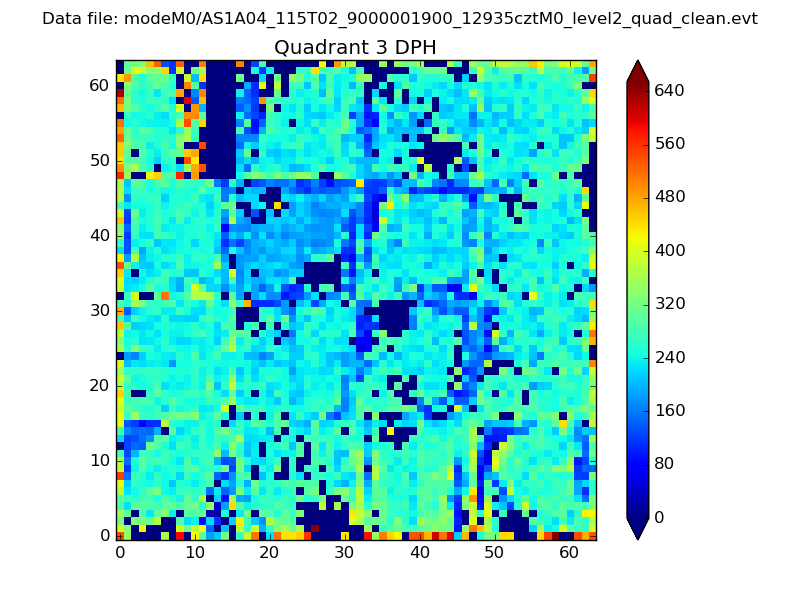 |
 |
Quadrant C |
| Plot type | Count rate plots | Images |
|---|---|---|
| Comparison with Poisson distribution Blue bars denote a histogram of data divided into 1 sec bins. Red curve is a Poisson curve with rate = median count rate of data. |
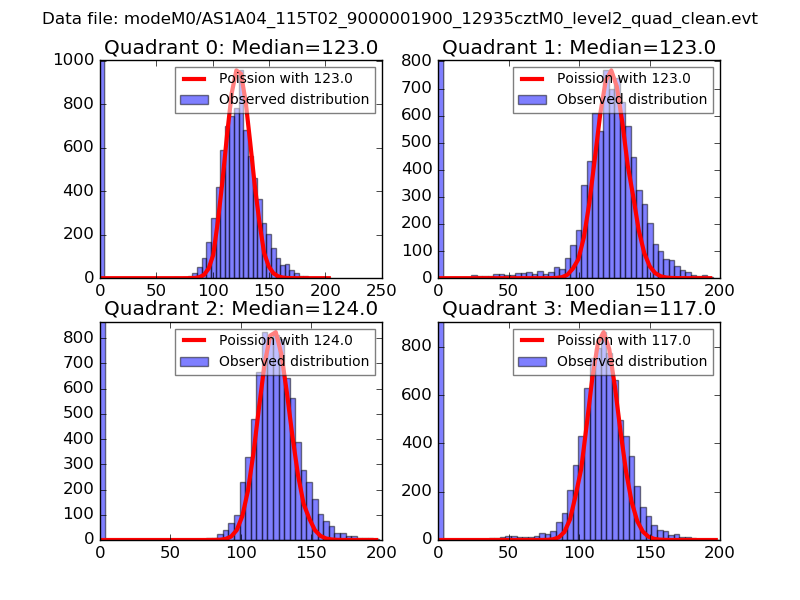 |
 |
| Quadrant-wise count rates Data is divided into 100 sec bins |
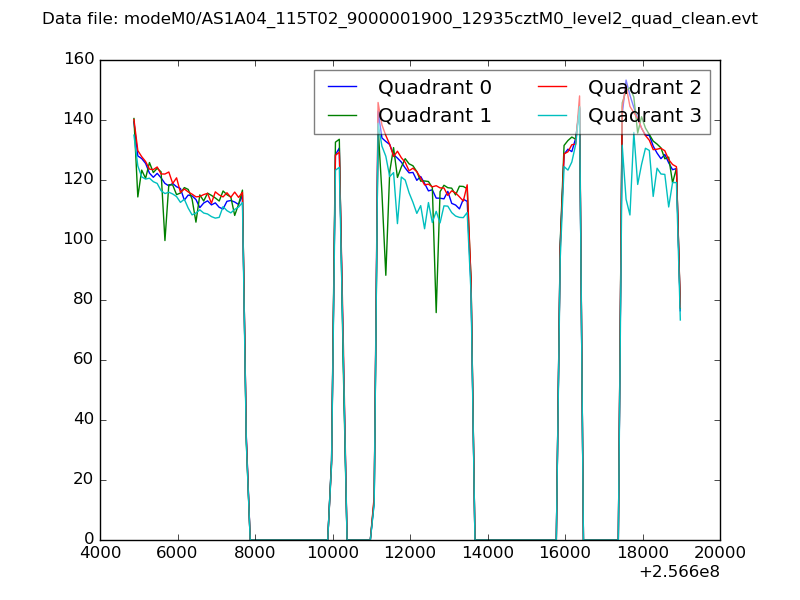 |
|
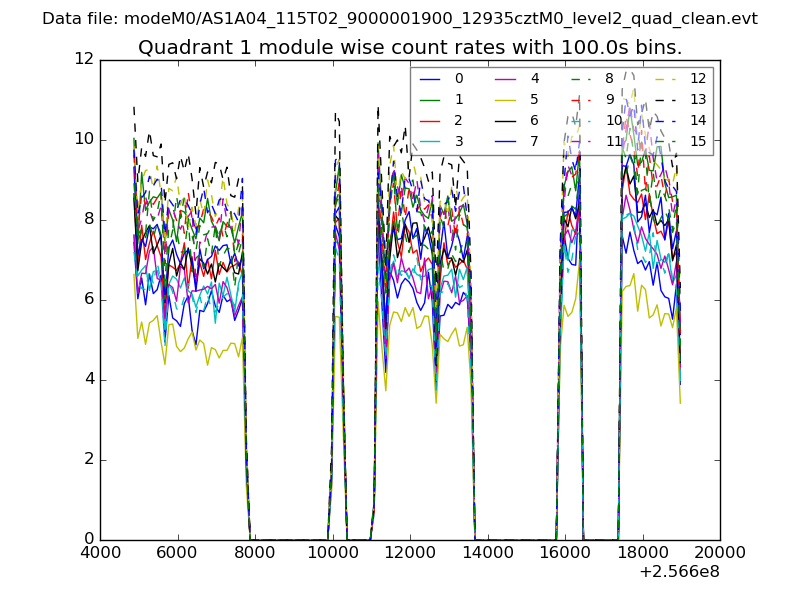
| Module-wise count rates for Quadrant A Data is divided into 100 sec bins |
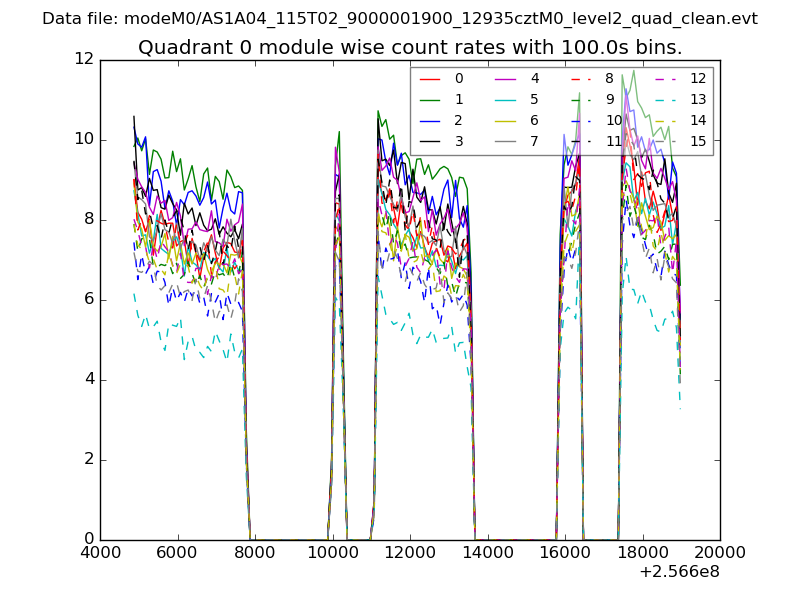 |
 |
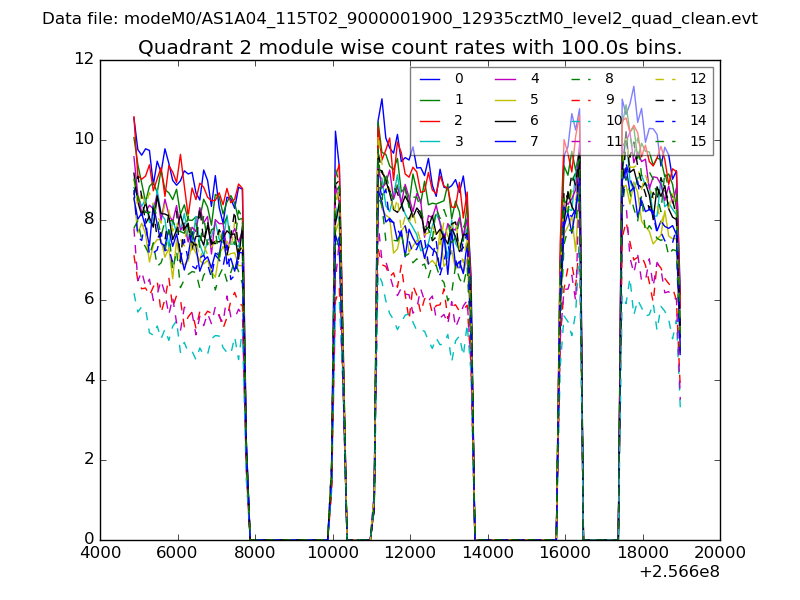
| Module-wise count rates for Quadrant B Data is divided into 100 sec bins |
 |
 |
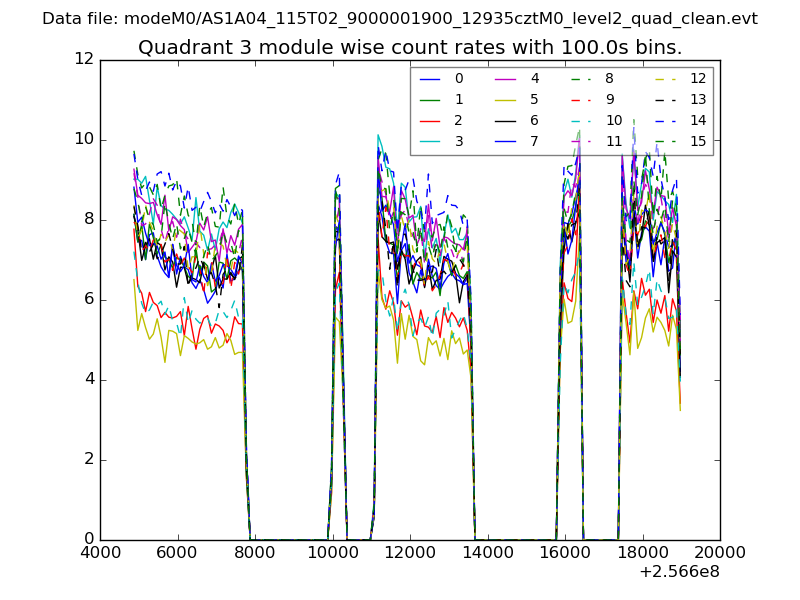
| Module-wise count rates for Quadrant C Data is divided into 100 sec bins |
 |
 |
| Module-wise count rates for Quadrant D Data is divided into 100 sec bins |
 |
 |
| Parameter | Plot |
|---|---|
| CZT HV Monitor | 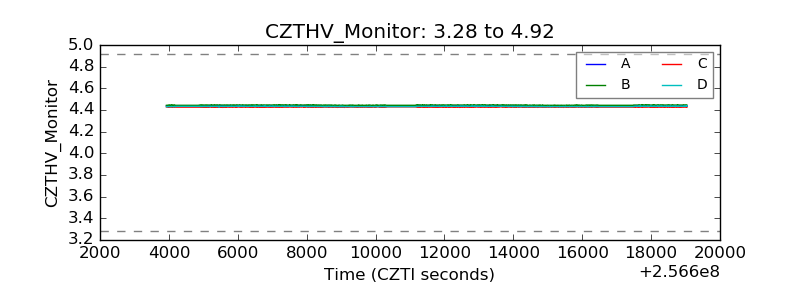 |
| D_VDD | 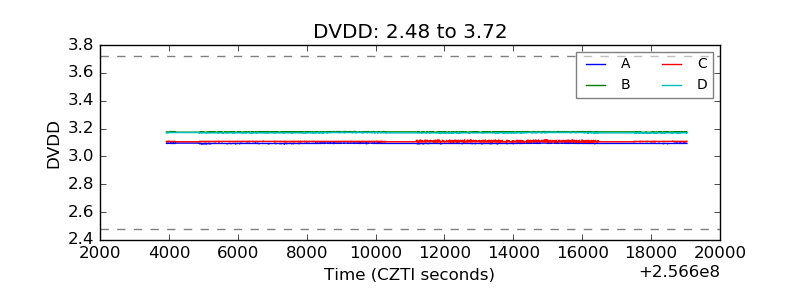 |
| Temperature 1 | 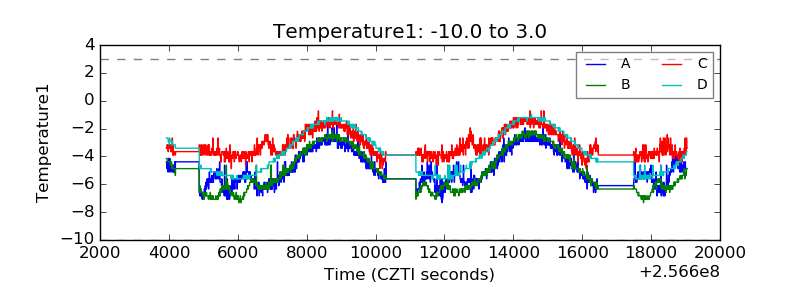 |
| Veto HV Monitor | 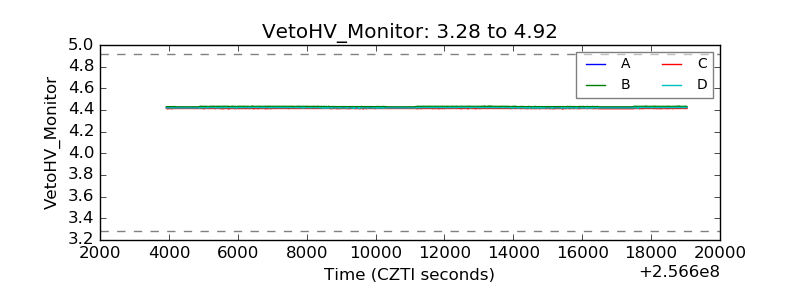 |
| Veto LLD | 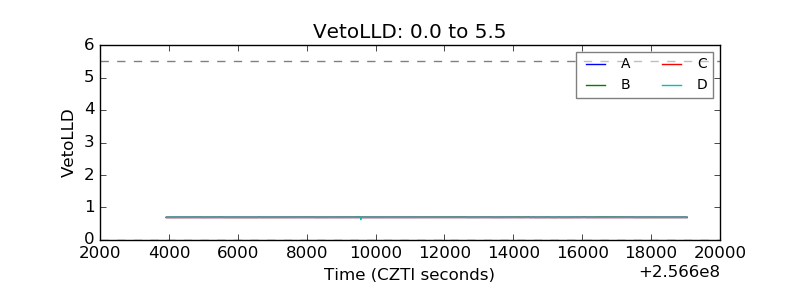 |
| Alpha Counter | 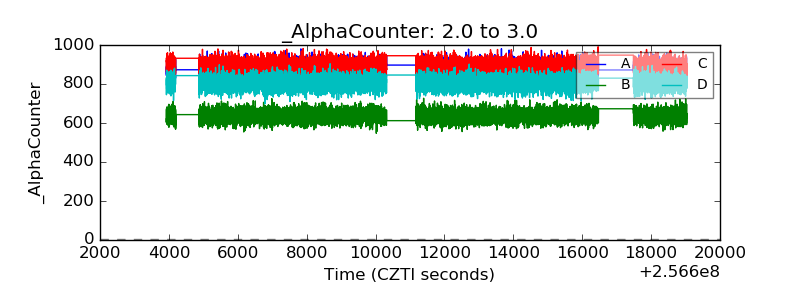 |
| _CPM_Rate | 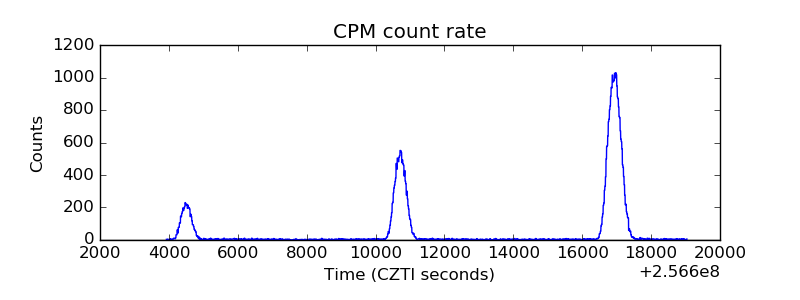 |
| CZT Counter | 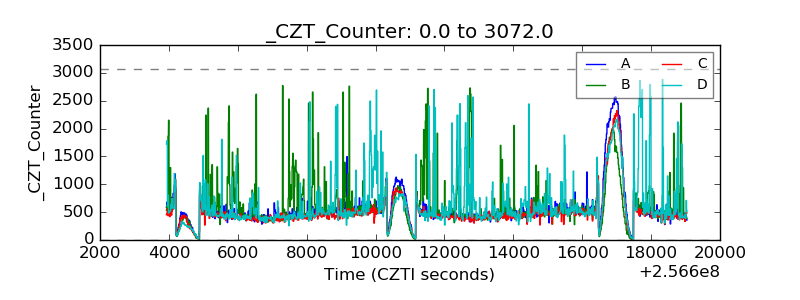 |
| +2.5 Volts monitor |  |
| +5 Volts monitor |  |
| _ROLL_ROT | 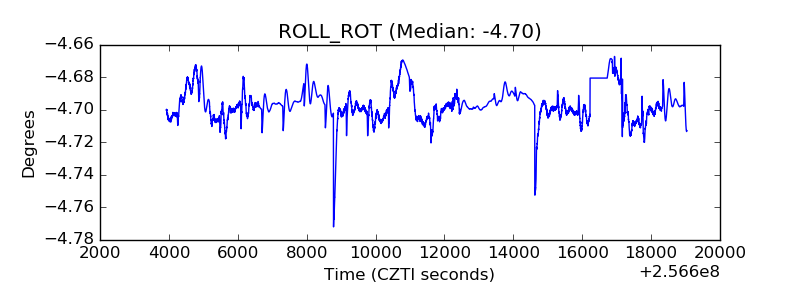 |
| _Roll_DEC | 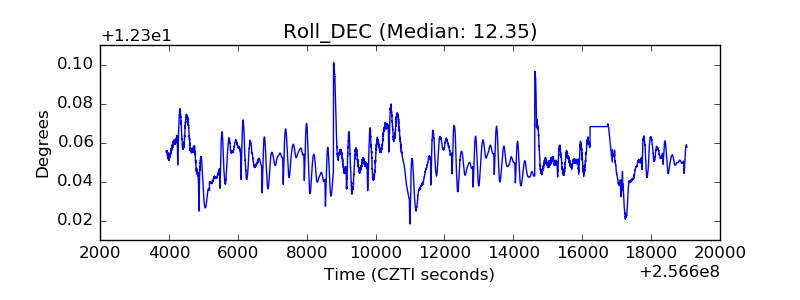 |
| _Roll_RA | 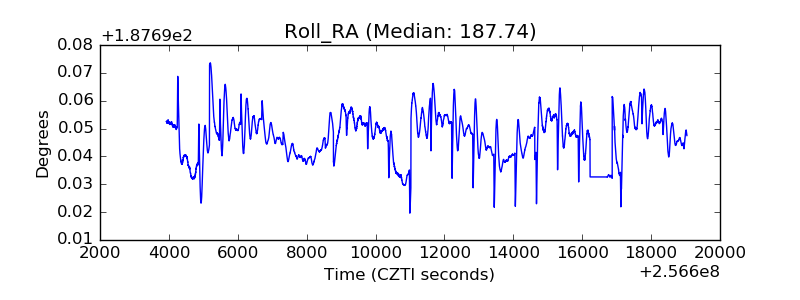 |
| Veto Counter | 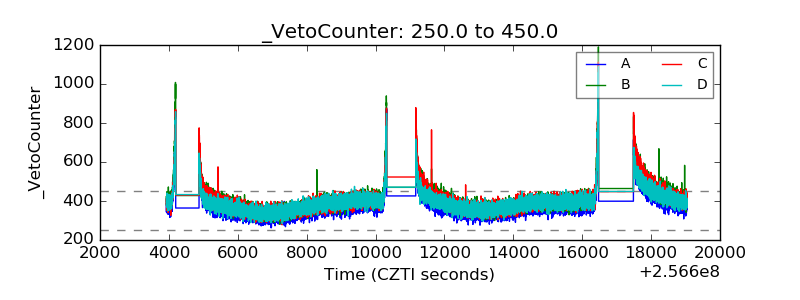 |