| Param | Original file | Final file |
|---|---|---|
| Filename | modeM0/AS1A04_115T02_9000001900_12937cztM0_level2.evt | modeM0/AS1A04_115T02_9000001900_12937cztM0_level2_quad_clean.evt |
| Size (bytes) | 527,451,840 | 90,391,680 |
| Size | 503.0 MB | 86.2 MB |
| Events in quadrant A | 3,330,946 | 581,502 |
| Events in quadrant B | 4,097,609 | 574,477 |
| Events in quadrant C | 3,014,249 | 583,259 |
| Events in quadrant D | 5,092,009 | 546,602 |
| Mode SS | |||
|---|---|---|---|
| Quadrant | BADHDUFLAG | Total packets | Discarded packets |
| A | 0 | 132 | 0 |
| B | 0 | 132 | 0 |
| C | 0 | 132 | 0 |
| D | 0 | 132 | 0 |
| Mode M9 | |||
|---|---|---|---|
| Quadrant | BADHDUFLAG | Total packets | Discarded packets |
| A | 0 | 11 | 0 |
| B | 0 | 11 | 0 |
| C | 0 | 11 | 0 |
| D | 0 | 11 | 0 |
| Mode M0 | |||
|---|---|---|---|
| Quadrant | BADHDUFLAG | Total packets | Discarded packets |
| A | 0 | 13793 | 2 |
| B | 0 | 16240 | 1 |
| C | 0 | 13135 | 1 |
| D | 0 | 19370 | 1 |
| Quadrant | Total seconds | Saturated seconds | Saturation percentage |
|---|---|---|---|
| A | 6467 | 38 | 0.587599% |
| B | 6467 | 309 | 4.778104% |
| C | 6467 | 14 | 0.216484% |
| D | 6467 | 691 | 10.685016% |
Noise dominated data is calculated using 1-second bins in cleaned event files. If a bin has >2000 counts, and if more than 50% of those come from <1% of pixels, then it is considered to be noise-dominated and hence unusable.
| Quadrant | # 1 sec bins | Bins with >0 counts | Bins with >2000 counts | High rate bins dominated by noise | Noise dominated (total time) | Noise dominated (detector-on time) | Marked lightcurve |
|---|---|---|---|---|---|---|---|
| A | 7638 | 6469 | 5 | 5 | 0.07% | 0.08% |  |
| B | 7638 | 6469 | 166 | 166 | 2.17% | 2.57% | 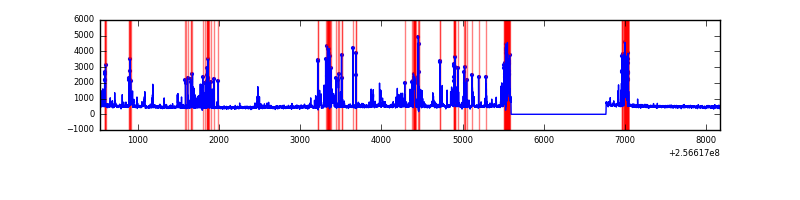 |
| C | 7638 | 6469 | 0 | 0 | 0.00% | 0.00% |  |
| D | 7638 | 6469 | 625 | 625 | 8.18% | 9.66% | 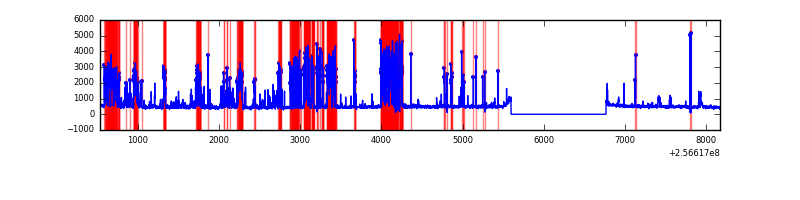 |
Top three noisy pixels from each quadrant. If the there are fewer than three noisy pixels in the level2.evt file, extra rows are filled as -1
| Pixel properties | Quadrant properties | ||||||
|---|---|---|---|---|---|---|---|
| Quadrant | DetID | PixID | Counts | Sigma | Mean | Median | Sigma |
| A | 1 | 162 | 88212 | 542.97 | 802 | 786 | 161.0 |
| A | 1 | 178 | 41697 | 254.08 | 802 | 786 | 161.0 |
| A | 1 | 161 | 36026 | 218.86 | 802 | 786 | 161.0 |
| B | 4 | 239 | 660811 | 4467.05 | 779 | 760 | 147.8 |
| B | 3 | 64 | 254634 | 1718.15 | 779 | 760 | 147.8 |
| B | 0 | 182 | 74064 | 496.1 | 779 | 760 | 147.8 |
| C | 13 | 61 | 5481 | 26.36 | 772 | 777 | 178.5 |
| C | 8 | 222 | 2778 | 11.21 | 772 | 777 | 178.5 |
| C | 4 | 112 | 2181 | 7.87 | 772 | 777 | 178.5 |
| D | 1 | 52 | 2202747 | 12465.97 | 733 | 714 | 176.6 |
| D | 2 | 14 | 80784 | 453.29 | 733 | 714 | 176.6 |
| D | 8 | 195 | 24320 | 133.64 | 733 | 714 | 176.6 |
Histogram calculated using DETX and DETY for each event in the final _common_clean file
| Quadrant A |  |
 |
Quadrant B |
|---|---|---|---|
| Quadrant D |  |
 |
Quadrant C |
| Plot type | Count rate plots | Images |
|---|---|---|
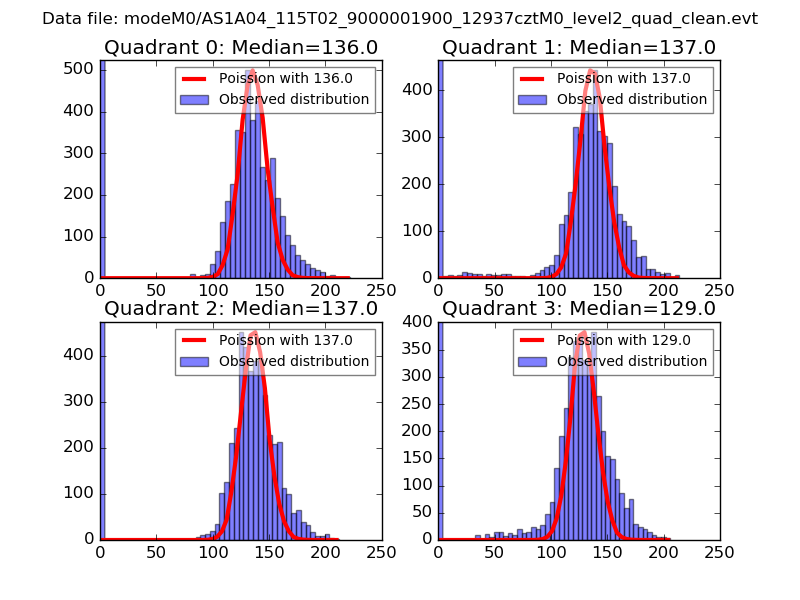
| Comparison with Poisson distribution Blue bars denote a histogram of data divided into 1 sec bins. Red curve is a Poisson curve with rate = median count rate of data. |
 |
 |
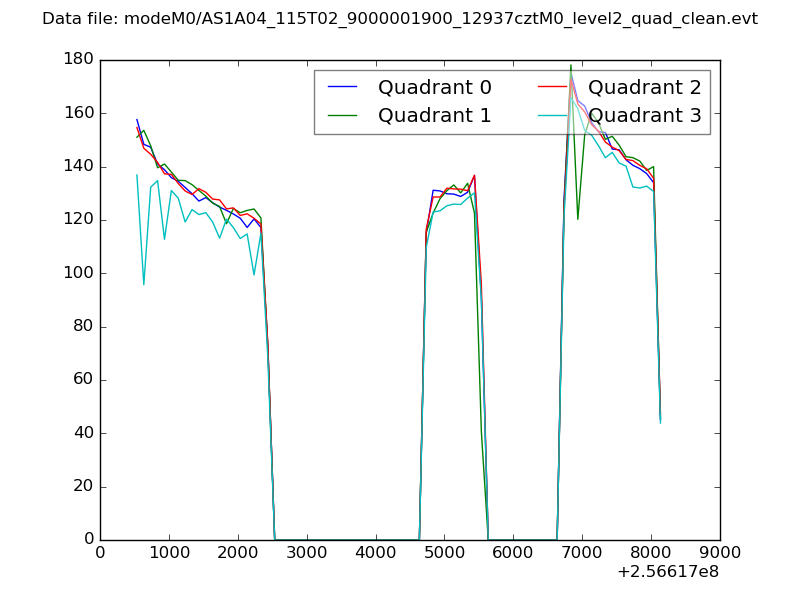
| Quadrant-wise count rates Data is divided into 100 sec bins |
 |
|
| Module-wise count rates for Quadrant A Data is divided into 100 sec bins |
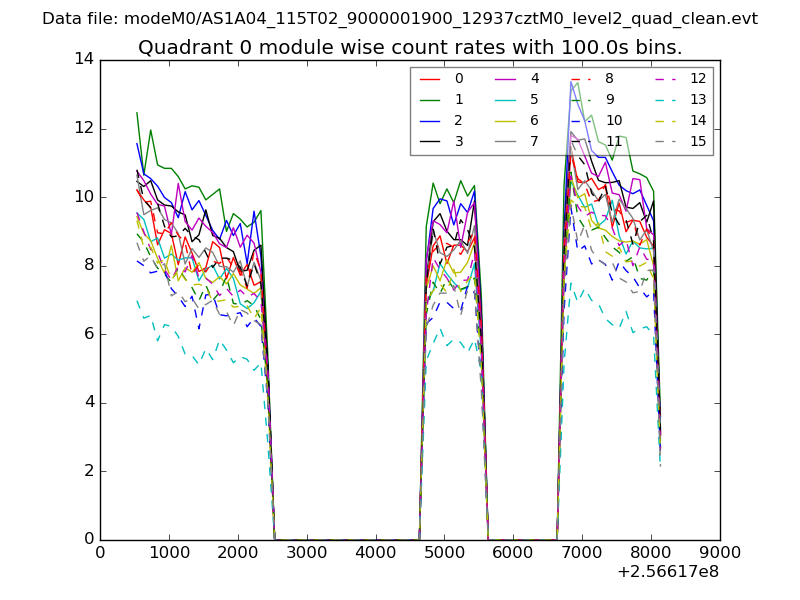 |
 |
| Module-wise count rates for Quadrant B Data is divided into 100 sec bins |
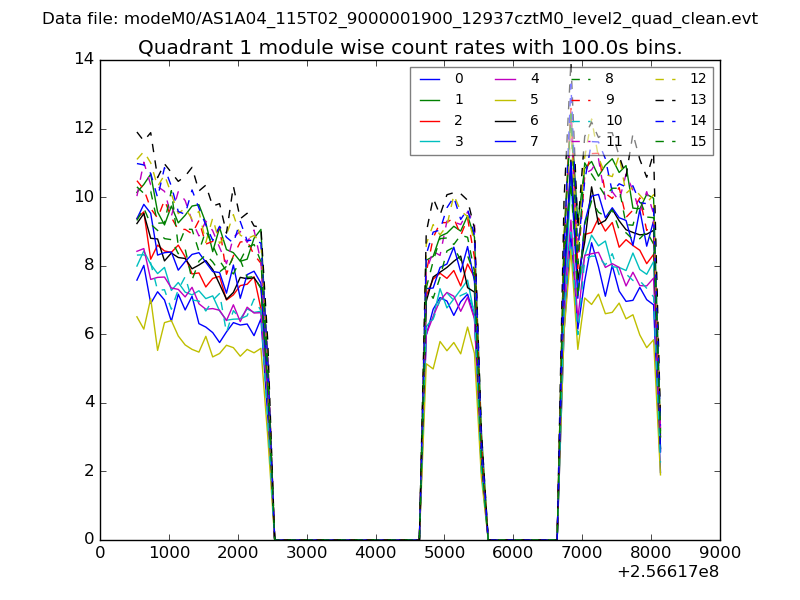 |
 |
| Module-wise count rates for Quadrant C Data is divided into 100 sec bins |
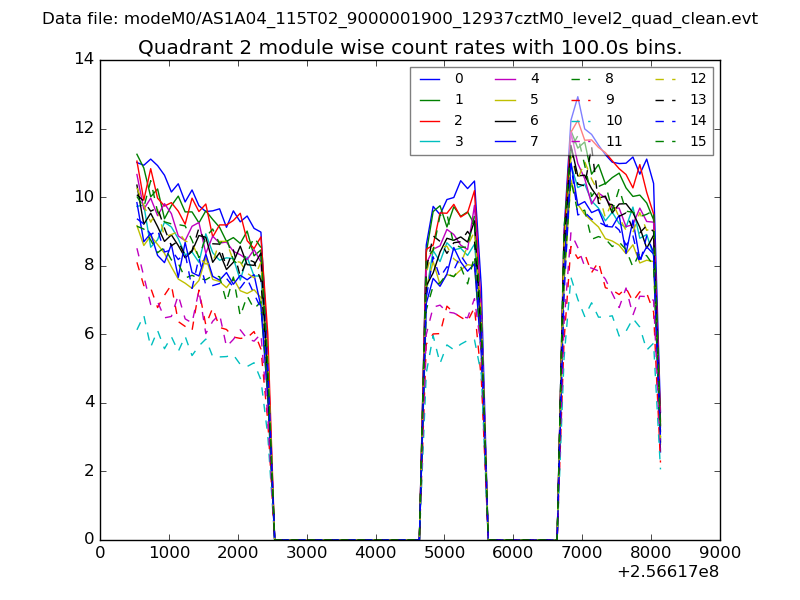 |
 |
| Module-wise count rates for Quadrant D Data is divided into 100 sec bins |
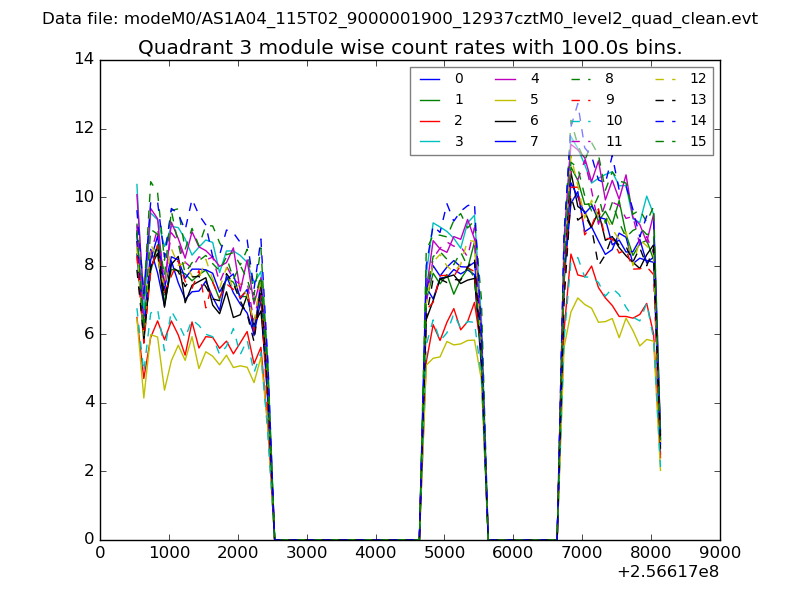 |
 |
| Parameter | Plot |
|---|---|
| CZT HV Monitor | 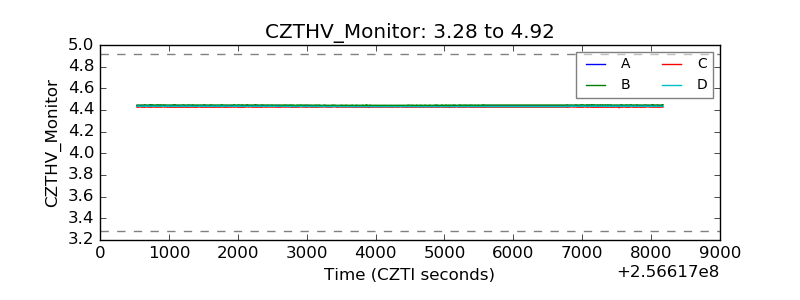 |
| D_VDD |  |
| Temperature 1 |  |
| Veto HV Monitor |  |
| Veto LLD |  |
| Alpha Counter | 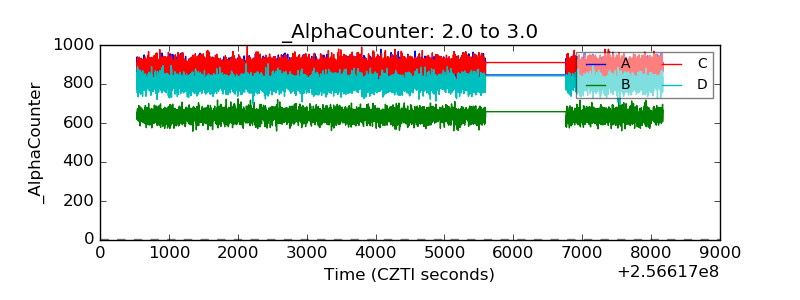 |
| _CPM_Rate | 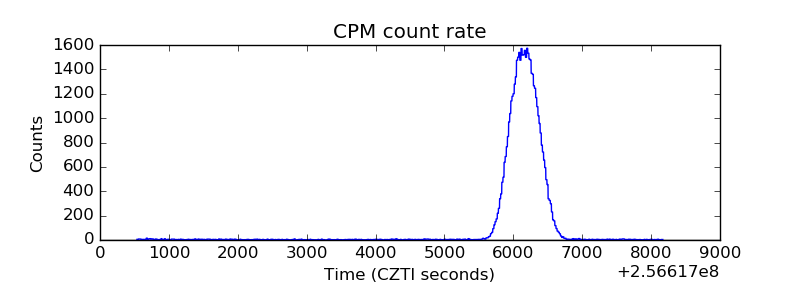 |
| CZT Counter |  |
| +2.5 Volts monitor |  |
| +5 Volts monitor |  |
| _ROLL_ROT |  |
| _Roll_DEC |  |
| _Roll_RA |  |
| Veto Counter | 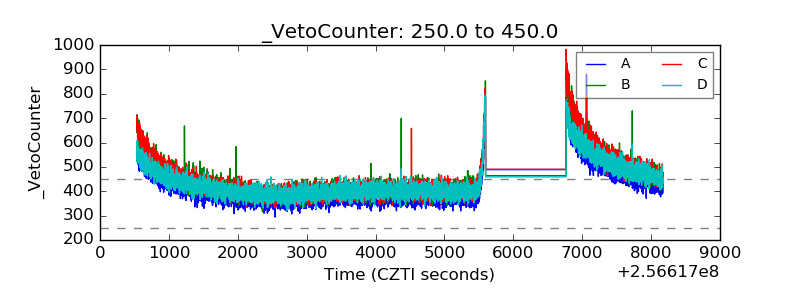 |