| Param | Original file | Final file |
|---|---|---|
| Filename | modeM0/AS1A04_115T02_9000001900_12938cztM0_level2.evt | modeM0/AS1A04_115T02_9000001900_12938cztM0_level2_quad_clean.evt |
| Size (bytes) | 481,020,480 | 88,283,520 |
| Size | 458.7 MB | 84.2 MB |
| Events in quadrant A | 3,555,290 | 569,204 |
| Events in quadrant B | 4,130,997 | 553,706 |
| Events in quadrant C | 3,044,190 | 568,949 |
| Events in quadrant D | 3,416,275 | 548,741 |
| Mode SS | |||
|---|---|---|---|
| Quadrant | BADHDUFLAG | Total packets | Discarded packets |
| A | 0 | 126 | 0 |
| B | 0 | 126 | 0 |
| C | 0 | 126 | 0 |
| D | 0 | 126 | 0 |
| Mode M9 | |||
|---|---|---|---|
| Quadrant | BADHDUFLAG | Total packets | Discarded packets |
| A | 0 | 13 | 0 |
| B | 0 | 13 | 0 |
| C | 0 | 13 | 0 |
| D | 0 | 13 | 0 |
| Mode M0 | |||
|---|---|---|---|
| Quadrant | BADHDUFLAG | Total packets | Discarded packets |
| A | 0 | 14387 | 2 |
| B | 0 | 15954 | 1 |
| C | 0 | 12760 | 1 |
| D | 0 | 13920 | 1 |
| Quadrant | Total seconds | Saturated seconds | Saturation percentage |
|---|---|---|---|
| A | 6200 | 124 | 2.000000% |
| B | 6200 | 450 | 7.258065% |
| C | 6200 | 44 | 0.709677% |
| D | 6200 | 114 | 1.838710% |
Noise dominated data is calculated using 1-second bins in cleaned event files. If a bin has >2000 counts, and if more than 50% of those come from <1% of pixels, then it is considered to be noise-dominated and hence unusable.
| Quadrant | # 1 sec bins | Bins with >0 counts | Bins with >2000 counts | High rate bins dominated by noise | Noise dominated (total time) | Noise dominated (detector-on time) | Marked lightcurve |
|---|---|---|---|---|---|---|---|
| A | 7436 | 6202 | 36 | 36 | 0.48% | 0.58% | 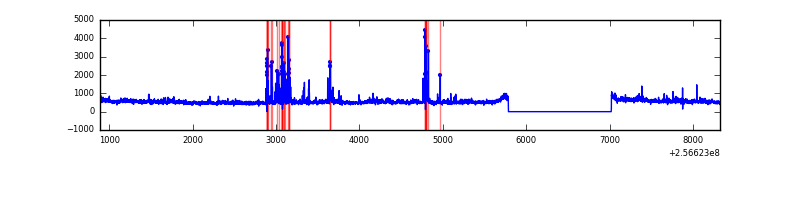 |
| B | 7435 | 6201 | 260 | 260 | 3.50% | 4.19% | 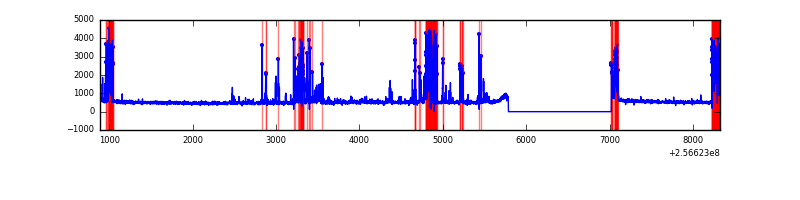 |
| C | 7436 | 6202 | 0 | 0 | 0.00% | 0.00% | 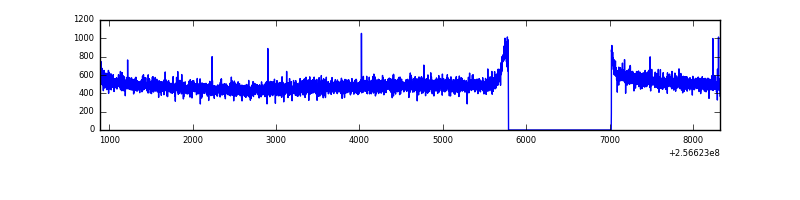 |
| D | 7436 | 6202 | 61 | 61 | 0.82% | 0.98% | 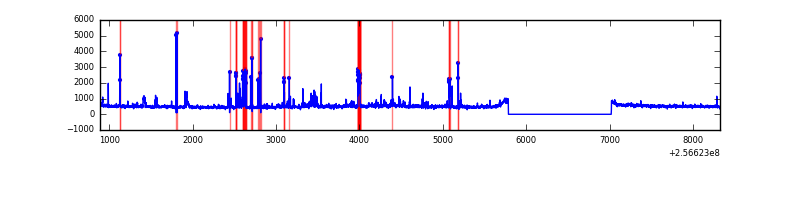 |
Top three noisy pixels from each quadrant. If the there are fewer than three noisy pixels in the level2.evt file, extra rows are filled as -1
| Pixel properties | Quadrant properties | ||||||
|---|---|---|---|---|---|---|---|
| Quadrant | DetID | PixID | Counts | Sigma | Mean | Median | Sigma |
| A | 15 | 223 | 144633 | 886.88 | 809 | 793 | 162.2 |
| A | 1 | 162 | 89113 | 544.56 | 809 | 793 | 162.2 |
| A | 15 | 239 | 85252 | 520.75 | 809 | 793 | 162.2 |
| B | 4 | 239 | 893966 | 6103.72 | 771 | 754 | 146.3 |
| B | 3 | 64 | 188644 | 1283.94 | 771 | 754 | 146.3 |
| B | 12 | 111 | 16097 | 104.85 | 771 | 754 | 146.3 |
| C | 13 | 61 | 5499 | 26.34 | 779 | 784 | 179.0 |
| C | 12 | 4 | 3064 | 12.74 | 779 | 784 | 179.0 |
| C | 8 | 222 | 2260 | 8.24 | 779 | 784 | 179.0 |
| D | 1 | 52 | 334005 | 1786.07 | 781 | 762 | 186.6 |
| D | 2 | 14 | 81572 | 433.12 | 781 | 762 | 186.6 |
| D | 8 | 195 | 42646 | 224.48 | 781 | 762 | 186.6 |
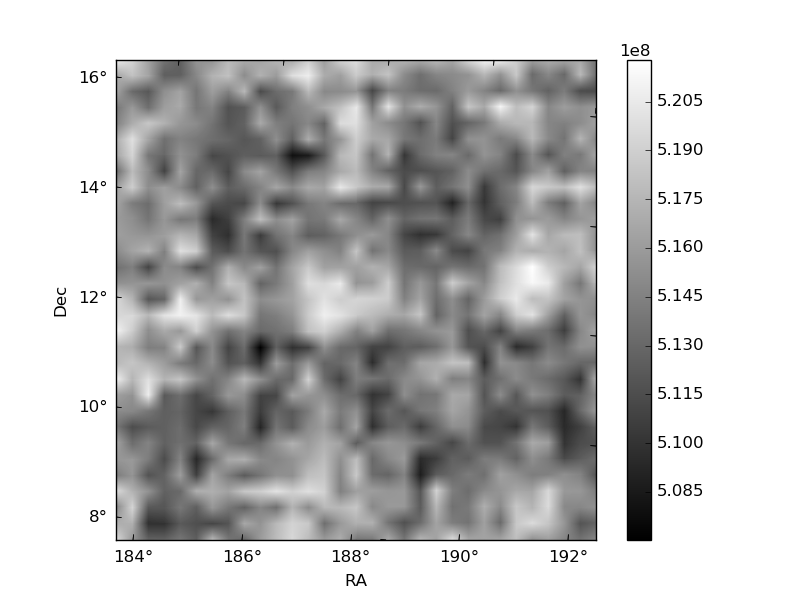
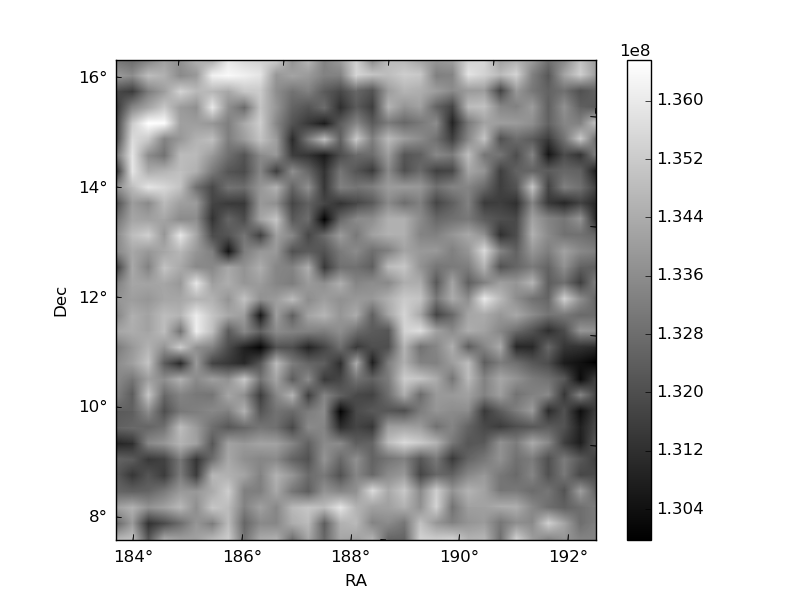
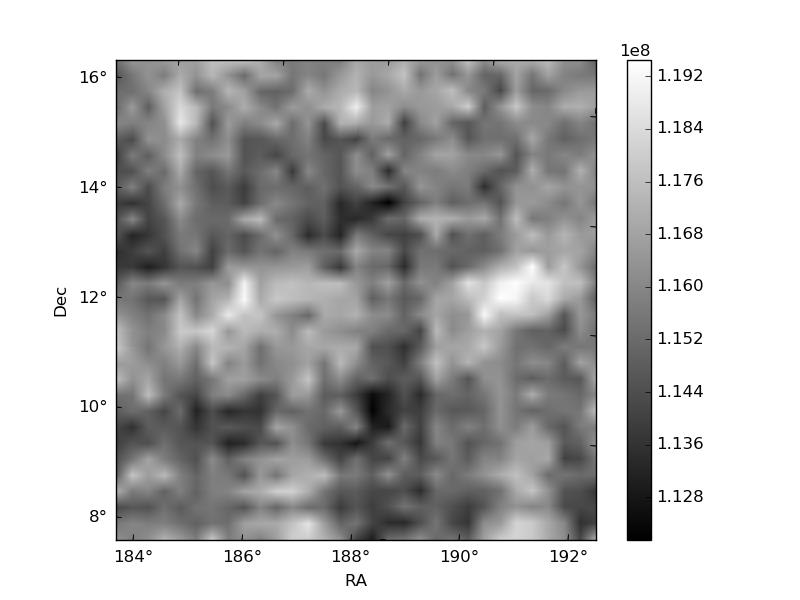
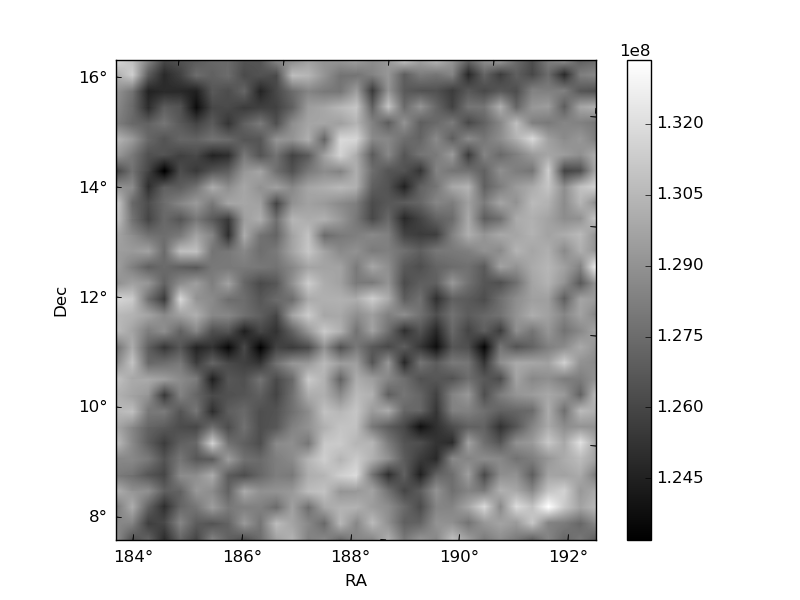
Histogram calculated using DETX and DETY for each event in the final _common_clean file
| Quadrant A | 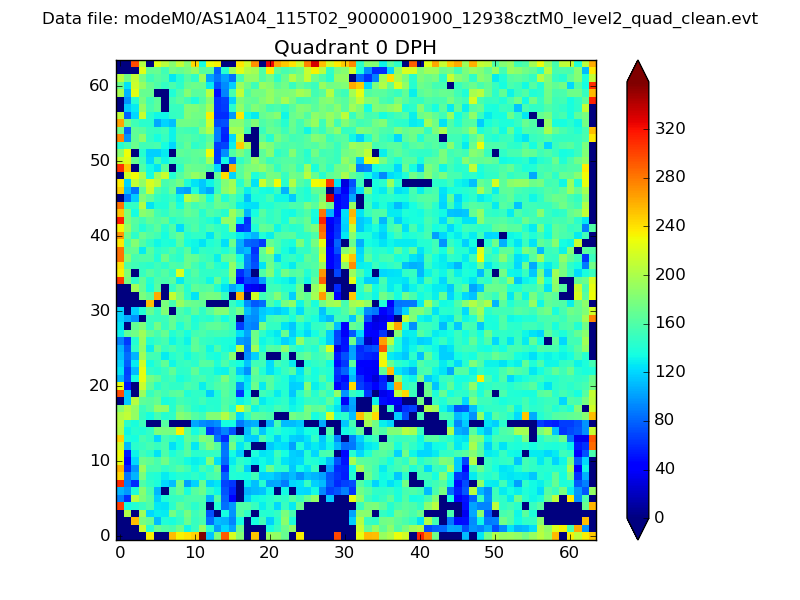 |
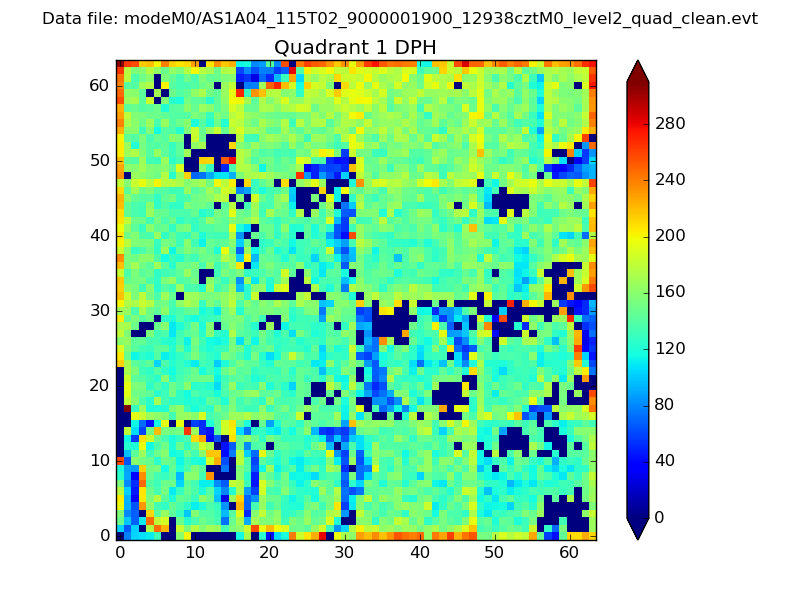 |
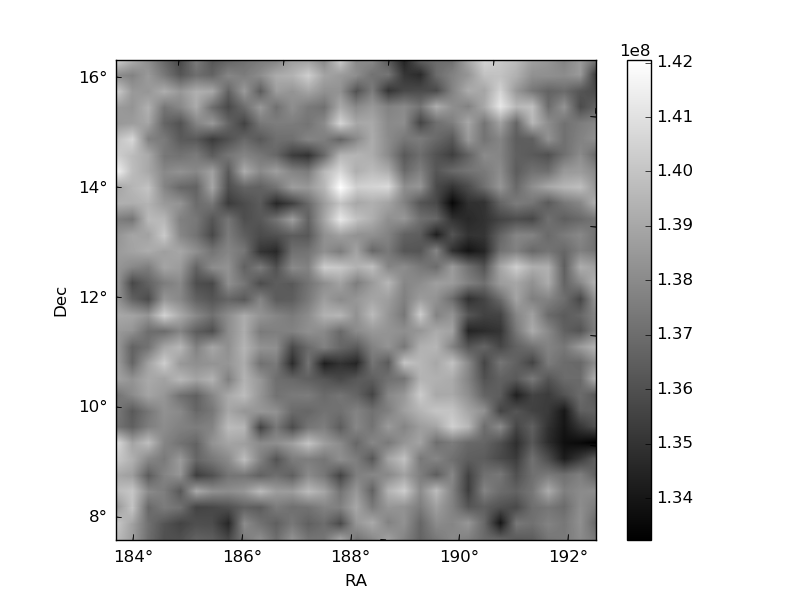
Quadrant B |
|---|---|---|---|
| Quadrant D | 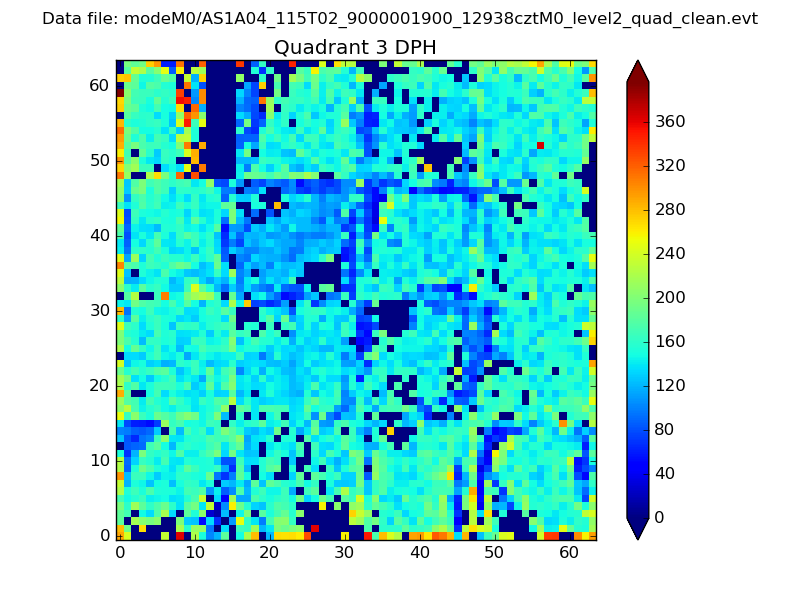 |
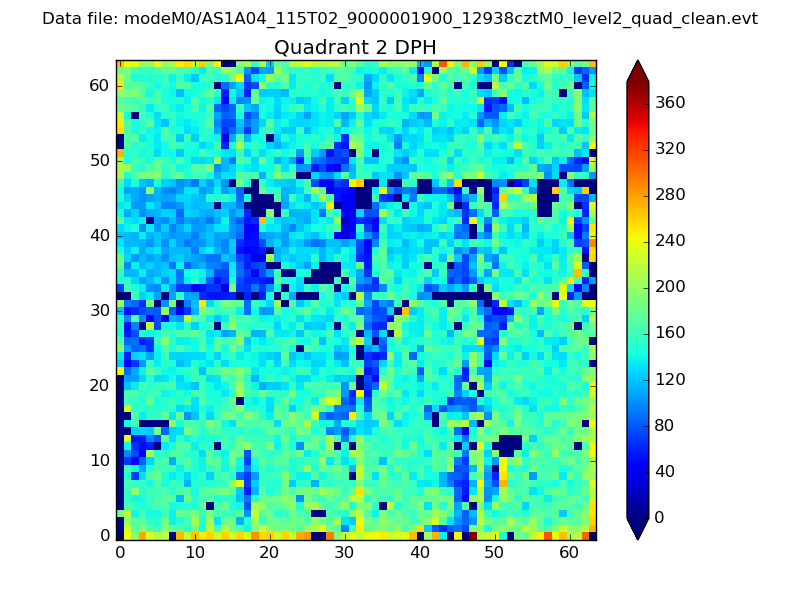 |
Quadrant C |
| Plot type | Count rate plots | Images |
|---|---|---|
| Comparison with Poisson distribution Blue bars denote a histogram of data divided into 1 sec bins. Red curve is a Poisson curve with rate = median count rate of data. |
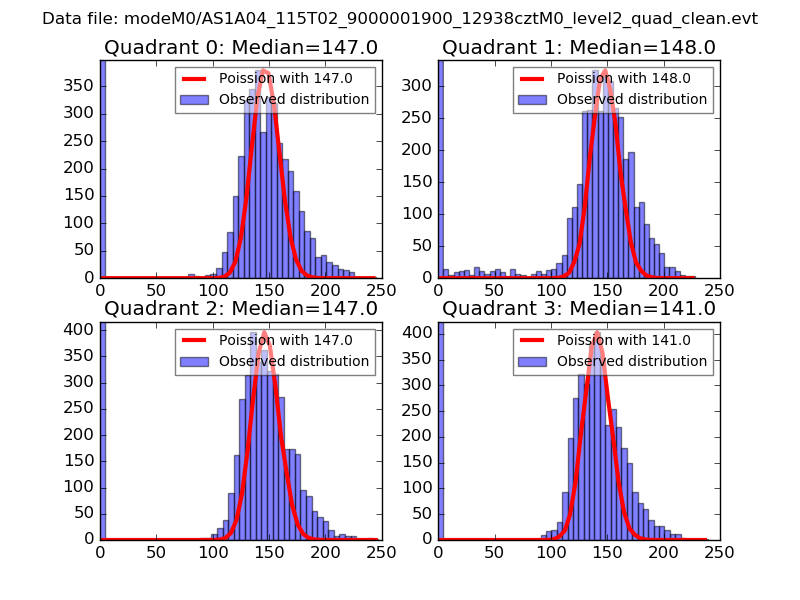 |
 |
| Quadrant-wise count rates Data is divided into 100 sec bins |
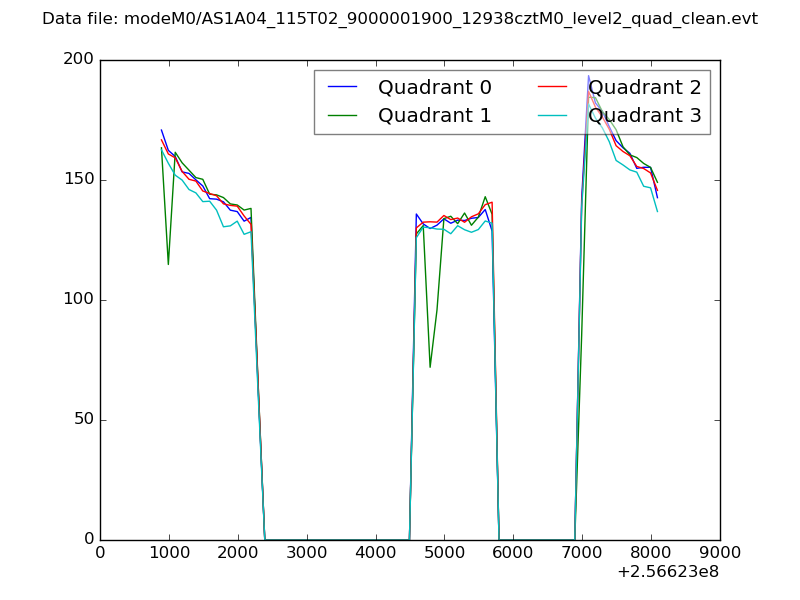 |
|
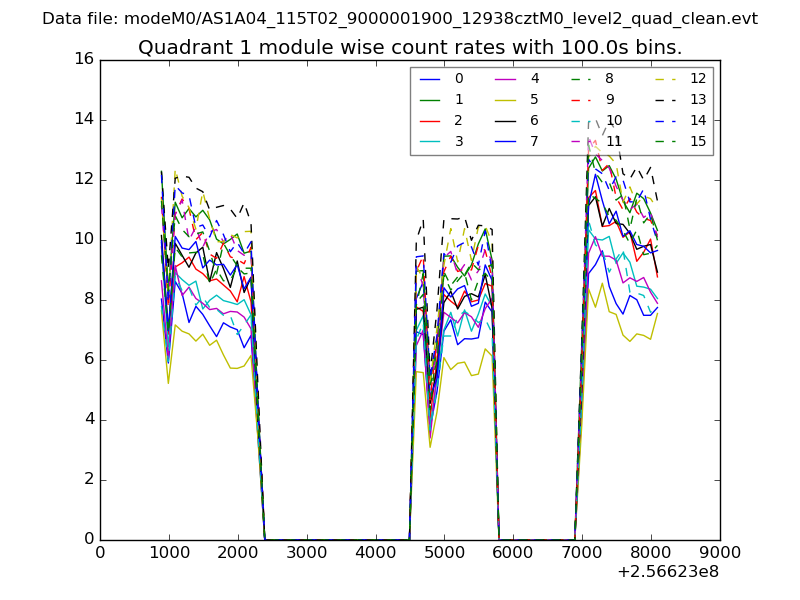
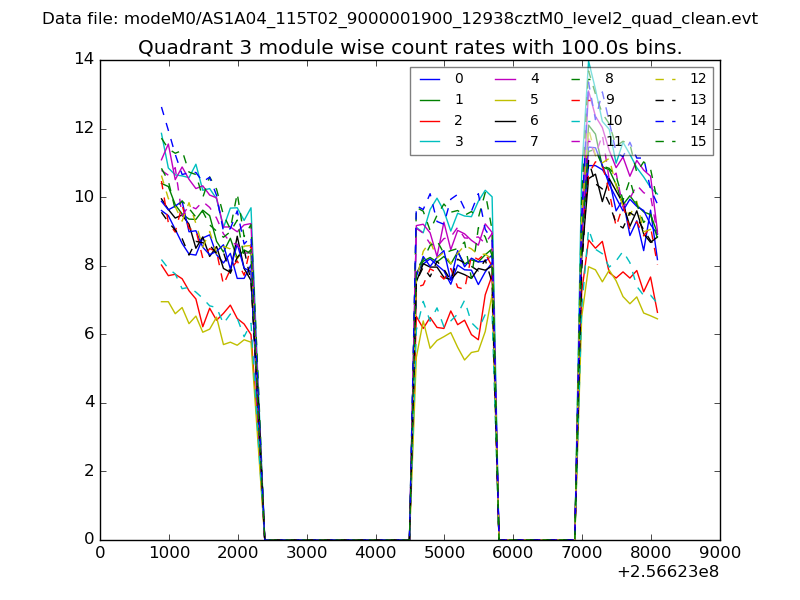
| Module-wise count rates for Quadrant A Data is divided into 100 sec bins |
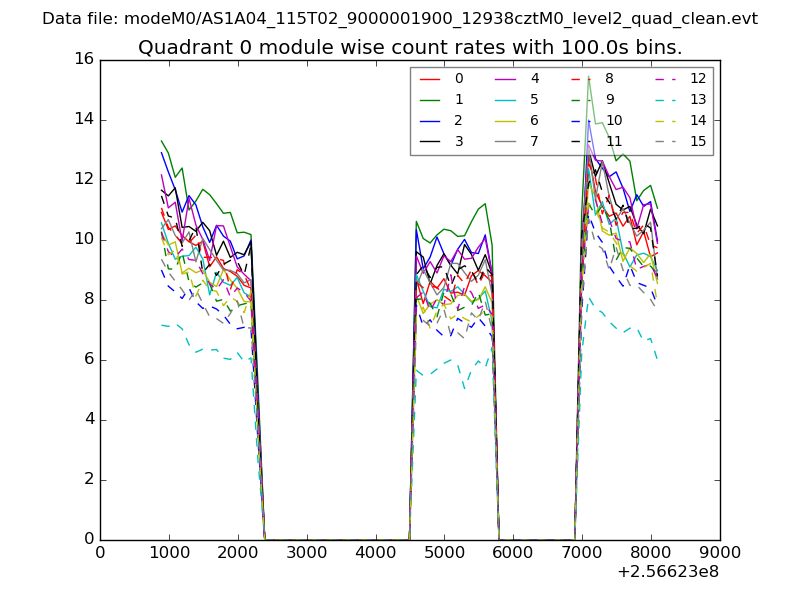 |
 |
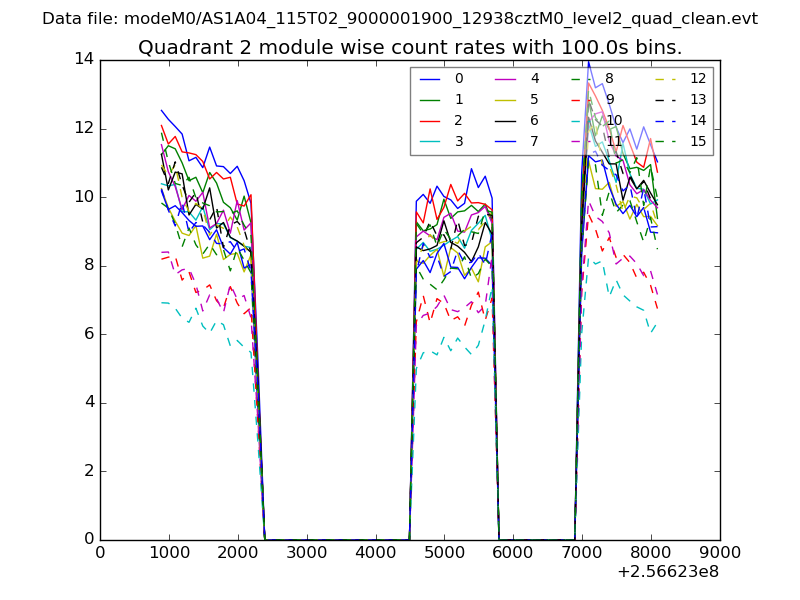
| Module-wise count rates for Quadrant B Data is divided into 100 sec bins |
 |
 |
| Module-wise count rates for Quadrant C Data is divided into 100 sec bins |
 |
 |
| Module-wise count rates for Quadrant D Data is divided into 100 sec bins |
 |
 |
| Parameter | Plot |
|---|---|
| CZT HV Monitor | 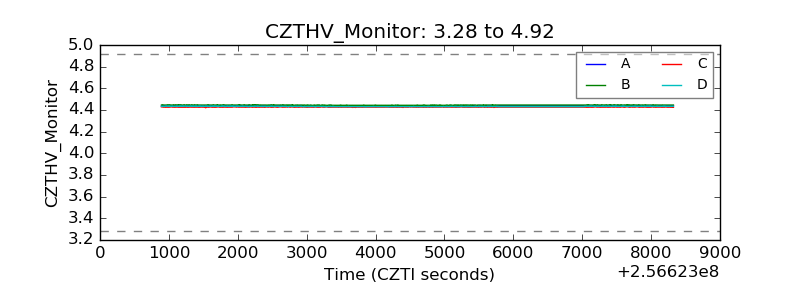 |
| D_VDD | 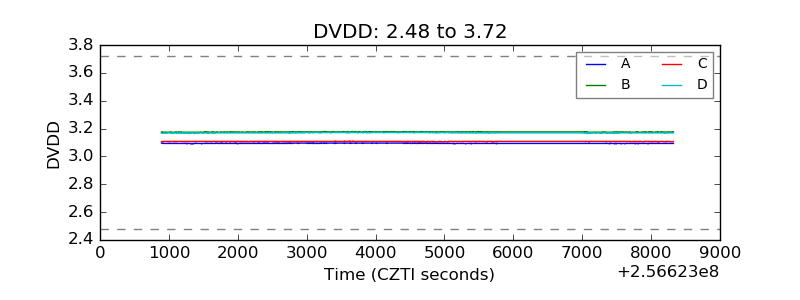 |
| Temperature 1 | 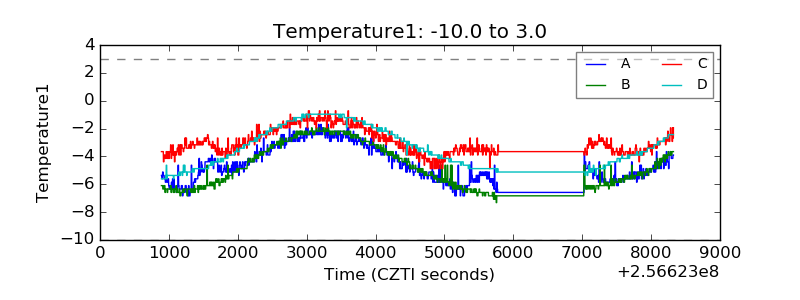 |
| Veto HV Monitor | 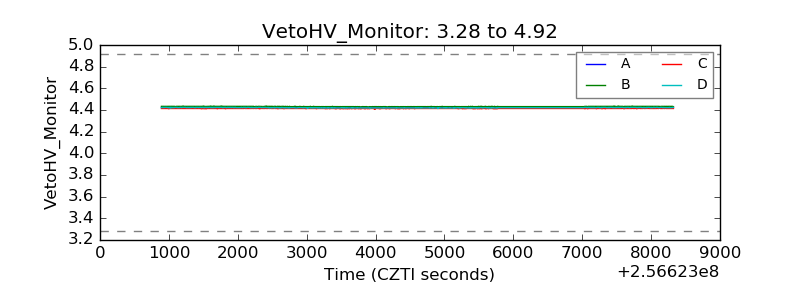 |
| Veto LLD | 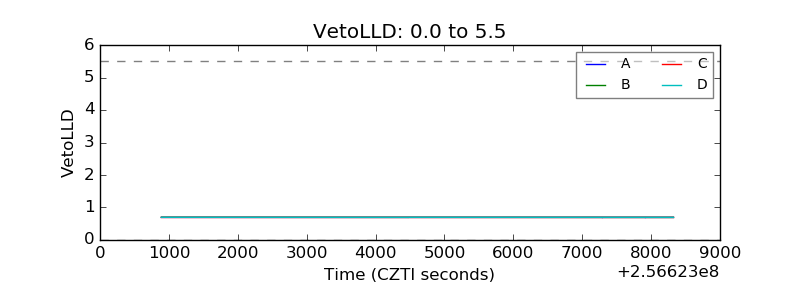 |
| Alpha Counter | 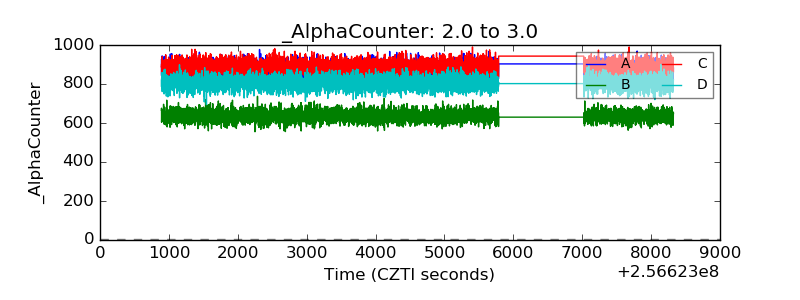 |
| _CPM_Rate |  |
| CZT Counter | 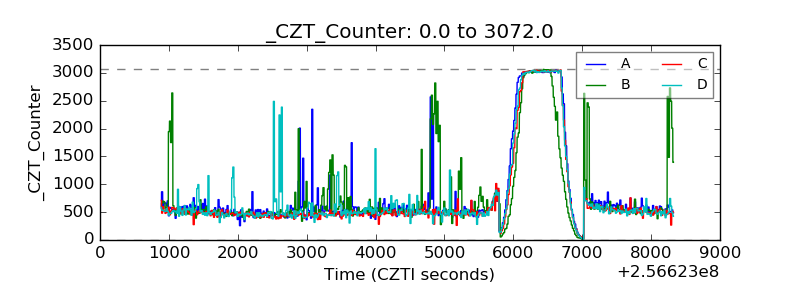 |
| +2.5 Volts monitor |  |
| +5 Volts monitor |  |
| _ROLL_ROT | 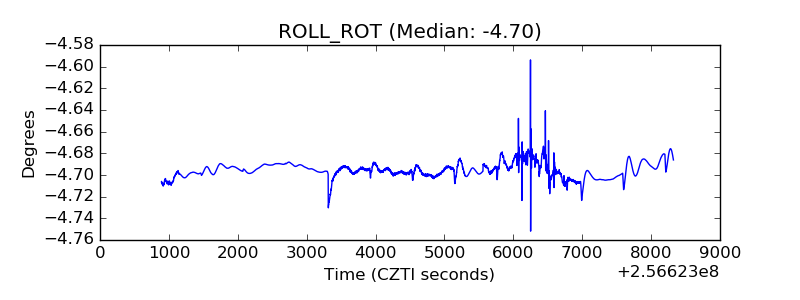 |
| _Roll_DEC | 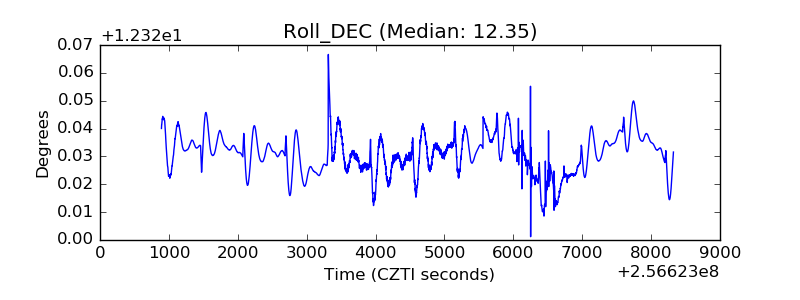 |
| _Roll_RA | 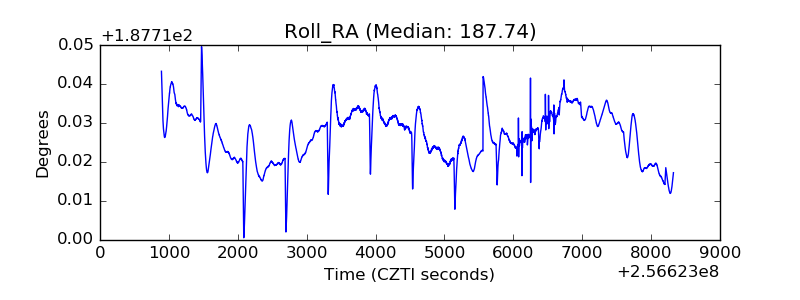 |
| Veto Counter | 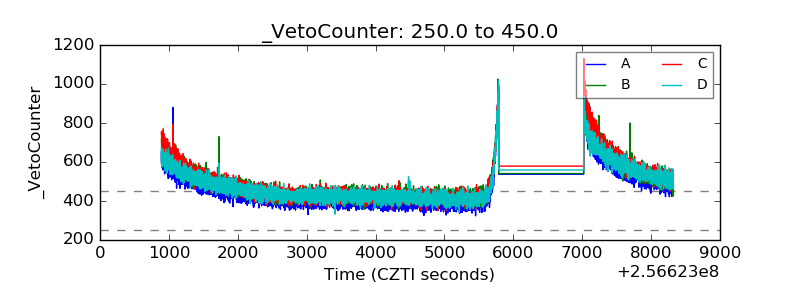 |